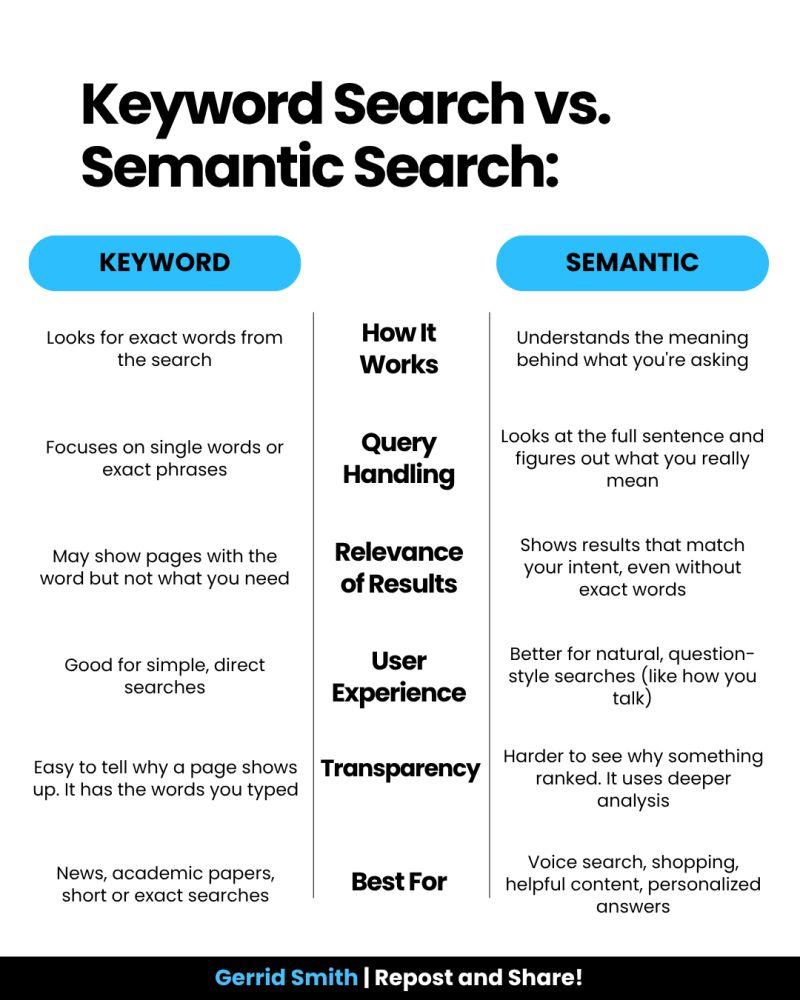
In the early days of the web, the search bar was a luxury, added to a site once it became “too big” to navigate by clicking. We treated it like an index at the back of a book: a literal, alphabetical list of words that pointed to specific pages. If you typed the exact word the author used, you found what you needed. If you didn’t, you were met with a “0 Results Found” screen that felt like a digital dead end.
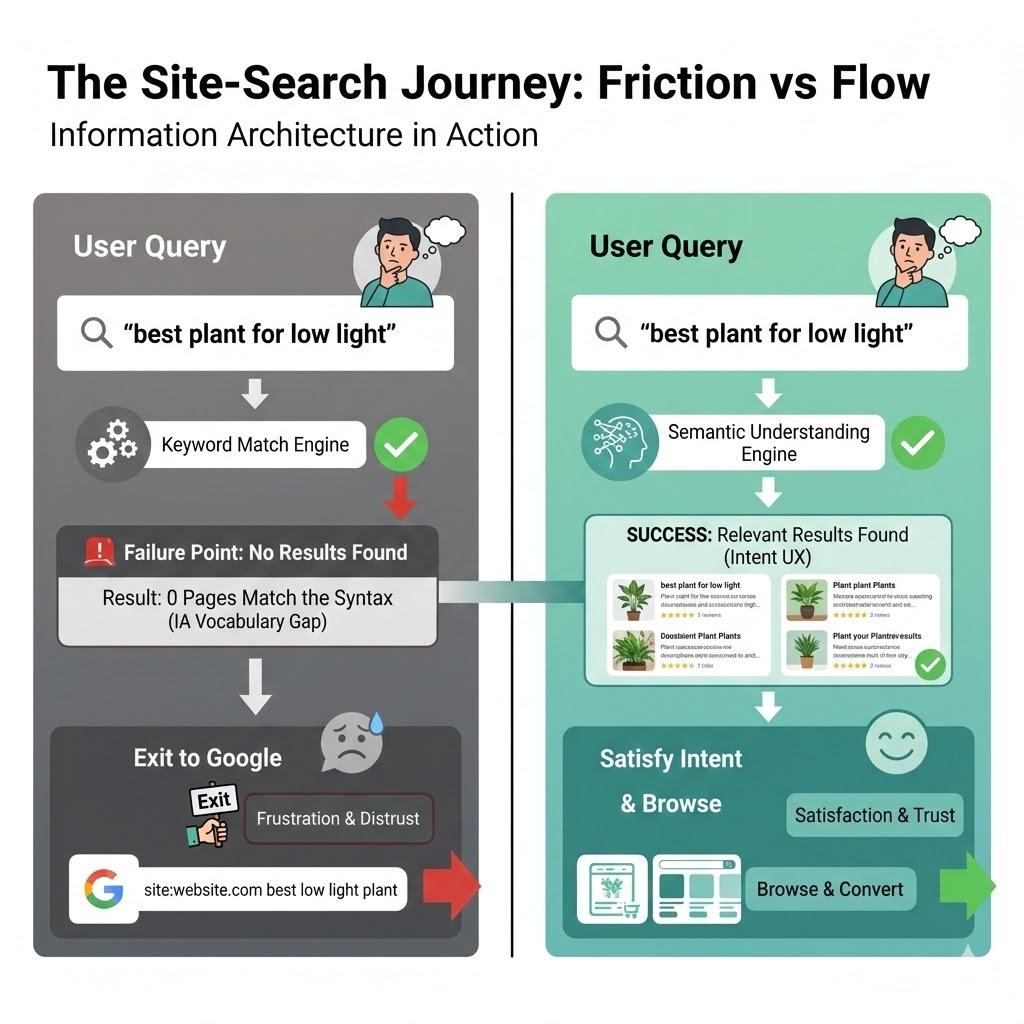
Twenty-five years later, we are still building search bars that act like 1990s index cards, even though the humans using them have been fundamentally rewired. Today, when a user lands on your site and can’t find what they need in the global navigation within seconds, they don’t try to learn your taxonomy. They head for the search box. But if that box fails them, and demands they use your specific brand vocabulary, or punishes them for a typo, they do something that should keep every UX designer awake at night. They leave your site, go to Google, and type site:yourwebsite.com [query]. Or, worse still, they just type in their query and end up on a competitor’s website. I personally use Google over a site’s search nearly every time.
This is the Site-Search Paradox. In an era where we have more data and better tools than ever, our internal search experiences are often so poor that users prefer to use a trillion-dollar global search engine to find a single page on a local site. As Information Architects and UX designers, we have to ask, why does the “Big Box” win, and how can we take our users back?
The “Syntax Tax” And The Death Of Exact Match
The primary reason site search fails is what I call the Syntax Tax. This is the cognitive load we place on users when we require them to guess the exact string of characters we’ve used in our database.
Research by Origin Growth on Search vs Navigate shows that roughly 50% of users go straight to the search bar upon landing on a site. For example, when a user types “sofa” into a furniture site that has categorised everything under “couches,” and the site returns nothing, the user doesn’t think, “Ah, I should try a synonym.” They think, “This site doesn’t have what I want.”
This is a failure of Information Architecture (IA). We’ve built our systems to match strings (literal sequences of letters) rather than things (the concepts behind the words). When we force users to match our internal vocabulary, we are taxing their brainpower.
Why Google Wins: It’s Not Power, It’s Context
It is easy to throw our hands up and say, “We can’t compete with Google’s engineering.” But Google’s success isn’t just about raw power; it’s about contextual understanding. While we often treat search as a technical utility, Google treats it as an IA challenge.
Data from the Baymard Institute reveals that 41% of e-commerce sites fail to support even basic symbols or abbreviations, and this often leads to users abandoning a site after a single failed search attempt. Google wins because it uses stemming and lemmatization — IA techniques that recognize “running” and “ran” are the same intent. Most internal searches are “blind” to this context, treating “Running Shoe” and “Running Shoes” as entirely different entities.
If your site search can’t handle a simple plural or a common misspelling, you are effectively charging your users a tax for being human.
The UX Of “Maybe”: Designing For Probabilistic Results
In traditional IA, we think in binaries: A page is either in a category, or it isn’t. A search result is either a match or it isn’t. Modern search, which users now expect, is probabilistic. It deals in “confidence levels.”
According to Forresters, users who use search are 2–3 times more likely to convert than those who don’t, if the search works. And 80% of users on e-commerce sites exit a site due to poor search results.
As designers, we rarely design for the middle ground. We design a “Results Found” page and a “No Results” page. We miss the most important state: The “Did You Mean?” State. A well-designed search interface should provide “Fuzzy” matches. Instead of a cold “0 Results Found” screen, we should be using our metadata to say, “We didn’t find that in ‘Electronics,’ but we found 3 matches in ‘Accessories’.” By designing for “Maybe,” we can keep the user in the flow.
Case Study: The Cost Of “Invisible” Content
To understand why IA is the fuel for the search engine, we must look at how data is structured behind the scenes. In my 25 years of practice, I’ve seen that the “findability” of a page is directly tied to its structured metadata.
Consider a large-scale enterprise I worked with that had over 5,000 technical documents. Their internal search was returning irrelevant results because the “Title” tag of every document was the internal SKU number (e.g., “DOC-9928-X”) rather than the human-readable name.
By reviewing the search logs, we discovered that users were searching for “installation guide.” Because that phrase didn’t appear in the SKU-based title, the engine ignored the most relevant files. We implemented a Controlled Vocabulary, which was a set of standardised terms that mapped SKUs to human language. Within three months, the “Exit Rate” from the search page dropped by 40%. This wasn’t an algorithmic fix; it was an IA fix. It proves that a search engine is only as good as the map we give it.
The Internal Language Gap
Throughout my two decades in UX, I’ve noticed a recurring theme: internal teams often suffer from “The curse of knowledge.” We become so immersed in our own corporate vocabulary, or sometimes referred to as business jargon, that we forget the user doesn’t speak our language.
I once worked with a financial institution that was frustrated by high call volumes to their support centre. Users were complaining they couldn’t find “loan payoff” information on the site. When we looked at the search logs, “loan payoff” was the #1 searched term that resulted in zero hits.
Why? Because the institution’s IA team had labelled every relevant page under the formal term “Loan Release.” To the bank, a “payoff” was a process, but a “Loan Release” was the legal document that was the “thing” in the database. Because the search engine was looking for literal character strings, it refused to connect the user’s desperate need with the company’s official solution.
This is where the IA professional must act as a translator. By simply adding “loan payoff” as a hidden metadata keyword to the Loan Release pages, we solved a multi-million dollar support problem. We didn’t need a faster server; we needed a more empathetic taxonomy.
The 4-step Site-search Audit Framework
If you want to reclaim your search box from Google, you cannot simply “set it and forget it.” You must treat search as a living product. Here is the framework I use to audit and optimise search experiences:
Phase 1: The “Zero-result” Audit
Pull your search logs from the last 90 days. Filter for all queries that returned zero results. Group these into three buckets:
True gaps Content the user wants that you simply don’t have (a signal for your content strategy team).
Synonym gaps Content you have, but described in words the user doesn’t use (e.g., “Sofa” vs “Couch”).
Format gaps The user is looking for a “video” or “PDF,” but your search only indexes HTML text.
Phase 2: Query Intent Mapping
Analyse the top 50 most common queries. Are they Navigational (looking for a specific page), Informational (looking for “how to”), or Transactional (looking for a specific product)? Your search UI should look different for each. A navigational search should “Quick-Link” the user directly to the destination, bypassing the results page entirely.
Phase 3: The “Fuzzy” Matching Test
Intentionally mistype your top 10 products. Use plurals, common typos, and American vs. British English spellings (e.g., “Color” vs. “Colour”). If your search fails these tests, your engine lacks “stemming” support. This is a technical requirement you must advocate for to your engineering team.
Phase 4: Scoping And Filtering UX
Look at your results page. Does it offer filters that actually make sense? If a user searches for “shoes,” they should see filters for Size and Colour. Generic filters can be as bad as no filters.
Reclaiming The Search Box: A Strategy For IA Professionals
To stop the exodus to Google, we must move beyond the “Box” and look at the scaffolding.
Step A: Implement semantic scaffolding. Don’t just return a list of links. Use your IA to provide context. If a user searches for a product, show them the product, but also show them the manual, the FAQs, and the related parts. This “associative” search mimics how the human brain works and how Google operates.
Step B: Stop being a librarian, start being a concierge. A librarian tells you exactly where the book is on the shelf. A concierge listens to what you want to achieve and gives you a recommendation. Your search bar should use predictive text not just to complete words, but to suggest intentions.
Using A Google-powered Search Bar
Using a “Google-powered” search bar, as seen on the University of Chicago website, is essentially an admission that a site’s internal organisation has become too complex for its own navigation to handle. While it is a quick “fix” for massive institutions to ensure users find something, it is generally a poor choice for businesses with deep content.
By delegating the search to Google, you surrender the user experience to an outside algorithm. You lose the ability to promote specific products, you expose your users to third-party ads, and you train your customers to leave your ecosystem the moment they need help. For a business, search should be a curated conversation that guides a customer toward a goal, not a generic list of links that pushes them back to the open web.
The Simple Search UX Checklist
Here is a final checklist for reference when you are building the search experience for your users. Work with your product team to ensure you are engaging with the right team members.
Kill the dead-end. Never just say “No results found.” If an exact match isn’t there, suggest a similar category, a popular product, or a way to contact support.
Fix “almost” matches. Make sure the search can handle plurals (like “plant” vs. “plants”) and common typos. Users shouldn’t be punished for a slip of the thumb.
Predict the user’s goal. Use an “auto-suggest” menu to show helpful actions (like “Track my order”) or categories, not just a list of words.
Talk like a human. Look at your search logs to see the words people actually use. If they type “couch” and you call it “sofa,” create a bridge in the background so they find what they need anyway.
Smart filtering. Only show filters that matter. If someone searches for “shoes,” show them size and color filters, not a generic list that applies to the whole site.
Show, don’t just list. Use small thumbnails and clear labels in the search results so users can see the difference between a product, a blog post, and a help article at a glance.
Speed is trust. If the search takes more than a second, use a loading animation. If it’s too slow, people will immediately go back to Google.
Check the “failure” logs. Once a month, look at what people searched for that returned zero results. This is your “to-do list” for fixing your site’s navigation.
Conclusion: The Search Bar Is A Conversation
The search box is the only place on your site where the user tells us exactly, in their own words, what they want. When we fail to understand those words, when we let the “Big Box” of Google do the work for us, we aren’t just losing a page view. We are losing the opportunity to prove that we understand our customers.
Success in modern UX isn’t about having the most content; it’s about having the most findable content. It’s time to stop taxing users for their syntax and start designing for their intent.
By moving from literal string matching to semantic understanding, and by supporting our search engines with robust, human-centered Information Architecture, we can finally close the gap.
I have some basic understanding of code structure — learned BASIC as a kid, touched HTML and PHP years ago — but I’m not a developer in any practical sense. I built Pulso Bot — AI support bots for Telegram businesses — by writing specs and letting Claude Code do the actual coding. Took about two weeks of real work to get something live.
Then I spent the next 12 days doing “distribution.” That’s the part nobody warns you about properly.
The listing grind
I submitted everywhere. Product Hunt, AlternativeTo, SaaSHub, Indie Hackers, TopTelegramBots, FutureTools — probably 15 sites total. Some approved in a day, some took a week, some are still pending. AlternativeTo took 7 days to approve. No traffic came from it yet.
Product Hunt launched March 24. A few upvotes from people I don’t know. Zero signups. I’m not complaining — I had no existing audience, no hunter with followers, nothing. The result makes sense in retrospect.
The dev.to article got maybe 30 views. This one included.
What I got wrong
I was targeting the right directories for the wrong people. Everyone who found Pulso Bot through these channels was a developer or another founder. Not a single small business owner.
And here’s the thing — small business owners who already use Telegram bots know how to get one built. The ones who don’t, don’t know they need one yet. I’m trying to reach people at exactly the moment they’re frustrated enough to look for a solution. That moment doesn’t happen on Product Hunt.
I don’t have a fix for this. Still figuring it out.
Where things stand
Building Reddit karma in non-related subreddits so I can eventually answer questions organically without getting banned. Waiting for SEO from the listings to do something. Reaching out through personal network to find one human who runs a business on Telegram and will actually try it.
Twelve days in. Zero paying customers. Product works fine. Distribution is the actual job and I underestimated it completely.
One question
How did you find your first 10 customers when you had no audience and no budget? Not a growth hack. Just what actually worked for you specifically.
Your team uses Claude Code, Cursor, or Gemini to write code. 60-80% of new commits are AI-generated.
But when a bug appears – can you answer: which AI wrote this line?
We built Origin to solve this. Here’s how it works under the hood.
The problem
Traditional git blame shows who committed code. But when your whole team uses AI agents, “who committed” is always the developer — even when Claude wrote 90% of the file.
You lose:
• which agent generated the code
• what prompt produced it
• what model was used
• what it cost
How Origin tracks it
Every time an AI agent starts a session, Origin hooks fire:
# Claude Code hooks (auto-installed via origin init)
origin hooks claude-code session-start
origin hooks claude-code user-prompt-submit
origin hooks claude-code stop
When a commit happens, Origin writes session data to git notes:
git notes show HEAD
#Origin-Session: abc123
#Agent: claude-code
#Model: claude-opus-4-6
#Cost: $2.40
#Prompts: 12
AI Blame
Now you can see who wrote every line:
origin blame src/api.ts

Line  Tag  Model              Content
────────────────────────────────────────
1     [HU]                   import express from 'express'
2     [AI] claude-opus-4-6   const app = express()
3     [AI] claude-opus-4-6   app.use(express.json())
4     [HU]                   // my custom middleware
Retroactive attribution
Already have a repo with months of AI commits but no tracking?
origin backfill --apply
Origin analyzes commit message patterns, author emails, and code style to detect which commits were AI-generated — even without hooks.
Policy enforcement
Origin also enforces rules before commits land:
# Block commits containing secrets# Block commits to restricted files# Enforce budget limits per agent
Pre-commit hook fetches active policies from your Origin dashboard and blocks violations before they hit the repo.
Try it
npm i -g https://getorigin.io/cli/origin-cli-latest.tgz
origin init
Works with Claude Code, Cursor, Gemini CLI, Codex. Data stored in git notes — no server required for standalone mode.
Open source CLI: https://github.com/dolobanko/origin-cli
Team dashboard: https://getorigin.io
When everything online carries an “AI-powered” label and fatigue sets in, this curated list offers twelve practical DevOps and SRE solutions. The focus is infrastructure, security, observability, and incident management—mostly open-source, zero chatbots.
Table of Contents
Monitoring & Observability
Incident Management & Alerting
Infrastructure & Application Platform
Security
Dev Tools & Diagramming
Monitoring & Observability
Upright
Basecamp’s open-source synthetic monitoring system runs health checks across multiple geographic locations, reporting metrics through Prometheus without vendor lock-in.
The platform supports standard HTTP checks alongside Playwright-based browser automation for end-to-end transaction testing. Probes are defined via YAML or Ruby classes, scheduled across distributed nodes, with results feeding directly into Prometheus/AlertManager. Built using Rails, SQLite, and Kamal deployment.
Upright Github Repo (707 ⭐s) →
HyperDX
Built on ClickHouse and OpenTelemetry, this open-source observability platform consolidates logs, metrics, traces, errors, and session replays into one self-hostable interface—comparable to Datadog but self-managed.
ClickHouse’s columnar storage efficiently handles high-cardinality data. Full-text search combined with property filtering works without SQL knowledge. Built on OpenTelemetry standards, so existing OTEL data integrates directly. Most features use MIT licensing; managed cloud runs on ClickHouse Cloud.
HyperDX Github Repo (7,400 ⭐s) →
Incident Management & Alerting
Keep
An open-core AIOps alert management platform that integrates with existing monitoring stacks (Grafana, Datadog, PagerDuty) to correlate, deduplicate, and route alerts without replacing current tools.
Integration-first design connects via bidirectional integrations. Alert enrichment and suppression rules operate across your entire stack. Routing uses Python or YAML; AI correlation groups alerts using historical incident context. Self-hosted path is open source; managed service offers paid tiers above free.
Keep Github Repo (5,900 ⭐s) →
OpenStatus
An open-core uptime monitoring and status page platform with probes running from 28 regions across Fly.io, Koyeb, and Railway simultaneously.
Multi-provider probe architecture avoids the blind spot where monitors live on identical infrastructure as monitored services. Private monitoring locations via 8.5MB Docker images check internal services behind firewalls. Supports terminal-based monitoring configuration and CI/CD integration. Notifications route through Slack, Discord, PagerDuty, email, and webhooks. Self-hosted version is fully open source (AGPL-3.0); managed service includes free and paid tiers.
OpenStatus Github Repo (8,500 ⭐s) →
Infrastructure & Application Platform
Unregistry
An open-source utility enabling direct Docker image pushing to remote servers over SSH—eliminating Docker Hub, ECR, or registry infrastructure requirements.
The mechanism uses a fake registry protocol on one end while streaming layers directly to target servers via SSH. From Docker’s perspective, standard pushing occurs; images land remotely without intermediate storage. Ideal for small-to-medium deployments on dedicated servers or VPS where registry overhead feels excessive.
Unregistry Github Repo (4,656 ⭐s) →
Edka
A managed service provisioning and operating Kubernetes clusters on your Hetzner Cloud account while preserving infrastructure ownership and billing control.
Edka manages control planes, add-ons, and day-two operations. You get managed Kubernetes at Hetzner pricing without EKS, GKE, or AKS infrastructure premiums or cluster maintenance burden. The platform provides PaaS-like experiences: git-push deployments, one-click add-ons (cert-manager, metrics-server, CloudNativePG), and preview environments. Closed source with SaaS pricing.
Edka Website →
Enroll
This open-source tool SSH’s into live servers and reverse-engineers current configurations into Ansible playbooks and roles—useful for bootstrapping infrastructure-as-code on manually configured systems.
It captures installed packages, running services, modified files, and configuration typically residing only in memory or documentation. Output comprises Ansible roles suitable for version control and server state reproduction. For infrastructure predating automation practices, this approach enables controlled management without complete rebuilds.
Enroll Website →
Canine
An open-source, Kubernetes-native PaaS recreating the Heroku developer experience on your own cluster—git-push deployments, review applications, managed add-ons, and dashboards without abstraction layers hiding Kubernetes primitives.
Targets teams wanting developer-friendly workflows without Heroku expenses or fully managed PaaS opacity. Running on personal clusters provides Heroku UX while maintaining direct kubectl and Kubernetes API access. Add-ons provision as standard Kubernetes resources rather than opaque services.
Canine Github Repo (2,783 ⭐s) →
Security
Pangolin
An open-source, self-hostable tunneling server and reverse proxy serving as a Cloudflare Tunnels alternative for exposing private services without public IPs or open inbound ports.
Architecture mirrors Cloudflare Tunnels: lightweight agents establish outbound connections to Pangolin instances, which handle TLS termination and inbound request routing. The distinction: you operate the tunnel server, so traffic never crosses third-party infrastructure. Nearly 20,000 GitHub stars demonstrate team appetite for convenience without trust dependencies.
Pangolin Github Repo (19,230 ⭐s) →
Octelium
An open-source zero-trust access platform consolidating four typically separate tools into one self-hostable stack: Teleport (infrastructure access), Cloudflare Access (application proxying), Tailscale (network connectivity), and Ngrok (tunneling).
Consolidation eliminates overlapping policies, fragmented audit logs, and multiple agent maintenance. Octelium handles SSH/RDP access, HTTP application proxying, private network tunneling, and identity-aware policy enforcement with unified audit trails. Over 3,400 stars for this newer project validate zero-trust consolidation appeal.
Octelium Github Repo (3,421 ⭐s) →
Dev Tools & Diagramming
IcePanel
A collaborative architecture diagramming tool structured around the C4 model—System Context, Container, Component, and Code hierarchy providing distributed system diagrams with shared grammar.
Unlike Miro or Lucidchart, IcePanel employs model-first rather than drawing-first approaches. Objects defined once reuse across diagrams; updating service names or dependencies cascades automatically everywhere. For teams experiencing architecture documentation drift, this single-source-of-truth constraint delivers real value. Closed source and SaaS-exclusive.
IcePanel Website →
Witr
An open-source CLI tool answering a fundamental question: why is this process running? Given a PID or process name, it traces parent chains, resolves responsible systemd units, and follows startup scripts to origins.
During incidents, quickly discovering what spawned unexpected production processes saves time. Witr handles common scenarios: systemd-initiated processes, cron jobs, init scripts, and container entrypoints—displaying chains in readable trees. Practical for incident investigation runbooks.
Witr Github Repo (13,480 ⭐s) →
Conclusion
DevOps tooling need not be complex. The most valuable tools quietly solve specific operational problems and remain unobtrusive.
This collection likely includes at least one tool worth integrating into your workflow. Share your favorite 2026 DevOps and SRE tools at contact@statuspal.io. 🚀
I wanted to find a way to move the Main Camera in Unity when the only available input device was a Leap Motion (no mouse or keyboard).
Demo
Here’s what I built. (The display shown is a Looking Glass, but that’s not the focus of this article.)
// Detect dark theme
var iframe = document.getElementById(‘tweet-1108794958318702592-826’);
if (document.body.className.includes(‘dark-theme’)) {
iframe.src = “https://platform.twitter.com/embed/Tweet.html?id=1108794958318702592&theme=dark”
}
When your hand is in a fist shape, the camera moves with your hand. When you open your hand, it stops. It feels like 3D mouse dragging — you can also move forward and backward.
Sample Code
Here’s the code. Attach this script to a camera object and it should work. It uses UniRx.
usingLeap;usingSystem.Collections.Generic;usingSystem.Linq;usingUniRx;usingUniRx.Triggers;usingUnityEngine;/// <summary>/// Camera controller/// </summary>publicclassCameraController:MonoBehaviour{/** Camera movement speed */privatefloatspeed=0.025f;/** Leap Motion controller */privateControllercontroller;/** Entry point */voidStart(){// Leap Motion controllercontroller=newController();// Get hand data from Leap Motion every framevarhandsStream=this.UpdateAsObservable().Select(_=>controller.Frame().Hands);// Stream that fires when the fist gesture endsvarendRockGripStream=handsStream.Where(hands=>!IsRockGrip(hands));// Camera controlhandsStream// Only when making a fist.Where(hands=>IsRockGrip(hands))// Get palm position.Select(hands=>ToVector3(hands[0].PalmPosition))// Buffer current and previous values (2 values with step 1).Buffer(2,1)// Calculate movement vector from the difference.Select(positions=>positions[1]-positions[0])// Log the movement.Do(movement=>Debug.Log("Movement: "+movement))// Clear the buffer when the fist gesture ends.TakeUntil(endRockGripStream).RepeatUntilDestroy(this)// Move the camera.Subscribe(movement=>transform.Translate(-speed*movement));}/** Check if hand is making a fist */boolIsRockGrip(List<Hand>hands){return// One hand detectedhands.Count==1&&// All fingers are closed (none extended)hands[0].Fingers.ToArray().Count(x=>x.IsExtended)==0;}/** Convert Leap Vector to Unity Vector3 */Vector3ToVector3(Vectorv){returnnewVector3(v.x,v.y,-v.z);}}
About UpdateAsObservable
This converts Unity’s Update() into a reactive stream.
This article explains it in detail:
UniRx Introduction Part 4 — Converting Update to a Stream
About IsRockGrip
This method detects whether the hand is in a fist shape.
First, hands.Count checks that Leap Motion detects exactly one hand. Then, hands[0].Fingers.ToArray().Count(x => x.IsExtended) counts how many fingers are extended. If the count is 0, we treat it as a fist.
This technique was inspired by:
Rock-Paper-Scissors Recognition with Leap Motion + Unity
About ToVector3
Leap Motion uses a right-handed coordinate system
Unity uses a left-handed coordinate system
To compensate for this difference, we flip the sign of the z-coordinate.
About TakeUntil
TakeUntil is used to discard the buffer when the fist gesture ends.
Without this, the last palm position before the fist ended would remain in the buffer. The next time you make a fist, the camera would jump suddenly due to the stale buffered value.
This technique was referenced from:
UniRx: Building Pinch In/Out Quickly
Closing
With two hands, you could probably implement pinch-to-zoom as well. I’d like to try that next!
Does the choice of programming language affect how fast developers deliver code? This question matters for engineering teams evaluating technology stacks, yet it is notoriously hard to answer. Self-reported surveys suffer from recall bias, lines-of-code comparisons conflate conciseness with productivity, and controlled experiments rarely scale beyond a handful of participants.
In 2024, Meta introduced Diff Authoring Time (DAT) – the wall-clock time from when a developer starts working on a code change to when they submit it for review – as a scalable, telemetry-based productivity metric. Inspired by that work, we adapted the concept for IntelliJ IDEA’s built-in usage telemetry (feature usage statistics) and constructed IDE-DAT: the time from first code edit to push, measured directly inside the IDE.
This post presents a large-scale observational study comparing development cycle speed in Java and Kotlin. We analyzed telemetry data from approximately 320,000 IntelliJ IDEA developers over 20 months (November 2023 – June 2025), covering roughly 28 million development cycles.
After controlling for user, project, overall time trend, and task size, we find that development cycles in Kotlin-oriented projects are generally shorter than comparable cycles in Java-oriented projects – roughly 15–20% shorter for everyday small, medium, and large tasks. In practice, the main pattern is not a dramatic one-time speedup, but slower degradation over time: as projects mature, cycle times in unmigrated Java contexts tend to grow, while Kotlin-oriented contexts deteriorate less.
A note on transparency. JetBrains is the creator of Kotlin, and we are aware that any study comparing Kotlin favorably to Java may be perceived as biased. For this reason, we rely on a rigorous statistical framework – longitudinal difference-in-differences on log-transformed outcomes, with multiple control groups and validity checks. We present the methodology, the data, the limitations, and the open questions in full so the reader can assess the strength of the evidence independently.
In the sections that follow, we describe the metric (Section 1), present the key finding and its practical magnitude (Section 2), walk through the detailed results (Section 3), examine threats to validity and open questions (Section 4), and document the full methodology (Section 5).
1. Measuring development speed: The IDE-DAT metric
1.1 The “first edit → push” cycle
IDE-DAT (IDE diff authoring time) is an adaptation of Meta’s DAT for IntelliJ IDE telemetry.
We measure the duration of a single development cycle:
Cycle start = the moment of the first Java/Kotlin file edit after the previous push.
Cycle end = the moment of the next push.
IDE-DAT = wall-clock time between them.
This serves as a proxy for “time spent working on a single change” – from the moment a developer starts writing code to the moment they push the result.
1.2 How task size is determined
Within each cycle, we count the number of edit events – instances of file editing that the IDE reports, with a one-minute cooldown (after each report, the system remains silent for one minute, even if the developer continues typing). The number of edit events is a proxy for task size: roughly speaking, how many times the developer switched between reading and writing code during the cycle. We do acknowledge, though, that the number of edits may also depend on the seniority level of the developers studied.
Cycles are grouped into size buckets:
Bucket
Number of edits
Typical cycle duration (median, Java)
What kind of tasks
S
1–5
~10 min
Small fix, single-file change
M
6–15
~30 min
Small feature, bug fix
L
16–40
~1.5–2 h
Feature spanning multiple files
XL
41+
~10 h
Large feature or refactoring
1.3 How cycle language is determined
For each cycle, edit events are tallied by file type. If Java edits outnumber Kotlin edits, the cycle is classified as a Java cycle; if Kotlin edits outnumber Java edits, it is classified as a Kotlin cycle. Cycles with equal counts are excluded.
1.4 What the metric does not measure
Time spent on code review, planning, discussions, or CI/CD.
Code quality (bugs and reverts).
The distinction between pushing to a feature branch vs. main (branch names are not reported).
Code volume in lines (an edit event ≠ number of lines).
2. Key finding: Kotlin cycles are shorter
2.1 Development cycles in Kotlin are shorter for comparable tasks
Using the primary longitudinal log-DiD estimator on user-project × task-size contexts, the “first edit → push” cycle is shorter after migration to Kotlin than in comparable unmigrated Java contexts:
Task size
Typical cycle (Java)*
Primary estimate
95% CI
In absolute terms**
S: small fix
~10 min
−15.7%
[−24.4%, −6.0%]
~1–2 min faster
M: small feature
~30 min
−20.3%
[−31.3%, −7.6%]
~6 min faster
L: multi-file feature
~1.5 – 2 h
−15.1%
[−26.8%, −1.6%]
~15–20 min faster
XL: large feature
~10 h
−11.0%
[−23.5%, +3.5%]
Directionally ~1 h faster, but imprecise
* Approximate median cycle duration in the Kotlin migrants’ Java phase for that task-size bucket. Exact bucket medians are shown in Section 3.3.
** Approximate translation of the primary percentage estimate into minutes or hours for a typical Java cycle in that bucket.
How to read the table: A “small feature” (bucket M) is a cycle in which the developer made 6–15 editing sessions before pushing. A typical such cycle in Java lasts ~30 minutes from first edit to push. In the primary estimator, the corresponding post-migration Kotlin context is 20.3% shorter – approximately 24 minutes instead of 30.
The effect is obtained using a longitudinal difference-in-differences on log(DAT): For each user-project and task-size bucket, we compare the pre→post change among Java→Kotlin migrants with the corresponding change in the unmigrated ava control group. This subtracts the overall time trend and isolates the effect associated with the transition to Kotlin.
Important: In the stricter estimator, the bulk of the effect is still explained by degradation in the control group, rather than by dramatic speedups among migrants. Full details can be found in Section 2.3.
2.2 A case for conservative estimation
We control for task size by the number of edit events. At the same time, Kotlin includes a number of language features (data classes, default arguments, properties, extension functions, smart casts, etc.) that make code more concise. Consequently, the same logical task (one ticket in a tracker) might require, say, 20 edits in Java but only 15 in Kotlin. These would fall into different buckets.
Therefore, in cases where this assumption holds true, a direct comparison of “the same ticket” would make the gap between the Kotlin migrants and the Java control group even larger.
2.3 How the effect manifests
The stricter DiD estimate is composed of two components (with task size controlled via buckets):
Java→Kotlin migrants improve modestly for small and medium tasks: In the primary log-scale model, pre→post change is about −8% for buckets S and M, and roughly flat for L and XL.
Unmigrated Java contexts degrade across all buckets: In the same model, pre→post change is about +9% to +17%.
In other words, projects that migrated to Kotlin exhibit materially less cycle-time growth than projects that remain on Java.
This is echoed by a complementary comparison on absolute DAT without task-size normalization: Projects that have consistently stayed on Kotlin (never migrated) degrade by +14.5% at p90 of absolute DAT, whereas unmigrated Java projects degrade by +23.1% (details in Section 3.4). Both groups degrade (projects grow more complex over time), but Kotlin projects do so at roughly half the rate at p90.
2.4 Practical magnitude
In practical terms, the central estimate corresponds to roughly 1–2 minutes saved on a small fix, ~6 minutes on a small feature, and ~15–20 minutes on a multi-file feature. For XL tasks, the point estimate is also negative, but the interval is too wide for a firm claim. Compared with the earlier descriptive median contrast, the stricter estimator no longer supports a monotonic “bigger task → bigger effect” story; the stable conclusion is narrower: for comparable tasks, Kotlin-oriented contexts show substantially less cycle-time growth than unmigrated Java controls.
3. Evidence in detail
3.1 Java→Kotlin migrants: DAT by phase
1,501 users, 1,664 user-projects, ~76K cycles. For each month of a migrant’s activity, a phase is determined by the share of Kotlin edits: Java phase (<10%), Transition (10–50%), and Kotlin phase (>50%).
Metric
Java phase (N=29,554)
Transition (N=11,657)
Kotlin phase (N=35,406)
Δ Java→Kotlin
p25 DAT
6.3 min
5.6 min
5.8 min
−8.7%
Median DAT
34.7 min
32.2 min
32.1 min
−7.5%
p75 DAT
4.51 h
4.13 h
4.02 h
−10.9%
p90 DAT
39.2 h
36.7 h
34.2 h
−12.7%
Avg DAT
14.5 h
14.0 h
13.6 h
−6.4%
Edits/cycle
22.5
19.8
24.3
+8.0%
A monotonic decrease in DAT across all percentiles, with a smooth transition through the Transition phase. Notably, the number of edits per cycle increases – tasks in the Kotlin phase are larger, yet the cycle is still shorter.
3.2 Control group: Unmigrated Java
320,248 users, 665,154 user-projects, ~28M cycles. Users who remained on Java (kotlin_share <10% at the start and end, ≥4 active months). Their history is divided into three equal time-based thirds.
Metric
Early
Middle
Late
Δ Early→late
p25 DAT
6.6 min
6.2 min
6.0 min
−8.4%
Median DAT
38.9 min
37.7 min
35.7 min
−8.2%
p75 DAT
5.25 h
5.45 h
5.35 h
+2.0%
p90 DAT
31.7 h
35.5 h
39.0 h
+23.1%
Avg DAT
12.7 h
13.7 h
14.5 h
+14.1%
Edits/cycle
21.2
19.6
17.9
−15.4%
The unmigrated Java group exhibits degradation: the median decreases slightly, but the tails (p75, p90) and the mean increase substantially. Projects grow more complex, long cycles become even longer, and the number of edits per cycle declines.
3.3 Primary longitudinal log-DiD with task-size control
We compare the DAT of same-size cycles among migrants (Java phase vs. Kotlin phase) and the control group (early vs. late). The bucket-level median tables below are provided for descriptive context only. The primary effect size is estimated afterwards on the basis of pre/post changes in log(DAT) at the user-project × task-size-bucket level.
Java→Kotlin migrants – median DAT by bucket and phase:
Bucket
Java phase
Kotlin phase
Δ
S: 1–5 edits
10.4 min
9.6 min
−7.5%
M: 6–15 edits
33.9 min
31.9 min
−5.8%
L: 16–40 edits
1.82 h
1.70 h
−6.3%
XL: 41+ edits
11.4 h
12.2 h
+6.7%
unmigrated Java control group: median DAT by bucket:
Bucket
Early
Late
Δ
S: 1–5 edits
10.5 min
11.0 min
+4.7%
M: 6–15 edits
35.2 min
38.8 min
+10.3%
L: 16–40 edits
1.93 h
2.27 h
+17.7%
XL: 41+ edits
12.1 h
15.3 h
+26.3%
Primary estimator: log-DAT DiD on user-project × task-size-bucket contexts Panel size: 978 migrant contexts and 400,425 control contexts, each with ≥3 cycles in both pre and post periods. Standard errors are clustered by machine_id.
Task size
Migrants pre→post
unmigrated Java pre→post
Primary log-DiD effect
95% CI
S: small fix (~10 min)
−8.1%
+9.0%
−15.7%
[−24.4%, −6.0%]
M: small feature (~30 min)
−7.3%
+16.4%
−20.3%
[−31.3%, −7.6%]
L: multi-file feature (~1.5–2 h)
−0.3%
+17.5%
−15.1%
[−26.8%, −1.6%]
XL: large feature (~10 h)
−0.1%
+12.2%
−11.0%
[−23.5%, +3.5%]
The stricter estimator is less extreme than the earlier descriptive median contrast and does not support a monotonic increase with task size. The stable conclusion is narrower: For comparable tasks, Kotlin-oriented contexts show materially less cycle-time growth than unmigrated Java controls, with statistically supported negative estimates in S, M, and L, and the strongest precision in S and M. Pooling S/M/L contexts yields a primary estimate of about −17.1% (95% CI [−23.7%, −9.9%]).
As a robustness check, equal-weighting users rather than user-project contexts yields similar point estimates for S (−18.8%) and M (−20.3%), a weaker but still negative estimate for L (−13.7%), and again an imprecise estimate for XL (−11.0%). Thus, the sign is stable, while exact magnitudes depend on weighting, especially for larger tasks.
3.4 Complementary evidence from stable groups: Unmigrated Kotlin vs. unmigrated Java
Without involving migrants — comparing trends of stable groups:
Metric
unmigrated Java Δ E→L
unmigrated Kotlin Δ E→L
Median DAT
−8.2%
−7.7%
p75 DAT
+2.0%
+0.8%
p90 DAT
+23.1%
+14.5%
Avg DAT
+14.1%
+9.9%
Edits/cycle
−15.4%
−12.4%
Unmigrated Kotlin projects degrade roughly half as fast at p90 and ~4 pp slower on average. This provides complementary evidence from stable groups and shows a directionally similar pattern without using the migrant cohort.
3.5 Cross-sectional comparison: Within-month
The most controlled design: same user, same project, same month, and same task size. 1,801 users and 6,908 contexts.
Bucket
Java (median DAT)
Kotlin (median DAT)
Δ
S: 1–5 edits
10.1 min
9.8 min
−2.0%
M: 6–15 edits
31.6 min
31.6 min
0%
L: 16–40 edits
1.69 h
1.62 h
−3.9%
XL: 41+ edits
9.76 h
10.91 h
+11.8%
The cross-sectional effect is more modest (−2% to −4% for S/L, 0% for M, opposite in XL) than the primary longitudinal estimate. This suggests Kotlin’s contribution is not primarily an instantaneous within-month speedup, but rather a gradual reduction of cycle time .
4. Validity checks, limitations, and open questions
4.1 Addressing selection bias: Stepwise confounder control
At each stage of the analysis, we progressively eliminated confounders (factors that could distort the comparison − for example, if Kotlin developers are inherently more experienced or work on simpler projects):
Design
Kotlin vs. Java difference
All users (naïve comparison)
−6%
Within-user (same individuals)
−3.5%
Within-user + within-project + within-month
+12% (!)
…+ task-size control
−2% to −4% (for S/M/L)
Longitudinal log-DiD + task-size control
≈ −15% to −20% (S/M/L point estimates); XL directional only
Each step of confounder control changes the picture. The naïve comparison overstates the effect (selection bias). Within-month, without task-size control yields the opposite result (+12% − Kotlin appears slower) because Kotlin cycles in mixed-language projects contain ~15% more edit events. Our hypothesis: In such projects, new functionality tends to be written in Kotlin (larger cycles), while legacy maintenance is done in Java (smaller cycles), and without normalization, this creates an artifact. Only after controlling for task size and moving to a longitudinal design does a stable negative gap emerge. In the stricter estimator, S, M, and L all remain negative, with the strongest precision in S and M, while XL is too imprecise for a firm claim.
4.2 Additional robustness checks
4.2.1 Stability across months
Cross-sectional comparison of Java vs. Kotlin in mixed-language projects (same user, same project) over six months:
Month
Java median
Kotlin median
Δ
Kotlin faster?
2025-01
31.8 min
29.6 min
−6.9%
✅
2025-02
35.1 min
32.5 min
−7.5%
✅
2025-03
27.3 min
28.3 min
+3.7%
❌
2025-04
27.0 min
29.0 min
+7.4%
❌
2025-05
30.0 min
28.5 min
−5.2%
✅
2025-06
31.7 min
31.1 min
−2.1%
✅
The direction is inconsistent (4 out of 6 months favor Kotlin). The instantaneous effect is small and noisy − a robust effect is only visible in the longitudinal design.
4.2.2 Breakdown by project size
A separate descriptive split by total project size shows a similar pattern. Because this check is based on aggregate p90/avg trends rather than the primary log-DiD estimator, it should be read as exploratory. The pattern is most pronounced in L-projects (500–2,000 edits over the entire period):
Project size
Descriptive gap on p90
Descriptive gap on avg
XL (2,000+ edits)
−13.9%
−11.7%
L (500–2,000 edits)
−39.7%
−23.9%
4.2.3 Java version as a proxy for engineering culture
The “active team effect” hypothesis posits that the slower degradation of Kotlin projects is explained not by the language itself but by the characteristics of the team. If this were the case, then teams with a stronger engineering culture within the unmigrated Java group should degrade more slowly, too.
To test this, we used project JDK version as a proxy for engineering culture. The MODULE_JDK_VERSION event from IDE telemetry contains the major Java version. Unmigrated Java user-projects were segmented into:
old_java: maximum JDK version ≤ 11 (~308K user-projects).
modern_java: maximum JDK version ≥ 17 (~348K user-projects).
DAT/edit degradation (median minutes per edit, early → late) by bucket:
Bucket
old_java Δ
modern_java Δ
All unmigrated Java Δ
Java→Kotlin migrants Δ
S: 1–5 edits
+0.1%
+4.0%
+4.7%
−7.5%
M: 6–15 edits
+9.1%
+10.5%
+10.3%
−5.8%
L: 16–40 edits
+17.2%
+16.6%
+17.7%
−6.3%
XL: 41+ edits
+28.9%
+25.1%
+26.3%
+6.7%
The relationship between Java version and degradation rate is mixed: for large tasks (XL), modern_java degrades 3.8 pp more slowly than old_java, but for small tasks (S) it degrades 3.9 pp faster. For buckets M and L, the difference between segments is minimal (≤1.4 pp). There is no systematic advantage for modern_java.
Descriptive DAT/edit contrast recalculated with modern_java as the control group:
Bucket
Migrants Δ
Control: all unmigrated Java
Descriptive contrast (original)
Control: modern_java
Descriptive contrast (adjusted)
S
−7.5%
+4.7%
−12.2%
+4.0%
−11.5%
M
−5.8%
+10.3%
−16.1%
+10.5%
−16.3%
L
−6.3%
+17.7%
−24.0%
+16.6%
−22.9%
XL
+6.7%
+26.3%
−19.6%
+25.1%
−18.4%
When using modern_java as the control group, the descriptive contrast changes little (deviation ≤1.2 pp across buckets). This check was performed on the simpler DAT/edit view, not on the primary log-DiD estimator, so it should be read as auxiliary evidence only.
Interpretation: within this descriptive check, Java version as a proxy for engineering culture is weakly associated with DAT/edit degradation rate, and substituting the control group with modern_java has almost no effect on the descriptive contrast. This weakens the hypothesis that the difference between migrants and the control group is explained solely by team characteristics − at least to the extent that JDK version reflects those characteristics.
However, JDK version is only one possible proxy for engineering culture. Other factors (code review practices, CI/CD pipelines, refactoring habits) may differ between Kotlin migrants and the control group, even though they do not correlate with the Java version used.
Main result based on log-DAT changes at the user-project × task-size level
Project-size robustness
✅
Descriptive split by total project size shows a directionally similar pattern across the available project-size segments; this is supportive evidence, not part of the primary estimator
Task-size control
✅
Bucketing by number of edits per cycle
Secondary comparison group
✅
unmigrated Kotlin provides an additional comparison and shows a directionally similar pattern, although it is not part of the primary estimator
Sample size
✅
1,501 migrants, ~76K migrant cycles, ~28M control cycles
Temporal stability
⚠️
Cross-sectional month-by-month comparison is unstable; effect is visible in the longitudinal design
Weighting sensitivity
⚠️
Magnitudes vary across context-weighted and cycle-weighted aggregations
Large-task precision
⚠️
XL interval includes zero; L is weaker in user-level robustness checks
Branch information
⚠️
Cannot distinguish a push to a feature branch from a push to main
Cycle definition
⚠️
A single push may encompass multiple tasks
Causality
⚠️
Observational study, not an experiment
4.4 Threats to validity
What could weaken the result?
Unobserved team characteristics: Segmentation of unmigrated Java by JDK version showed that even this rough proxy for engineering culture only slightly narrows the descriptive contrast for individual buckets. Other unobserved factors that systematically differ between migrants and the control group may exist and could further reduce the gap.
Unobserved confounders: Factors we cannot measure remain: concurrent refactoring, process changes, and dependency upgrades.
Weighting sensitivity: Equal-weighting user-project contexts yields stronger magnitudes than cycle-weighted variants. The sign remains negative, but the exact effect size depends on weighting, especially for large tasks.
Large-task precision: The XL bucket is directionally negative, but its 95% CI includes zero. The L bucket is negative in the primary model but weaker under user-level robustness checks.
Push ≠ PR: A push is a proxy for delivery. A PR may be created later or through a web interface.
Calendar time: DAT includes nights, weekends, and lunch breaks. This adds noise, but it affects both groups equally.
Cycle definition: A cycle = the interval between pushes; a single push may encompass multiple logical tasks.
What could strengthen the result?
Bucketing may work in Java’s favor. If Kotlin code is more concise, then the same logical task in Kotlin may require fewer edits than in Java. In that case, within each bucket, Kotlin tasks would be objectively larger. This is a hypothesis we cannot verify directly from the available data (we do not know which “logical task” underlies each cycle), but if it holds − the real effect is stronger than measured.
4.5 Open questions
Pre-trends / event-study: Do migrant and control trends look parallel before the transition to Kotlin?
Alternative controls in the primary estimator: Does the log-DiD result hold when using only modern_java or matched controls?
Robustness check on thresholds: Does the effect hold under alternative migrant definitions (5/20% instead of 10%, 40/60% instead of 50%)?
DAT of reverse migrants with task-size control: Do cycle durations worsen when moving away from Kotlin?
Long-term dynamics: Does the effect continue to grow after 12+ months on Kotlin, or does it plateau?
Other productivity metrics: Which parts of the development process — such as compilation errors, build times, and rebuild frequency — would best clarify the data we collected?
Android Studio: Will the difference be the same for the segment of Android developers?
Propensity score matching: Could matching each migrant with a “twin” from the control group with similar baseline characteristics (project size, initial speed, activity) yield a more precise DiD estimate?
On the nature of the edit event: The edit event is reported with a 1-minute cooldown − after being sent, the system does not record new edits for one minute, even if the developer continues typing. Between edit events, a developer also reads code, navigates the project, runs tests, and discusses issues with colleagues − all of which are part of the work cycle included in DAT but do not generate edit events. Therefore, the number of edits is a proxy for task size, not a measure of time spent. DAT measures the full wall-clock time of the cycle.
5.2 Filtering
DAT > 36 sec and < 14 days
Only product_code = ‘IU’ (IntelliJ IDEA)
Only recorder_code = ‘FUS’
Non-empty machine_id and project_id
5.3 Defining migration groups
For each (machine_id, project_id) per month, kotlin_share = kotlin_edits / (java_edits + kotlin_edits) is calculated. A minimum of ≥10 Java/Kotlin edit events per month and ≥4 active months is required.
Group
Definition
A: Java→Kotlin migrants
First month kotlin_share < 10%, last month > 50%
B: Unmigrated Java
First and last month kotlin_share < 10%
C: Unmigrated Kotlin
First and last month kotlin_share > 50%
Migrant phases are determined monthly: Java phase (<10%), Transition (10–50%), and Kotlin phase (>50%).
unmigrated group phases: History is divided into three equal time-based thirds (early / middle / late) − analogous to migrant phases.
5.4 Difference-in-differences (DiD)
The primary estimator is a longitudinal log-DiD on user-project × task-size-bucket contexts:
A context is defined as (machine_id, project_id, size_bucket).
Only contexts with ≥3 cycles in both pre and post periods are kept.
For each context, we compute ΔlogDAT = mean(log(DAT))_post − mean(log(DAT))_pre.
We then estimate the treated-control gap: Primary log-DiD effect = exp(mean(ΔlogDAT)_migrants − mean(ΔlogDAT)_control) − 1.
Standard errors are clustered by machine_id, since one user may contribute multiple projects or buckets.
For interpretability, we also show bucket-level median DAT tables and simple percentage changes. These descriptive summaries are not the primary estimator.
5.5 Task-size control
Raw DAT is not appropriate for comparison: Kotlin cycles in mixed-language projects contain ~15% more edits (our hypothesis is that new functionality is written in Kotlin while legacy maintenance is done in Java).
The primary control method is bucketing: We compare only cycles of the same size. We also use DAT/edits as an auxiliary descriptive normalization in selected robustness checks.
Two control methods are used:
DAT/edits: Cycle duration divided by the number of edits.
Bucketing: Comparing cycles of the same size: S (1–5), M (6–15), L (16–40), XL (41+ edits).
Primary log-DiD panel: 978 migrant contexts and 400,425 control contexts with ≥3 cycles in both pre and post periods.
Conclusion
This study presents large-scale observational evidence that development cycles in Kotlin-oriented projects are shorter than comparable cycles in Java-oriented projects. The primary longitudinal log-DiD estimate, controlling for user, project, time trend, and task size, places the effect at roughly 15–20% for everyday tasks (S, M, and L buckets). For XL tasks, the point estimate is also negative but statistically imprecise.
The dominant pattern is not a sudden acceleration upon switching to Kotlin, but rather a difference in trajectory: Unmigrated Java projects tend to experience substantial cycle-time growth over the observation period (+9% to +17% in the primary model), while migrant projects show modest improvement or remain flat. The result is independently echoed by the unmigrated Kotlin vs. unmigrated Java comparison, where Kotlin projects degrade at roughly half the rate.
We want to be explicit about what this study does not establish. This is an observational study, not a randomized experiment, and we cannot make definitive causal claims. Teams that choose to migrate to Kotlin may differ from those that stay on Java in ways we cannot fully observe − though our validity checks (JDK-version segmentation, multiple control groups, stepwise confounder elimination) suggest these differences alone do not explain the gap. We encourage readers to examine the limitations in Section 4.4 and the open questions in Section 4.5 when forming their own assessment of the evidence.
Several directions for future work could strengthen or refine these findings: event-study analysis of pre-trends, propensity score matching for more precise control-group construction, and extension to Android Studio where Kotlin is the default language. We plan to pursue these in subsequent analyses.
There’s a hypothesis that most people building AI agents have encountered but few have measured: the more tools you give an LLM, the worse it gets at picking the right one.
It’s intuitive. Connect a few MCP servers to your agent, and suddenly it’s choosing from 60, 80, 100+ tools. GitHub tools, GitLab tools, Kubernetes, Slack, Jira, PagerDuty, Terraform, Grafana, all loaded into the context window, all the time. The model has to read every tool definition, understand the distinctions between them, and pick the right one. That’s a lot of signal to sift through.
But intuition isn’t data. So we built Boundary, an open-source framework for finding where LLM context breaks, and ran the numbers.
The setup
We assembled 150 tool definitions based on real schemas from production agent systems across 16 services: GitHub, GitLab, Jira, Confluence, Kubernetes, AWS, Datadog, Slack, PagerDuty, Okta, Snyk, Grafana, Terraform Cloud, Docker, Linear, and Notion. The tools are synthetic (no-op for benchmarking) but the schemas, parameter structures, and descriptions mirror what you’d find in a production MCP environment.
We tested six models across three providers:
Claude Sonnet 4.6 and Claude Haiku 4.5 (Anthropic)
GPT-4o and GPT-5.4 Mini (OpenAI)
Grok 4 and Grok 4.1 Fast Reasoning (xAI)
Each model received 60 prompts (both direct requests and ambiguous ones) at five toolset sizes: 25, 50, 75, 100, and 150 tools. At each size, the available tools were randomly selected but always included the correct one. The question: does the model pick the right tool?
The results
Every model that completed the test degraded. Two didn’t finish at all.
Model
25 tools
50 tools
75 tools
100 tools
150 tools
Grok 4.1 Fast
86.7%
83.3%
80.0%
83.3%
76.7%
GPT-5.4 Mini
85.0%
85.0%
80.0%
83.3%
failed
GPT-4o
81.7%
78.3%
73.3%
76.7%
failed
Claude Haiku 4.5
81.7%
80.0%
78.3%
80.0%
76.7%
Grok 4
80.0%
78.3%
80.0%
71.7%
80.0%
Claude Sonnet 4.6
78.3%
73.3%
73.3%
76.7%
75.0%
GPT-5.4 Mini was the most surprising result. At 85% accuracy through 50 tools, 92% on ambiguous prompts, sub-1-second latency, and $0.002 per call, it was arguably the best overall performer for small-to-medium toolsets. Then it hit the same 128-tool wall as GPT-4o and failed completely at 150.
Grok 4.1 Fast Reasoning was the only model that combined top-tier accuracy with the ability to handle 150 tools. It degraded steadily from 86.7% to 76.7%, but it never broke.
Both OpenAI models failed at 150 tools. OpenAI’s API has a hard limit of 128 tools per request. This isn’t a degradation curve. It’s a wall. If your agent connects enough MCP servers to exceed 128 tools, no OpenAI model works.
Claude Sonnet 4.6, the most expensive model in the test ($0.028/call), was the least accurate at 25 tools and never recovered. Claude Haiku outperformed it at every size while costing 3x less.
Cross-service confusion scales with tools
Cross-service confusion, where a model picks a tool from the wrong service entirely, was the most dangerous failure mode.
Model
25 tools
50 tools
75 tools
100 tools
150 tools
Claude Haiku 4.5
0
0
1
2
4
Grok 4.1 Fast
0
0
0
2
3
Claude Sonnet 4.6
0
1
2
3
2
Grok 4
2
0
2
4
1
GPT-4o
0
0
1
2
n/a
GPT-5.4 Mini
0
0
2
1
n/a
Grok 4 had cross-service errors even at 25 tools. Claude Haiku was clean until 75 tools but escalated to 4 errors at 150, the worst of any model at that size.
The most common cross-service confusions across all models:
Datadog vs Grafana: “Check the monitoring alerts” consistently routed to the wrong observability platform
Notion vs Confluence: “Search for documentation” split between the two
Linear vs Jira: “Add a comment to the tracking issue” picked the wrong project tracker
GitHub vs GitLab: “Show me the open issues” confused the two at higher tool counts
Direct vs. ambiguous prompts
A “direct” prompt names the service: “List all Terraform Cloud workspaces.” An “ambiguous” prompt doesn’t: “Add a comment saying ‘Resolved’ to the tracking issue.”
Model
25t (ambig)
50t (ambig)
75t (ambig)
100t (ambig)
150t (ambig)
GPT-5.4 Mini
92%
92%
67%
92%
n/a
Grok 4.1 Fast
83%
83%
83%
75%
67%
Claude Sonnet 4.6
83%
75%
75%
83%
75%
GPT-4o
83%
83%
67%
58%
n/a
Claude Haiku 4.5
75%
75%
83%
67%
67%
Grok 4
67%
75%
67%
50%
67%
GPT-5.4 Mini dominated ambiguous prompts at 92% through 100 tools. It handled disambiguation better than any other model by a wide margin. GPT-4o collapsed to 58% at the same size. Grok 4 hit 50%, a coin flip.
Claude Sonnet was the most stable, staying between 75% and 83% regardless of toolset size. Consistent, but never great.
Where models get confused
The errors tell a story. Some patterns appeared across all six models:
Terraform is hard. All models consistently confused terraform_create_run with terraform_list_workspaces, and terraform_lock_workspace with terraform_get_workspace. The tool names are semantically close, and the models default to “list” or “get” operations when the toolset is crowded.
Snyk is a trap.snyk_get_remediation, snyk_list_container_projects, and snyk_list_projects all got misrouted to snyk_list_organizations. When Snyk tools are buried among 100+ others, the models default to the most generic-sounding option.
Confluence updates fail. All models picked confluence_search when asked to update a page. The prompt said “Update the runbook page”, but with 75+ tools in context, the model reached for search instead of the update operation.
Monitoring platform confusion. Datadog and Grafana both have alerting, dashboards, and metrics tools. The prompt “Check the monitoring alerts for the API server” got routed to Grafana instead of Datadog by every model at some toolset size. Adding two similar services to the toolset creates permanent ambiguity.
The latency story
Accuracy isn’t the only cost.
Model
25 tools
50 tools
75 tools
100 tools
150 tools
GPT-5.4 Mini
739ms
754ms
849ms
976ms
n/a
GPT-4o
1,170ms
4,035ms
6,213ms
7,657ms
n/a
Claude Haiku 4.5
2,463ms
6,157ms
8,765ms
11,473ms
16,749ms
Claude Sonnet 4.6
4,728ms
10,308ms
14,579ms
19,120ms
27,935ms
Grok 4.1 Fast
6,448ms
7,042ms
6,930ms
7,349ms
7,533ms
Grok 4
7,706ms
7,945ms
8,133ms
8,418ms
9,552ms
GPT-5.4 Mini was the latency champion: sub-1-second at every toolset size it completed. The Anthropic models scaled linearly, with Sonnet reaching 28 seconds at 150 tools. The xAI models barely changed, staying in the 6-10 second range regardless of tool count.
What this means
The pattern is consistent across six models from three providers: more tools means worse accuracy, and the degradation starts between 25 and 50 tools.
The implications for anyone building agents with MCP:
Don’t load everything. If your agent has access to 10+ services, that’s easily 80-150 tools. Loading them all upfront is a measurable tax on accuracy, starting at 25 tools.
OpenAI has a hard wall at 128 tools. Both GPT-4o and GPT-5.4 Mini failed at 150. This isn’t a model quality issue. It’s a platform constraint. If your agent might exceed 128 tools, OpenAI models are not an option.
Ambiguous prompts are the danger zone. Grok 4 hit 50% accuracy on ambiguous prompts at 100 tools. GPT-4o dropped to 58%. When users don’t name the service explicitly, the model has to disambiguate, and more tools makes that exponentially harder.
Similar services compound the problem. Datadog and Grafana. Notion and Confluence. Linear and Jira. GitHub and GitLab. Every pair of similar services in the toolset creates a permanent source of confusion that scales with tool count.
Latency compounds. Even if accuracy were flat, the latency cost matters. Claude Sonnet at 28 seconds per call is unusable for interactive workloads. GPT-5.4 Mini at sub-1-second is a different product entirely.
Price does not predict performance. Claude Sonnet 4.6 costs 28x more per call than Grok 4.1 Fast and is less accurate. Claude Haiku outperforms Claude Sonnet at 3x lower cost. The most expensive model lost.
The cost equation
What you pay per call versus what you get in accuracy.
Model
Total cost
Calls
Cost/call
Best accuracy
Worst accuracy
Grok 4.1 Fast
$0.31
300
$0.0010
86.7% (25t)
76.7% (150t)
GPT-5.4 Mini
$0.50
240*
$0.0021
85.0% (25t)
failed (150t)
GPT-4o
$1.57
240*
$0.0065
81.7% (25t)
failed (150t)
Claude Haiku 4.5
$2.83
300
$0.0094
81.7% (25t)
76.7% (150t)
Grok 4
$3.85
300
$0.013
80.0% (25t)
71.7% (100t)
Claude Sonnet 4.6
$8.51
300
$0.028
78.3% (25t)
73.3% (50t)
*OpenAI models completed 240 of 300 calls. All calls at 150 tools failed due to the 128-tool API limit.
The two cheapest models (Grok 4.1 Fast at $0.001/call and GPT-5.4 Mini at $0.002/call) were also the two most accurate. The most expensive model (Claude Sonnet at $0.028/call) was the least accurate. The correlation between price and tool-calling performance is not just weak. It’s inverted.
This is exactly the kind of tradeoff Boundary is designed to surface. Without benchmark data, you’d likely pick Claude Sonnet or GPT-4o. The data says they’re among the worst choices for tool-calling workloads. A team running fewer than 128 tools should seriously consider GPT-5.4 Mini for its combination of accuracy, speed, and cost. A team that might exceed 128 needs Grok 4.1 Fast or an Anthropic model.
Running these benchmarks costs almost nothing. This entire run across six models cost $17. That’s less than a single hour of engineer time debugging a misrouted tool call in production.
How this shaped our architecture
This data isn’t theoretical for us. It directly informed how we built progressive disclosure in SixDegree.
The core insight: if accuracy degrades between 25 and 50 tools, then the goal isn’t to find a smarter model. It’s to never present more than 25 tools in the first place. Not by hardcoding a curated list, but by letting the agent’s context determine which tools are relevant at each step.
In SixDegree, when an agent queries the ontology and discovers a GitHub repository, only the GitHub tools become available. When a Kubernetes deployment surfaces through a relationship, the Kubernetes tools appear. The agent never sees all 150 tools at once because it never needs to. The toolset at any given turn is scoped to the entities the agent has actually encountered.
The Boundary data validates this approach quantitatively. At 25 tools (roughly the size of two or three services’ worth of tools), accuracy is in the mid-to-high 80s. That’s the operating range progressive disclosure keeps you in, regardless of how many total services are connected. You can have 16 integrations and 150 tools installed, and the agent still only sees the 10-20 that matter for the current conversation.
The alternative, loading everything and hoping the model figures it out, costs you 5-10 percentage points of accuracy, up to 28x the latency, and for OpenAI models, a hard failure at 128 tools. Progressive disclosure isn’t a nice-to-have. It’s a requirement for agents that work at scale.
Limitations and what we’d like to improve
This benchmark is a starting point, not a definitive answer. There are real limitations to what it measures and how:
Single-turn only. Each prompt gets one shot at picking a tool. Real agents chain tool calls, use results from previous calls to inform the next one, and recover from mistakes. A model that picks the wrong tool on the first try might self-correct on a second turn. This benchmark doesn’t capture that.
Random tool subsets. At each toolset size, the available tools are randomly selected (with the correct one always included). In production, the tools in context aren’t random. They’re usually grouped by service or use case. Random selection may overstate or understate confusion depending on which tools end up adjacent.
No parameter validation. We check whether the model picked the right tool, but not whether it filled in the parameters correctly. A model that picks github_create_issue but hallucinates the owner field is still counted as correct. Parameter accuracy is a whole separate dimension.
Prompt quality varies. Some of the ambiguous prompts have arguably debatable expected answers. “Check the monitoring alerts” could reasonably map to either Datadog or Grafana depending on the organization. We picked one, but reasonable people would disagree.
Single trial. Each prompt runs once per toolset size. With 60 prompts per size, the results are directional but individual percentage points could shift with more trials.
We’d like to add multi-turn evaluation, parameter accuracy checking, configurable prompt difficulty levels, and more models. If you have ideas for how to make this benchmark better, if you disagree with our methodology, or if you’ve run Boundary against a model we haven’t tested yet, open an issue or submit a PR. This is an open source project and we want the community to help shape it.
What’s next
The full interactive results from this run are available on our site. The framework is open source. Run it yourself and see how your preferred models handle tool overload.
Boundary is an open-source framework for finding where LLM context breaks. See how SixDegree solves tool overload.
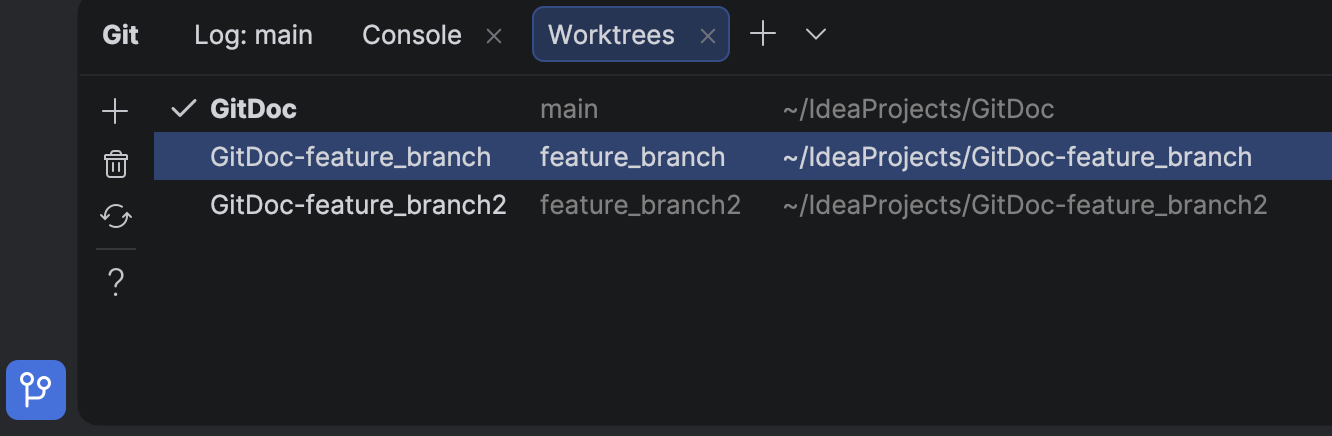
Welcome to PhpStorm 2026.1! This release brings new PhpStorm MCP tools, new third-party agents inside your IDE, support for Git worktrees, and lots of other productivity-enhancing features for PHP and Laravel developers.
Download PhpStorm 2026.1
PhpStorm MCP tools
In PhpStorm 2025.2, we added an integrated MCP server for third-party coding agents like Claude Code, Windsurf, or Codex to access and use your IDE’s tools.
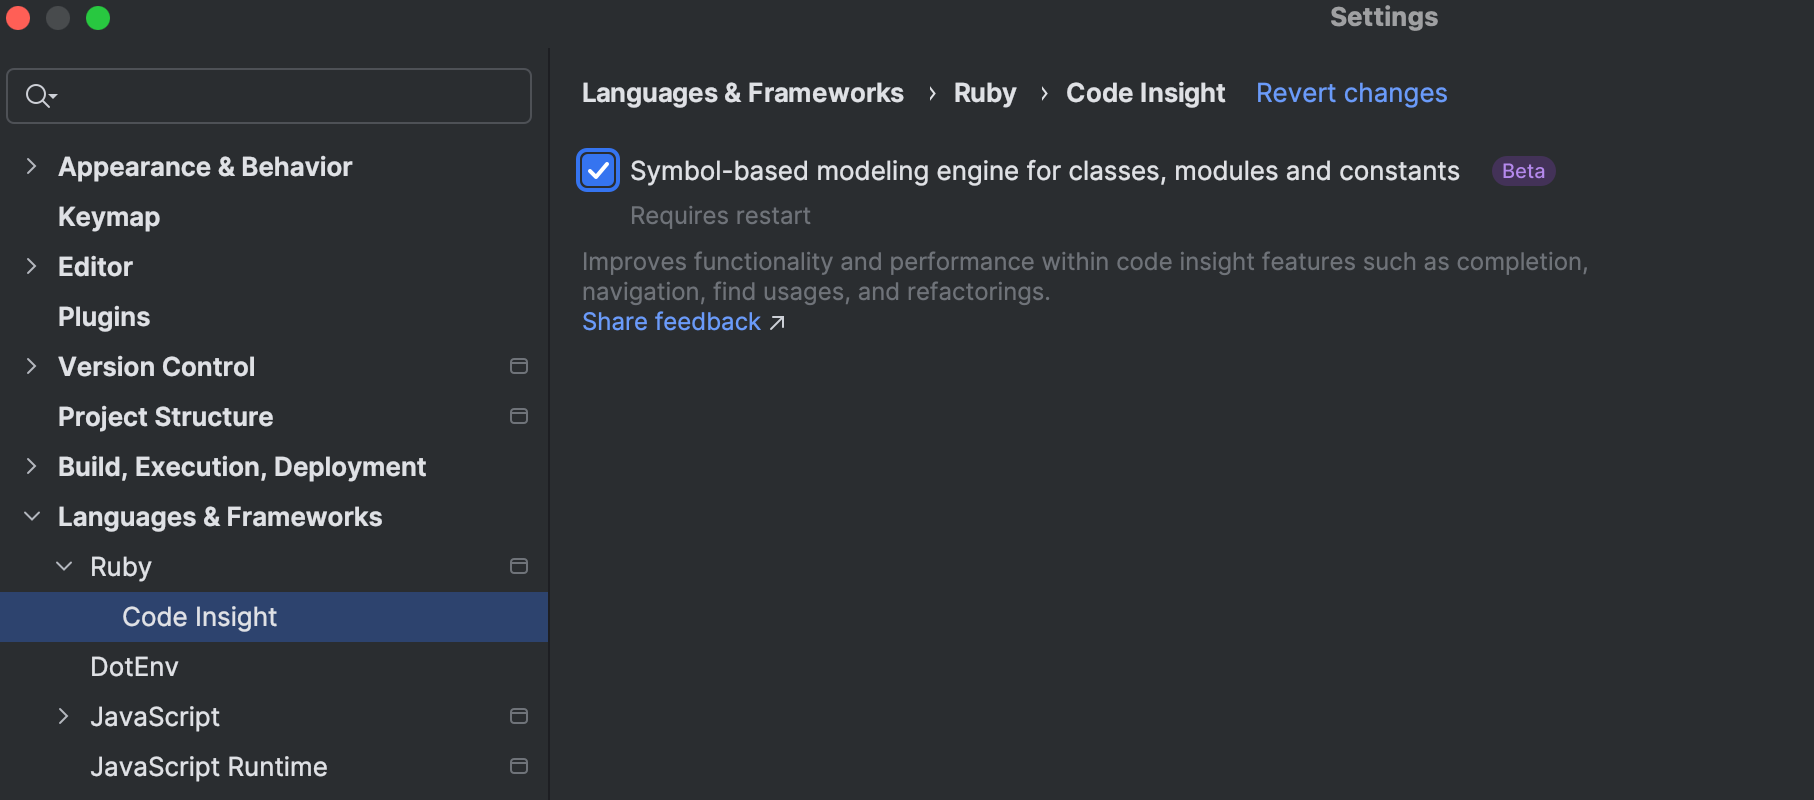
In 2026.1, we are extending the MCP server toolset with more PhpStorm features, including:
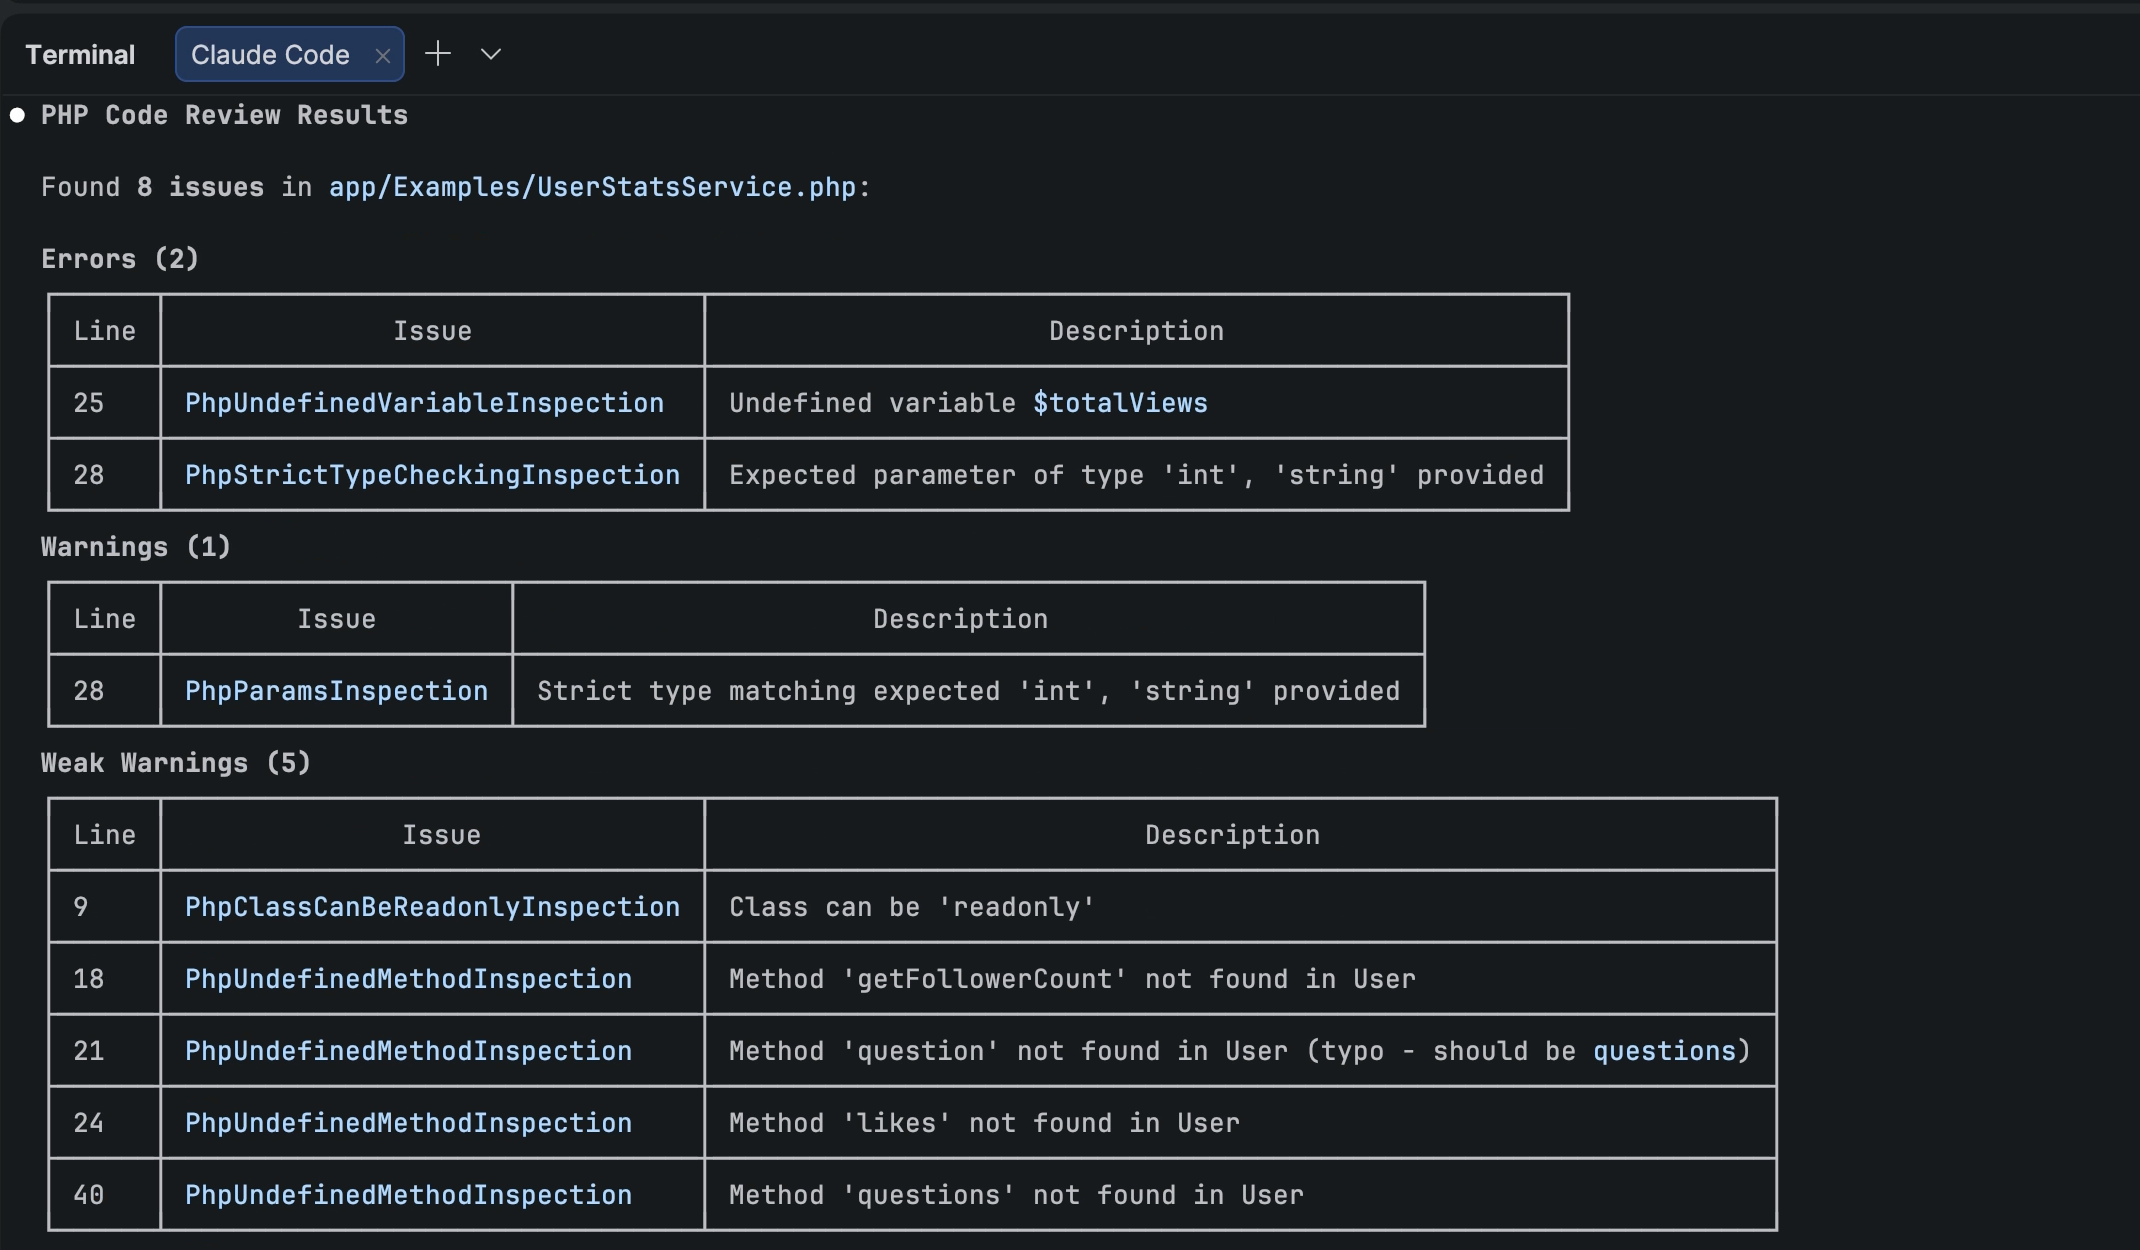
Inspections and quick-fixes that enable agents to leverage PhpStorm’s powerful static analysis engine.
IDE searchcapabilities, including PhpStorm’s structural search and semantic search for code patterns.
Access to IDE actions so that you can delegate setup and customization of your IDE to your coding agent.
Furthermore, the PhpStorm plugin for Claude Code provides Claude Code with context and instructions for using PhpStorm MCP server tools. To add the plugin’s skills and hooks to your project, go to PhpStorm’s Settings | Tools | PHP Claude Skills.
Note: PhpStorm’s MCP server is disabled by default. To enable the server and configure integration with your coding agent, go to Settings | Tools | MCP Server.
AI
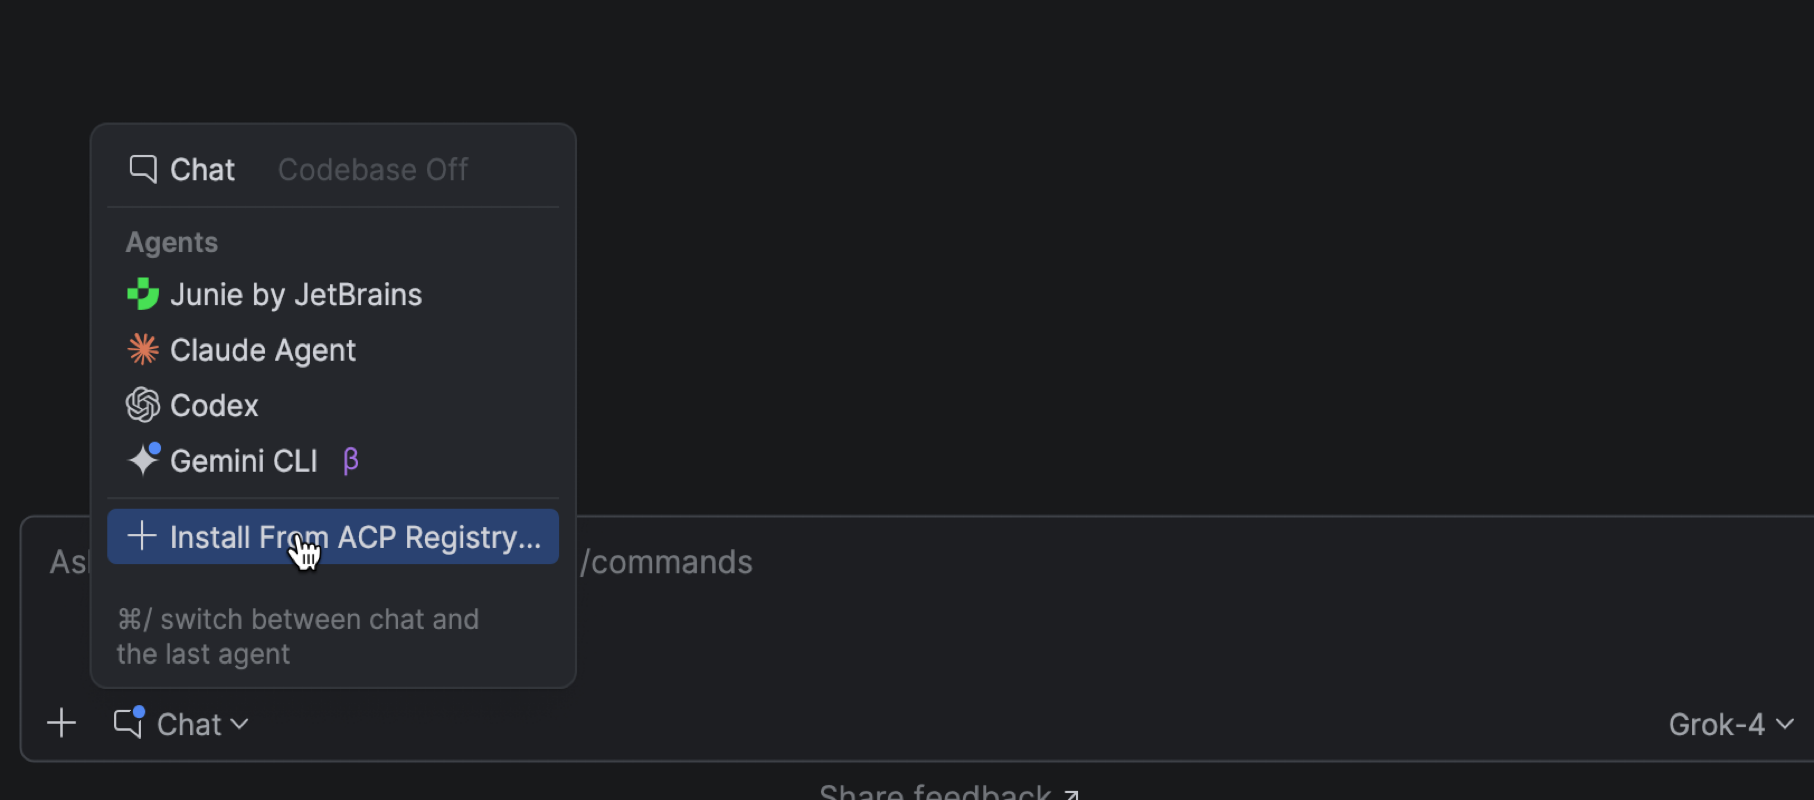
Third-party agents in PhpStorm
PhpStorm is evolving as an open platform that allows you to bring the AI tools of your choice into your professional development workflows.
In addition to Junie, Claude Agent, and most recently Codex, PhpStorm now lets you work with more AI agents directly in the AI chat. You can choose from agents such as GitHub Copilot, Cursor, and many others supported through the Agent Client Protocol.
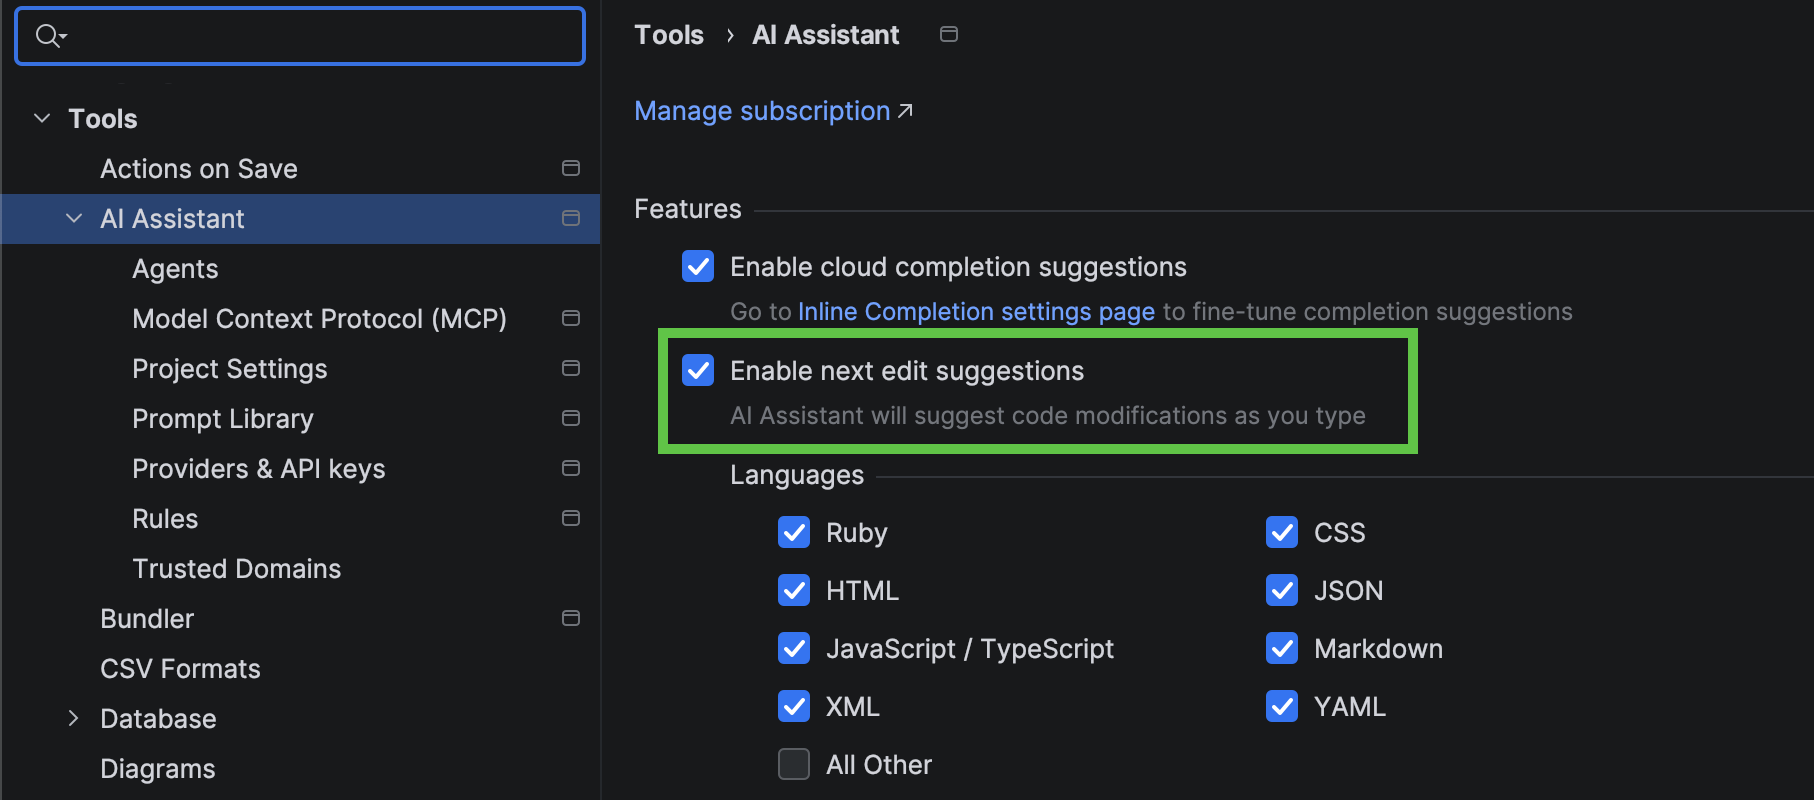
Next edit suggestions
Next edit suggestions are now available without consuming AI quota of your JetBrains AI Pro, Ultimate, and Enterprise subscriptions.These suggestions go beyond traditional code completion for PHP. Instead of updating only what’s at your cursor, they intelligently apply related changes across the entire file, helping you keep your code consistent and up to date with minimal effort.
This natural evolution of code completion delivers a seamless Tab Tab experience that keeps you in the flow.
Junie CLI is now in Beta
Junie CLI is JetBrains’ LLM-agnostic coding agent you can use directly from the terminal, inside any IDE, in CI/CD, and on GitHub or GitLab. Junie CLI comes with:
Bring Your Own Key (BYOK) pricing, allowing you to use your own keys from model providers without additional charges.
One-click migration from other agents such as Claude Code or Codex.
Flexible customization through guidelines, custom agents and agent skills, commands, MCP, and more.
Read the full announcement in our blog post.
Project indexing optimization
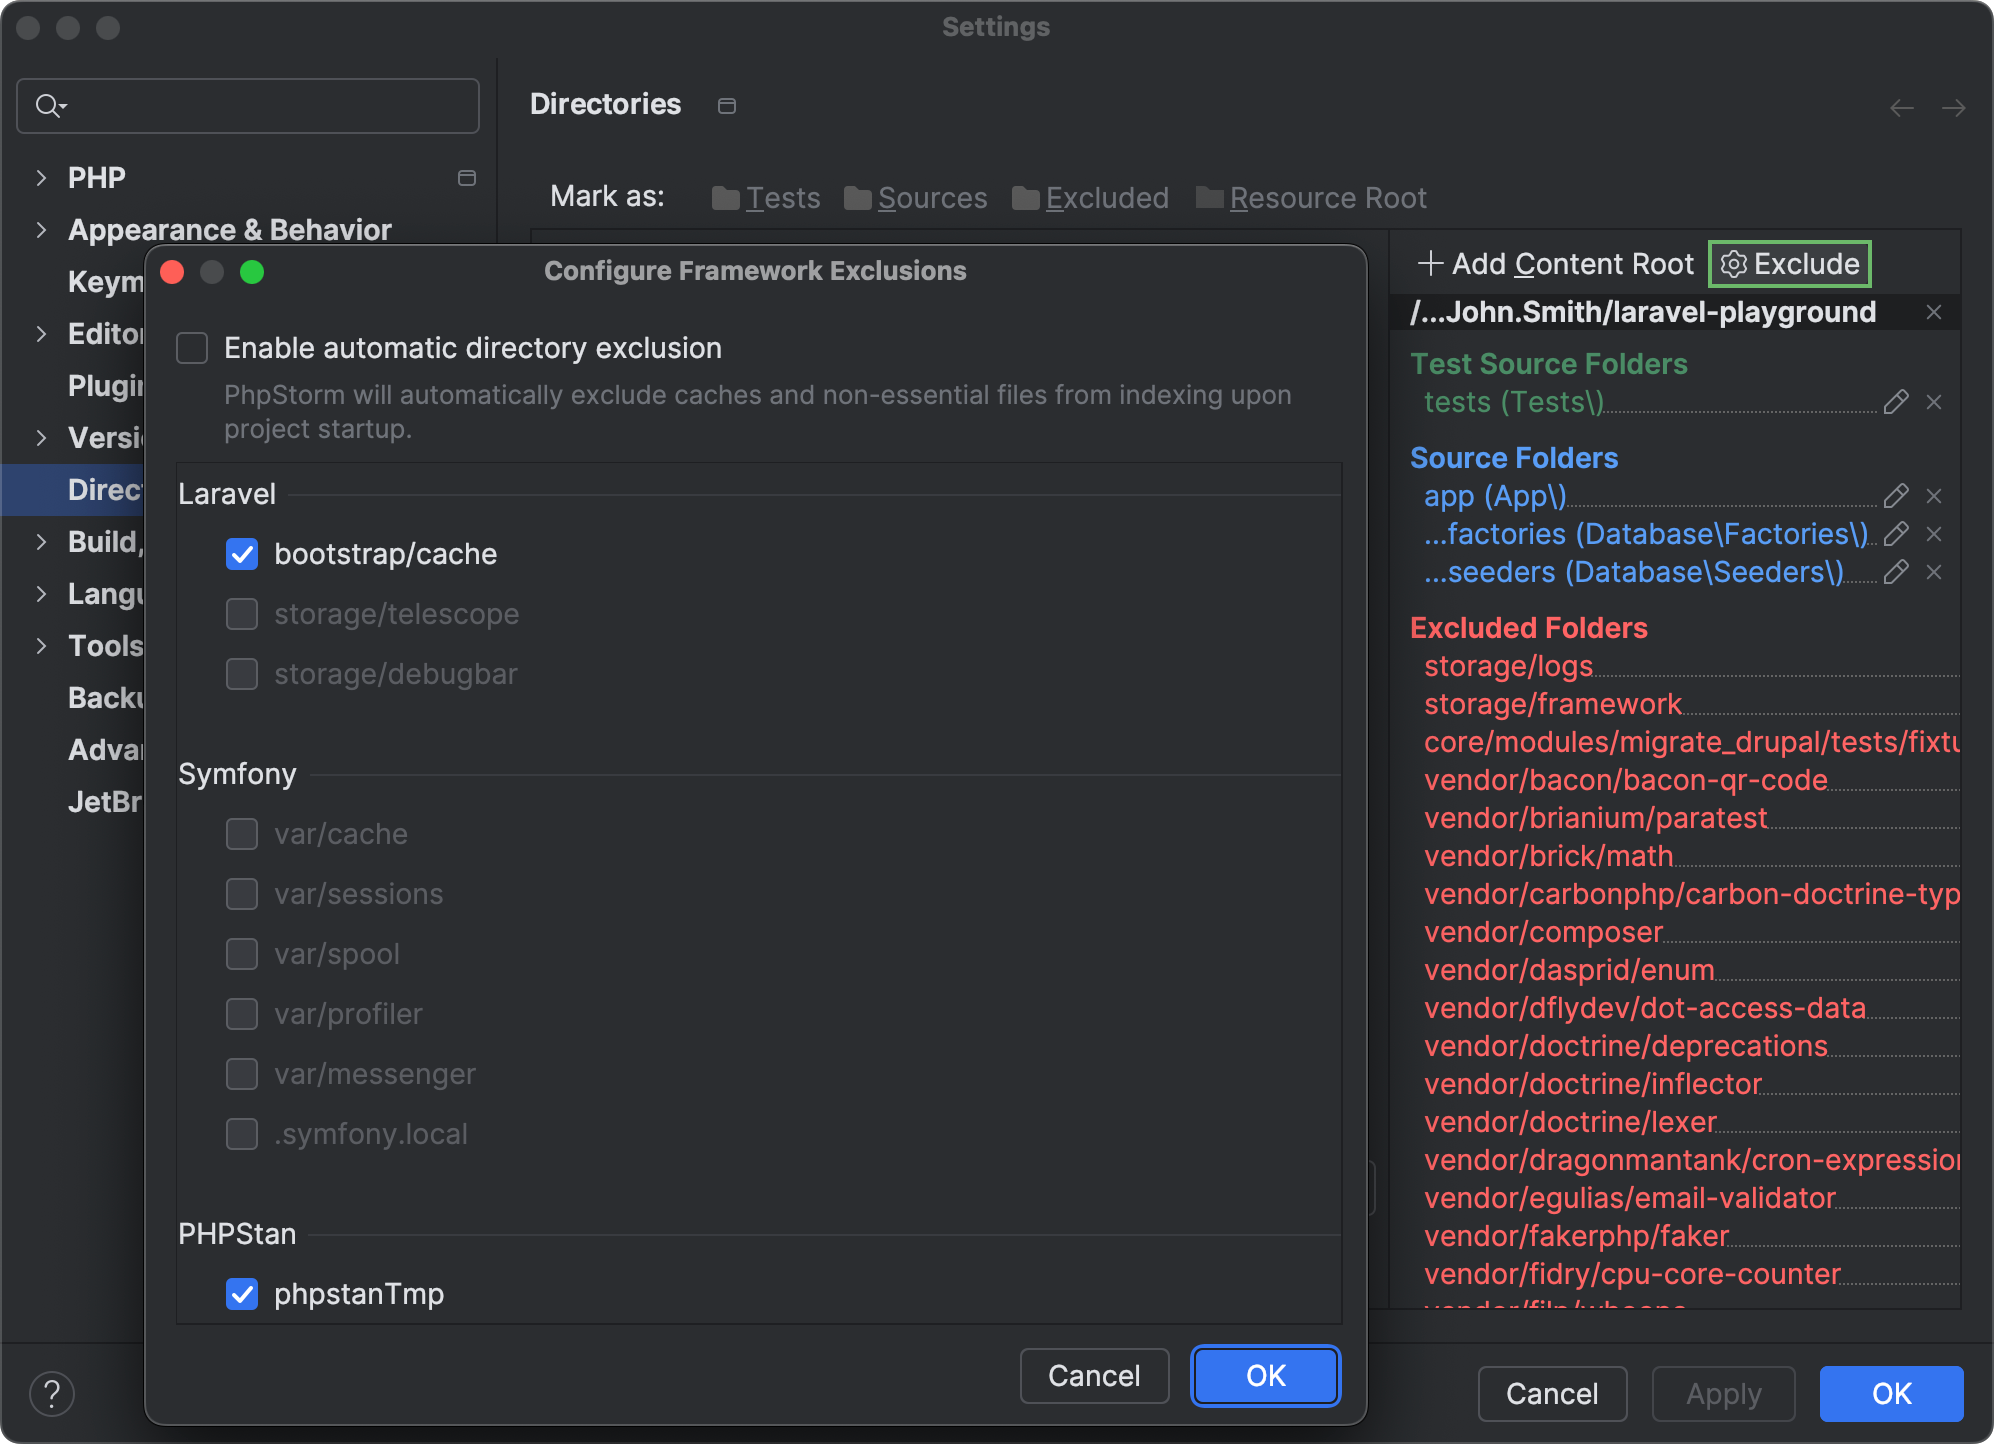
PhpStorm now automatically detects framework-specific directories that contain frequently changing generated, cached, or user-uploaded content and excludes such directories from project indexing.
The IDE skips excluded folders during search, parsing, and other operations. Reducing indexing overhead helps optimize the CPU usage and performance of your IDE.
If you want to re-enable indexing for any of the automatically excluded folders, you can do so in Settings | Directories by clicking Exclude and unselecting the checkboxes next to the directories you want to be indexed.
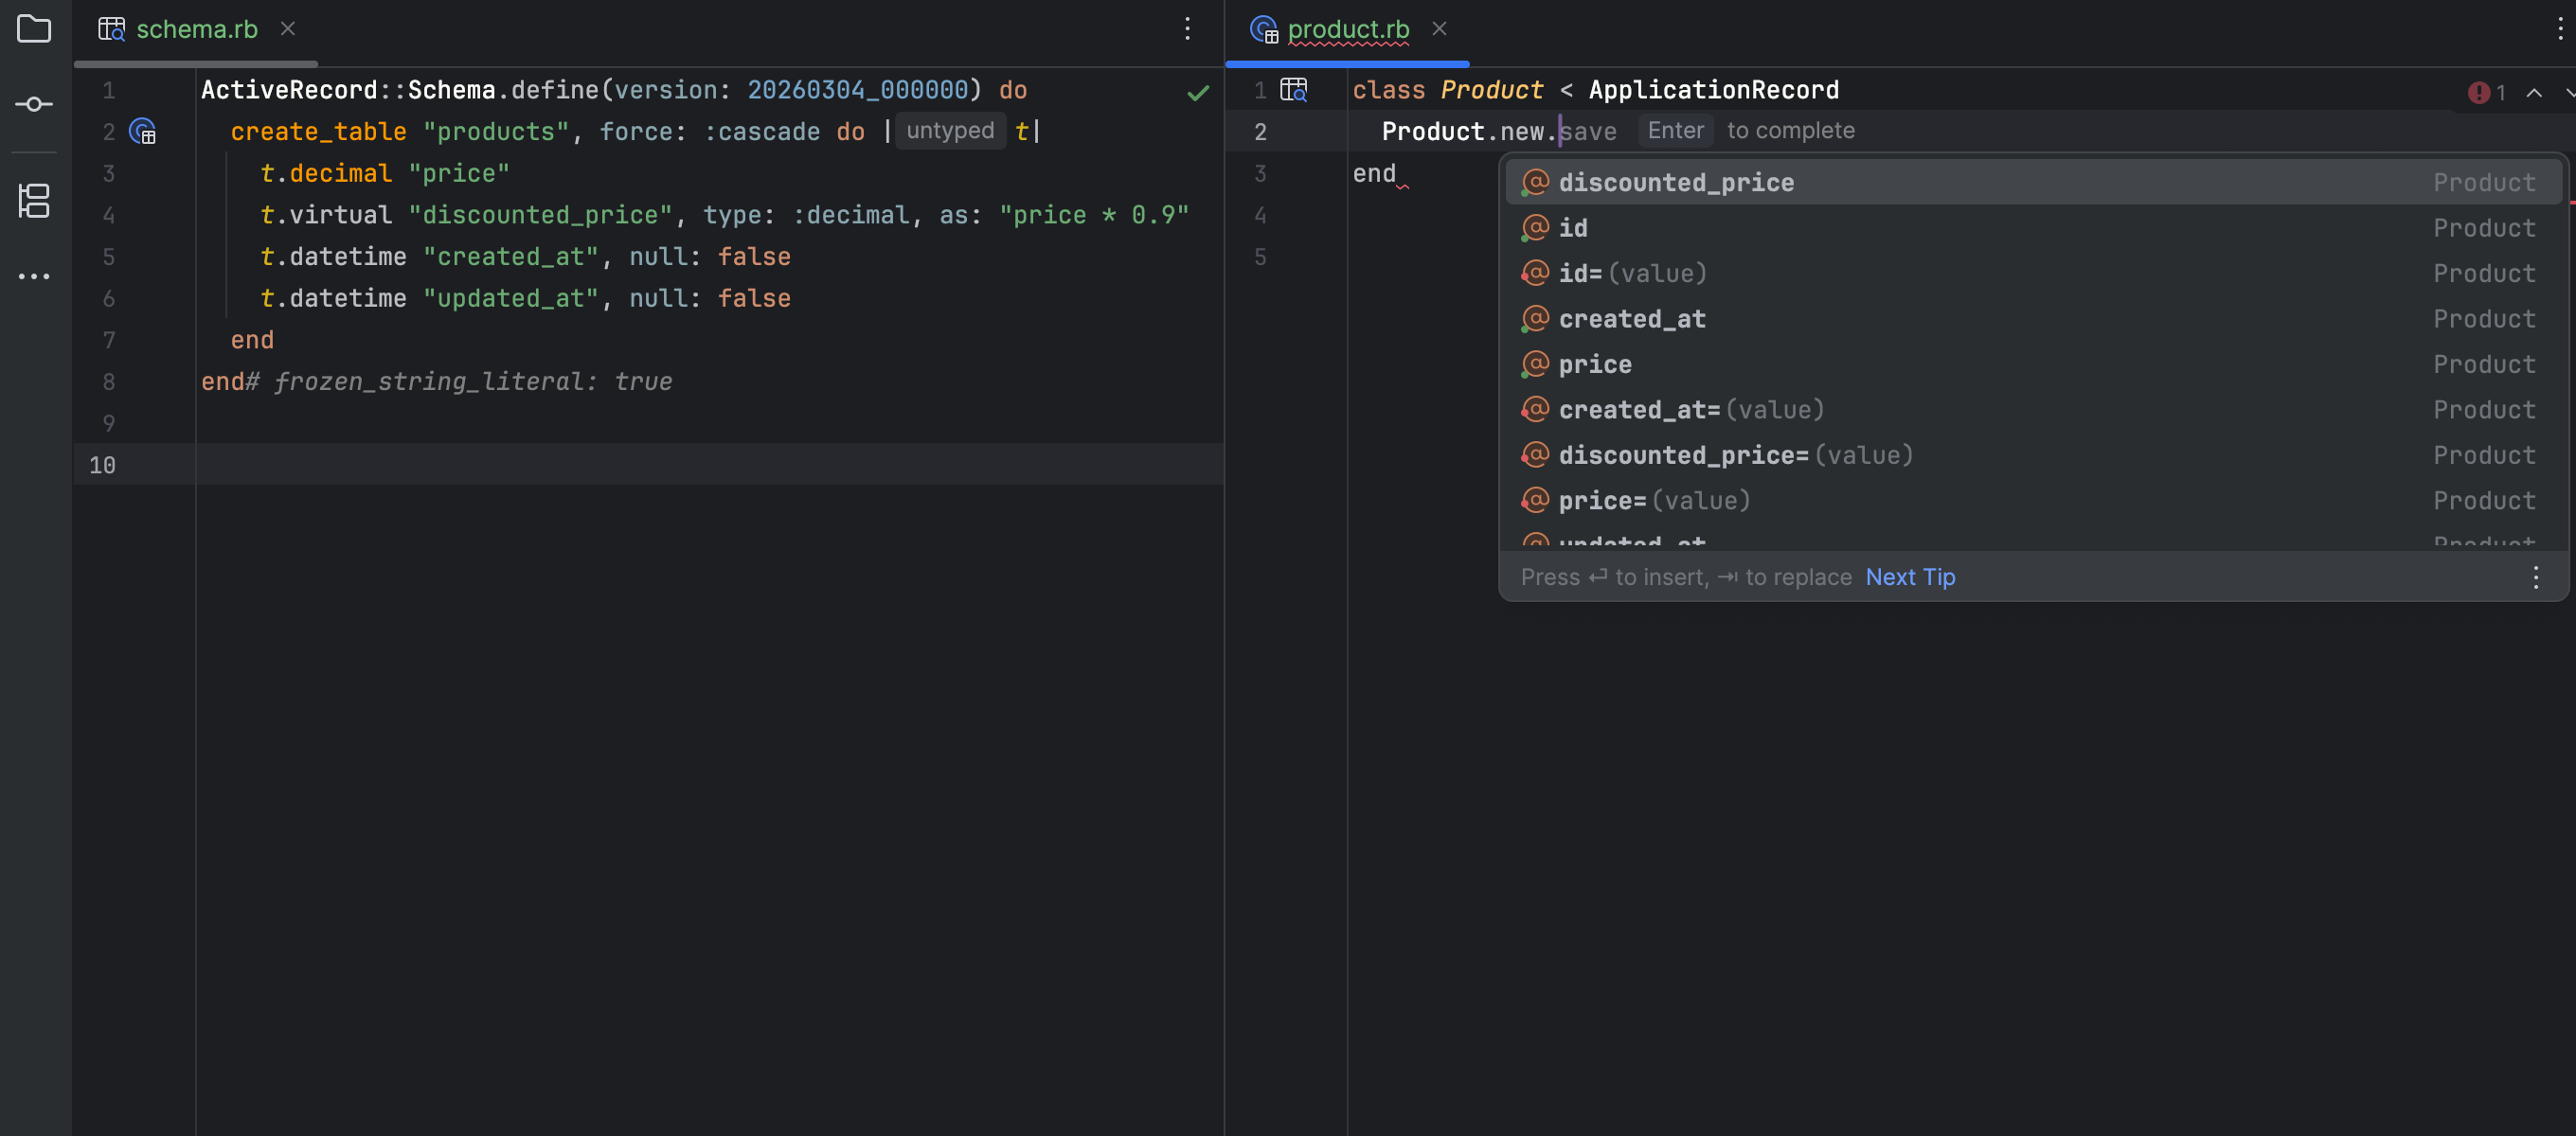
Generics support
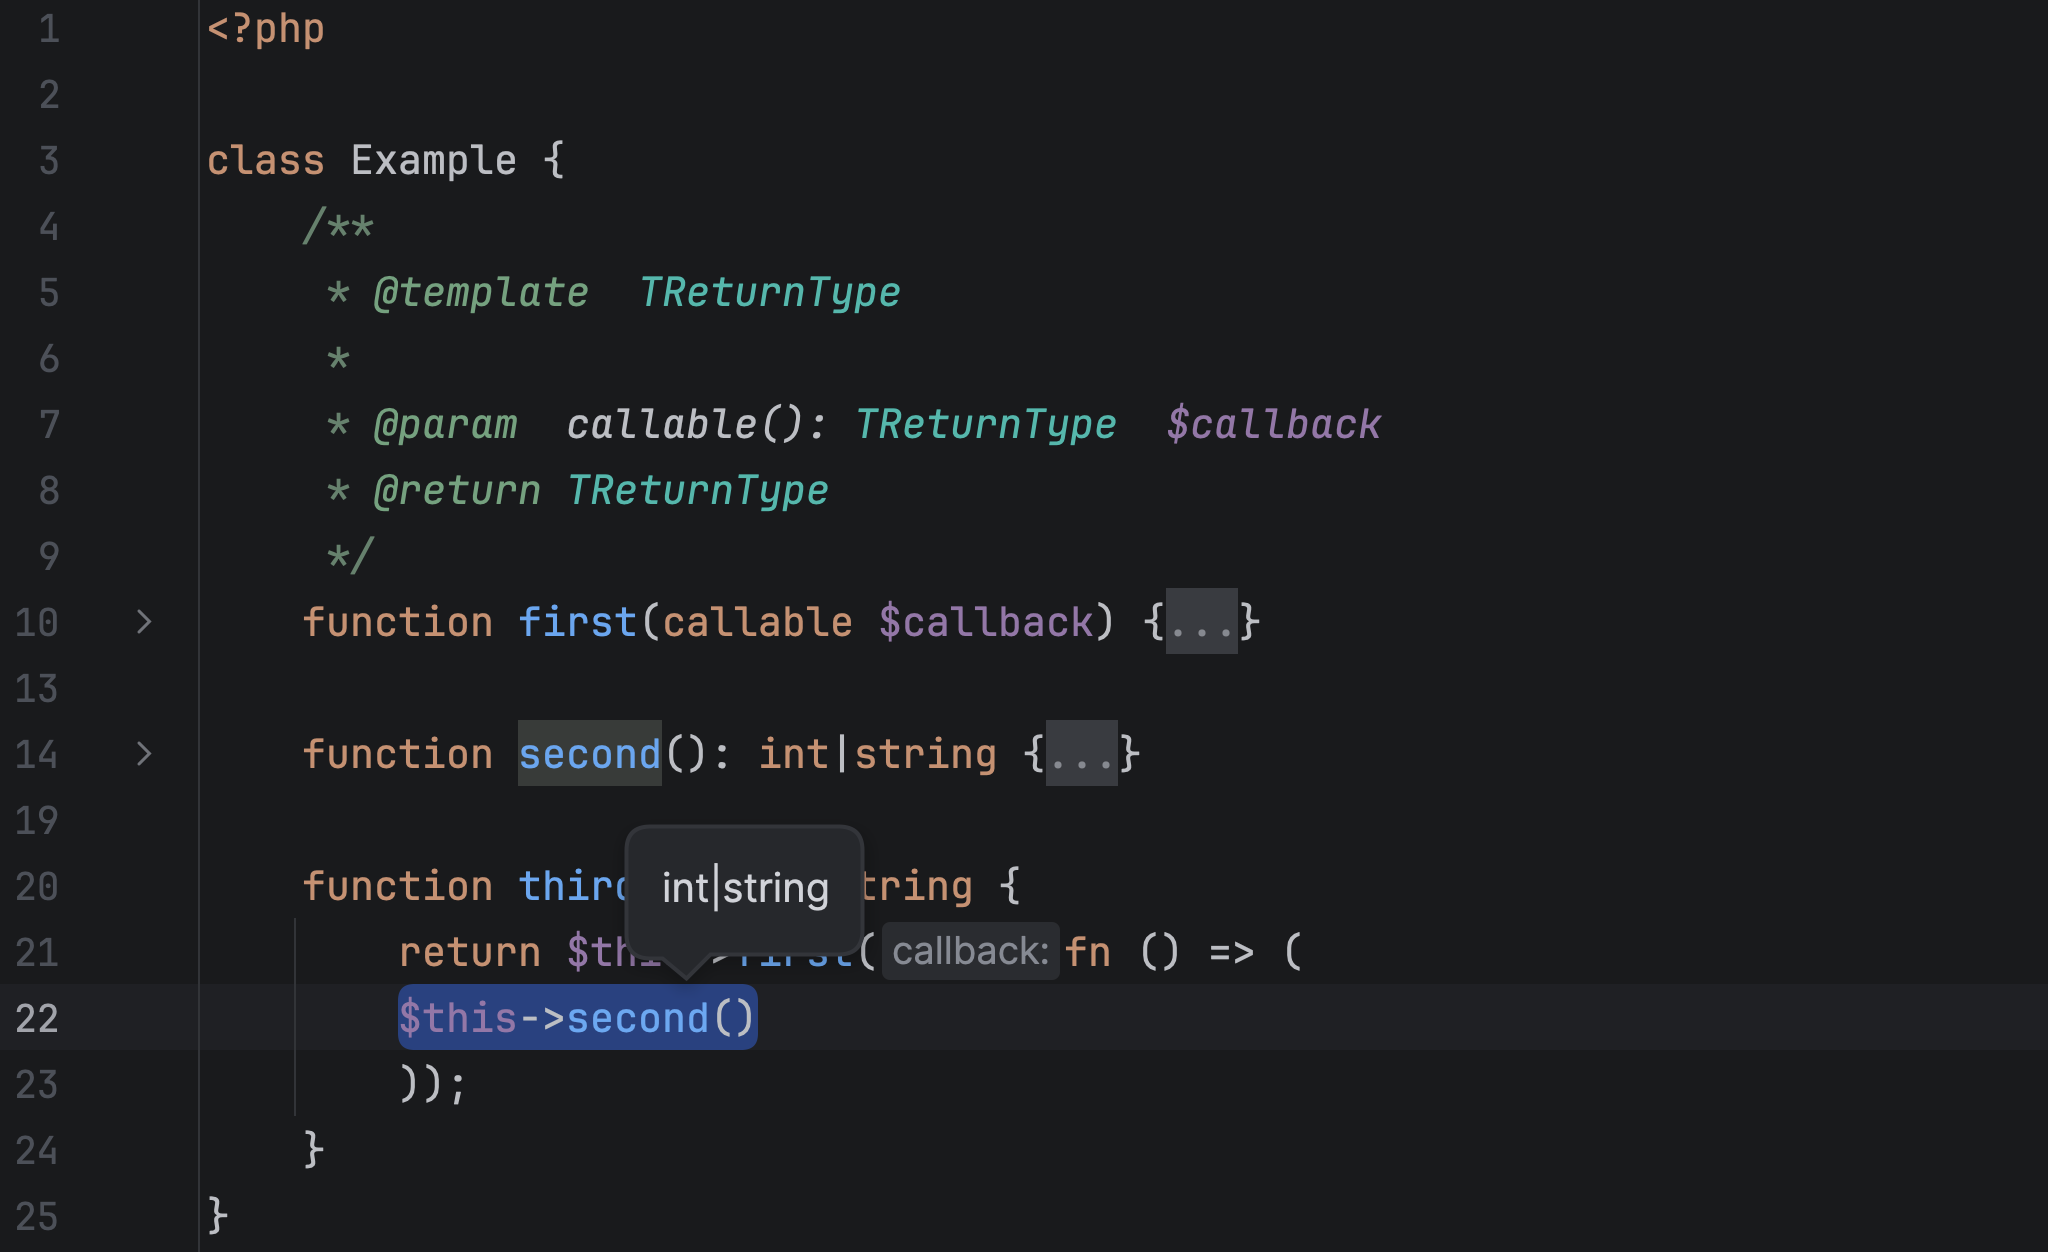
The new release brings a number of improvements and bug fixes for PhpStorm’s type inference engine, including:
Improved type inference for callable generic types. Now the IDE can infer both the input parameter type from a callable(T) annotation and the callable template return type.
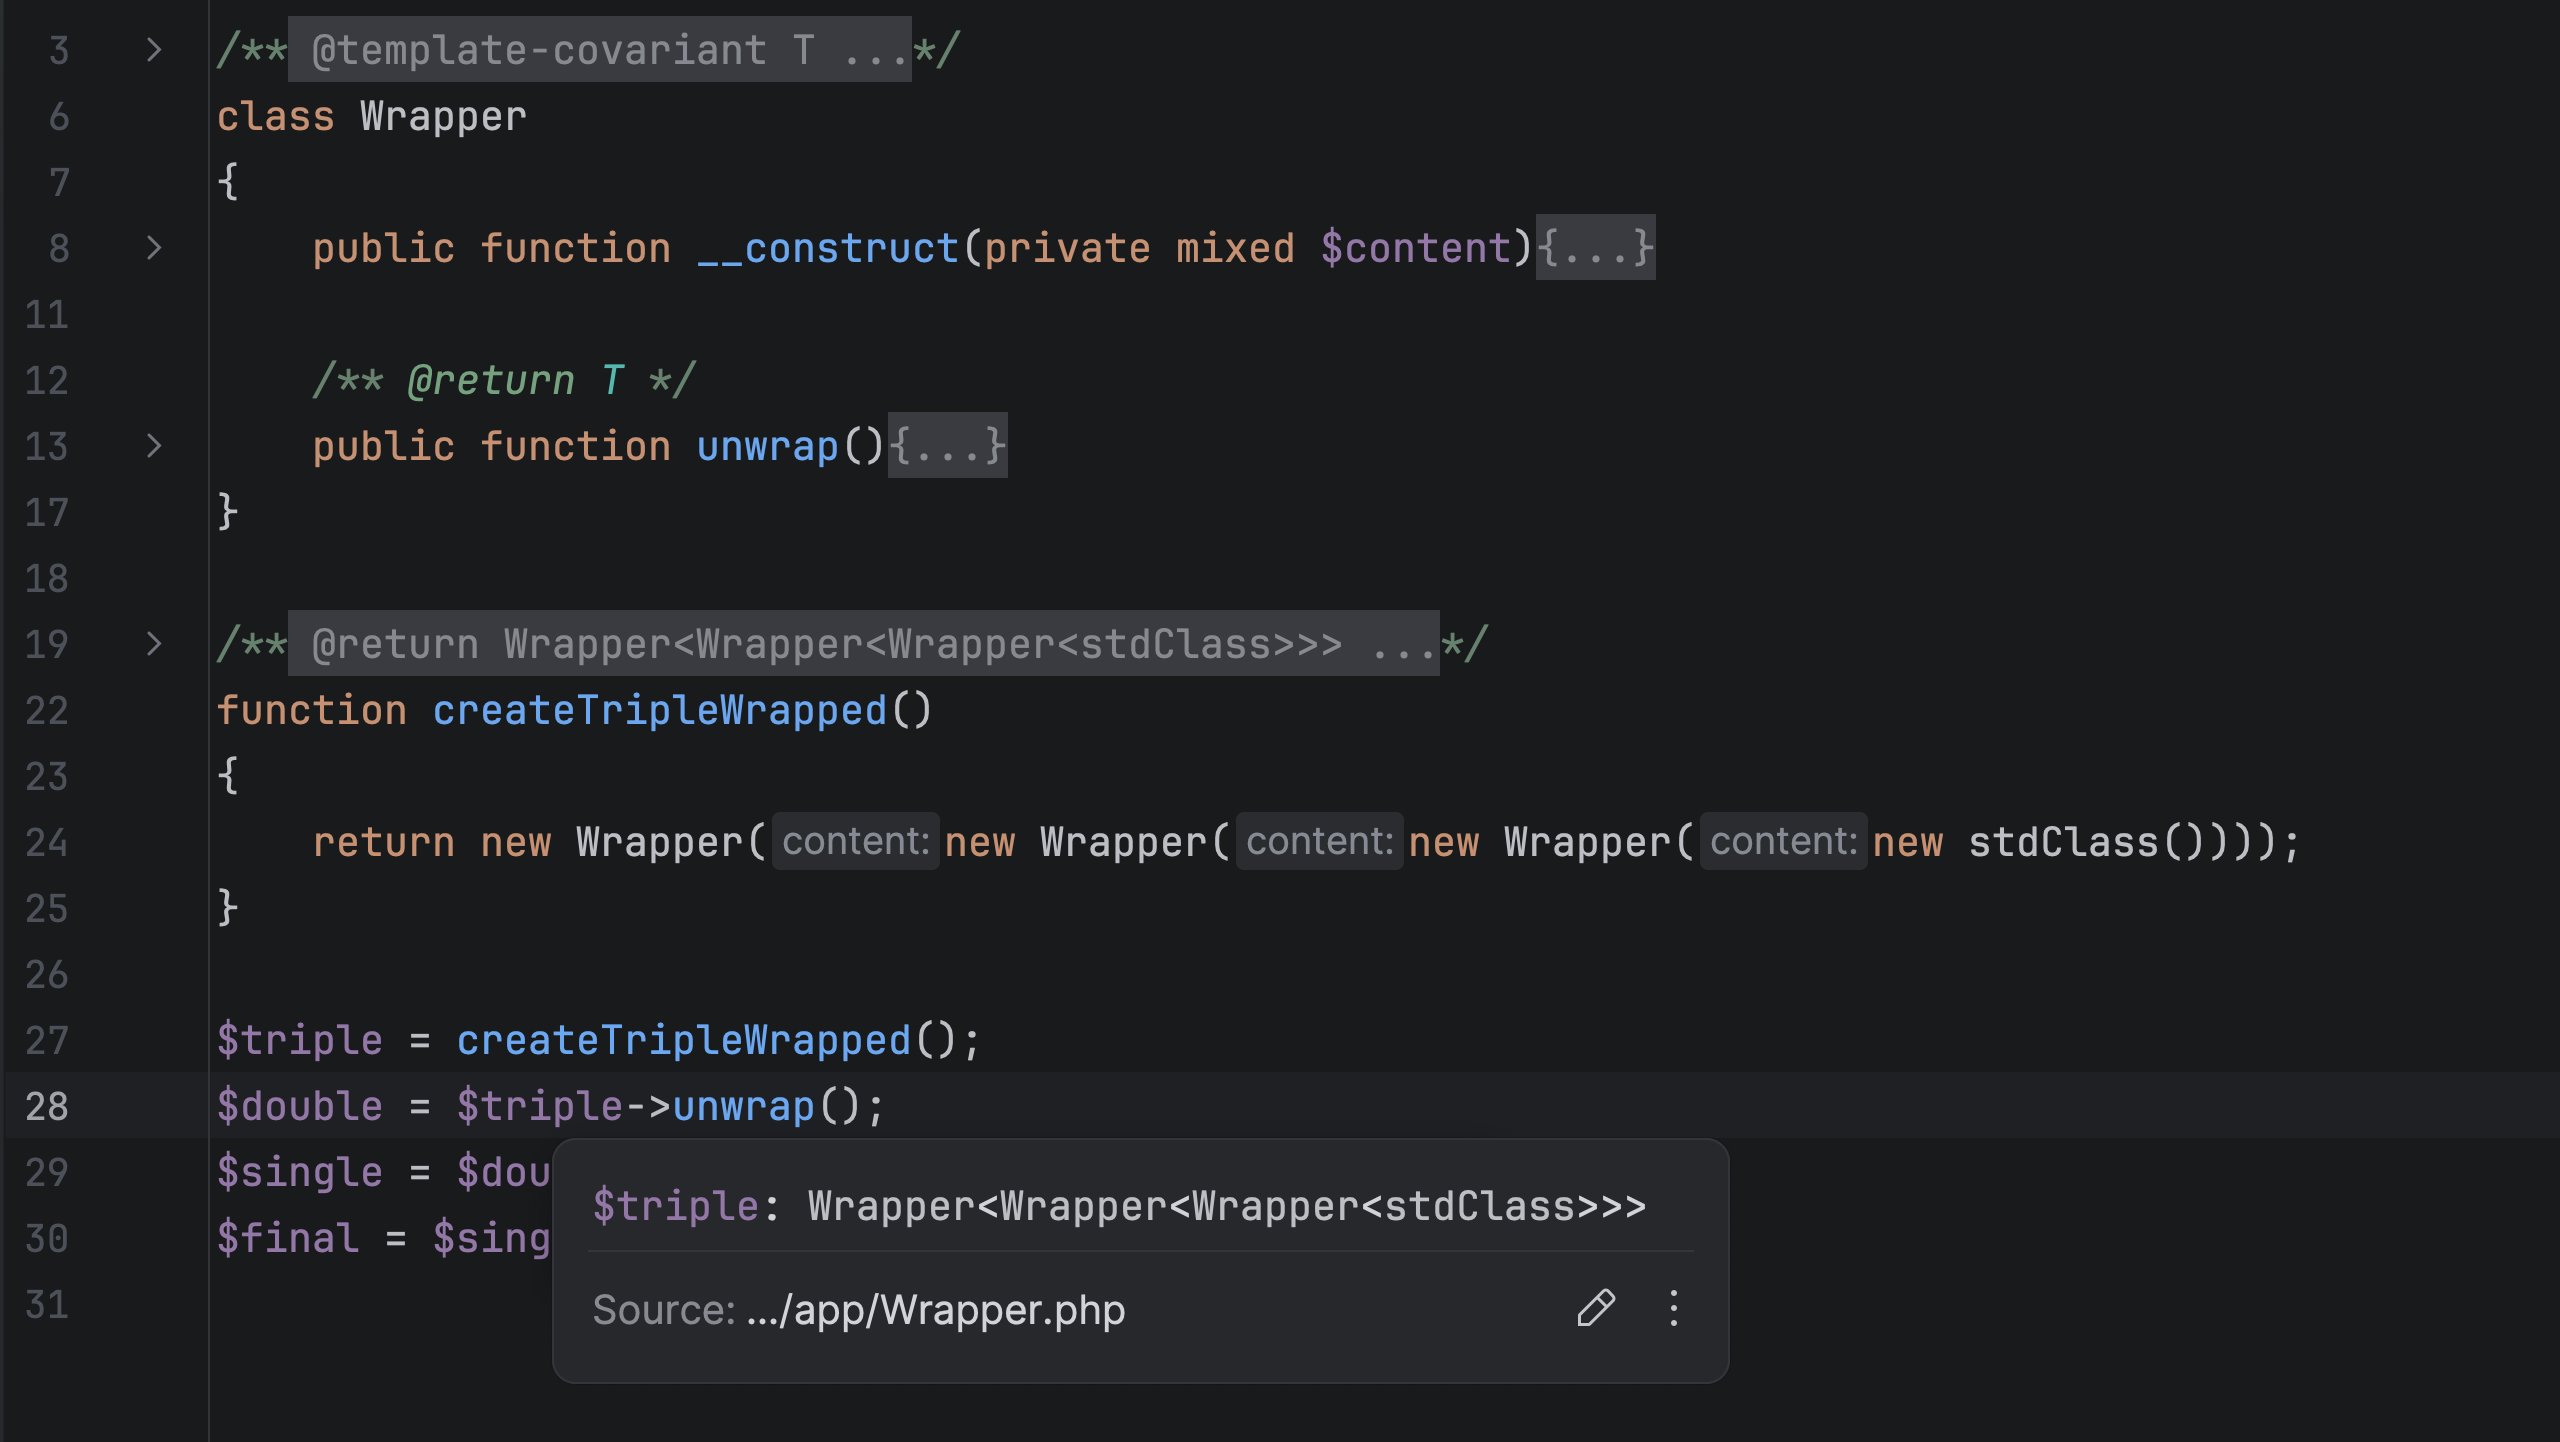
Improved display for nested parameterized template types. PhpStorm 2026.1 displays parameter type (Ctrl + Shift+P) and quick documentation (F1) info with multiple layers of wrapping, such as Wrapper<Wrapper<Wrapper<stdClass>>>.
More quality-of-life improvements
Debugging non-PHP files
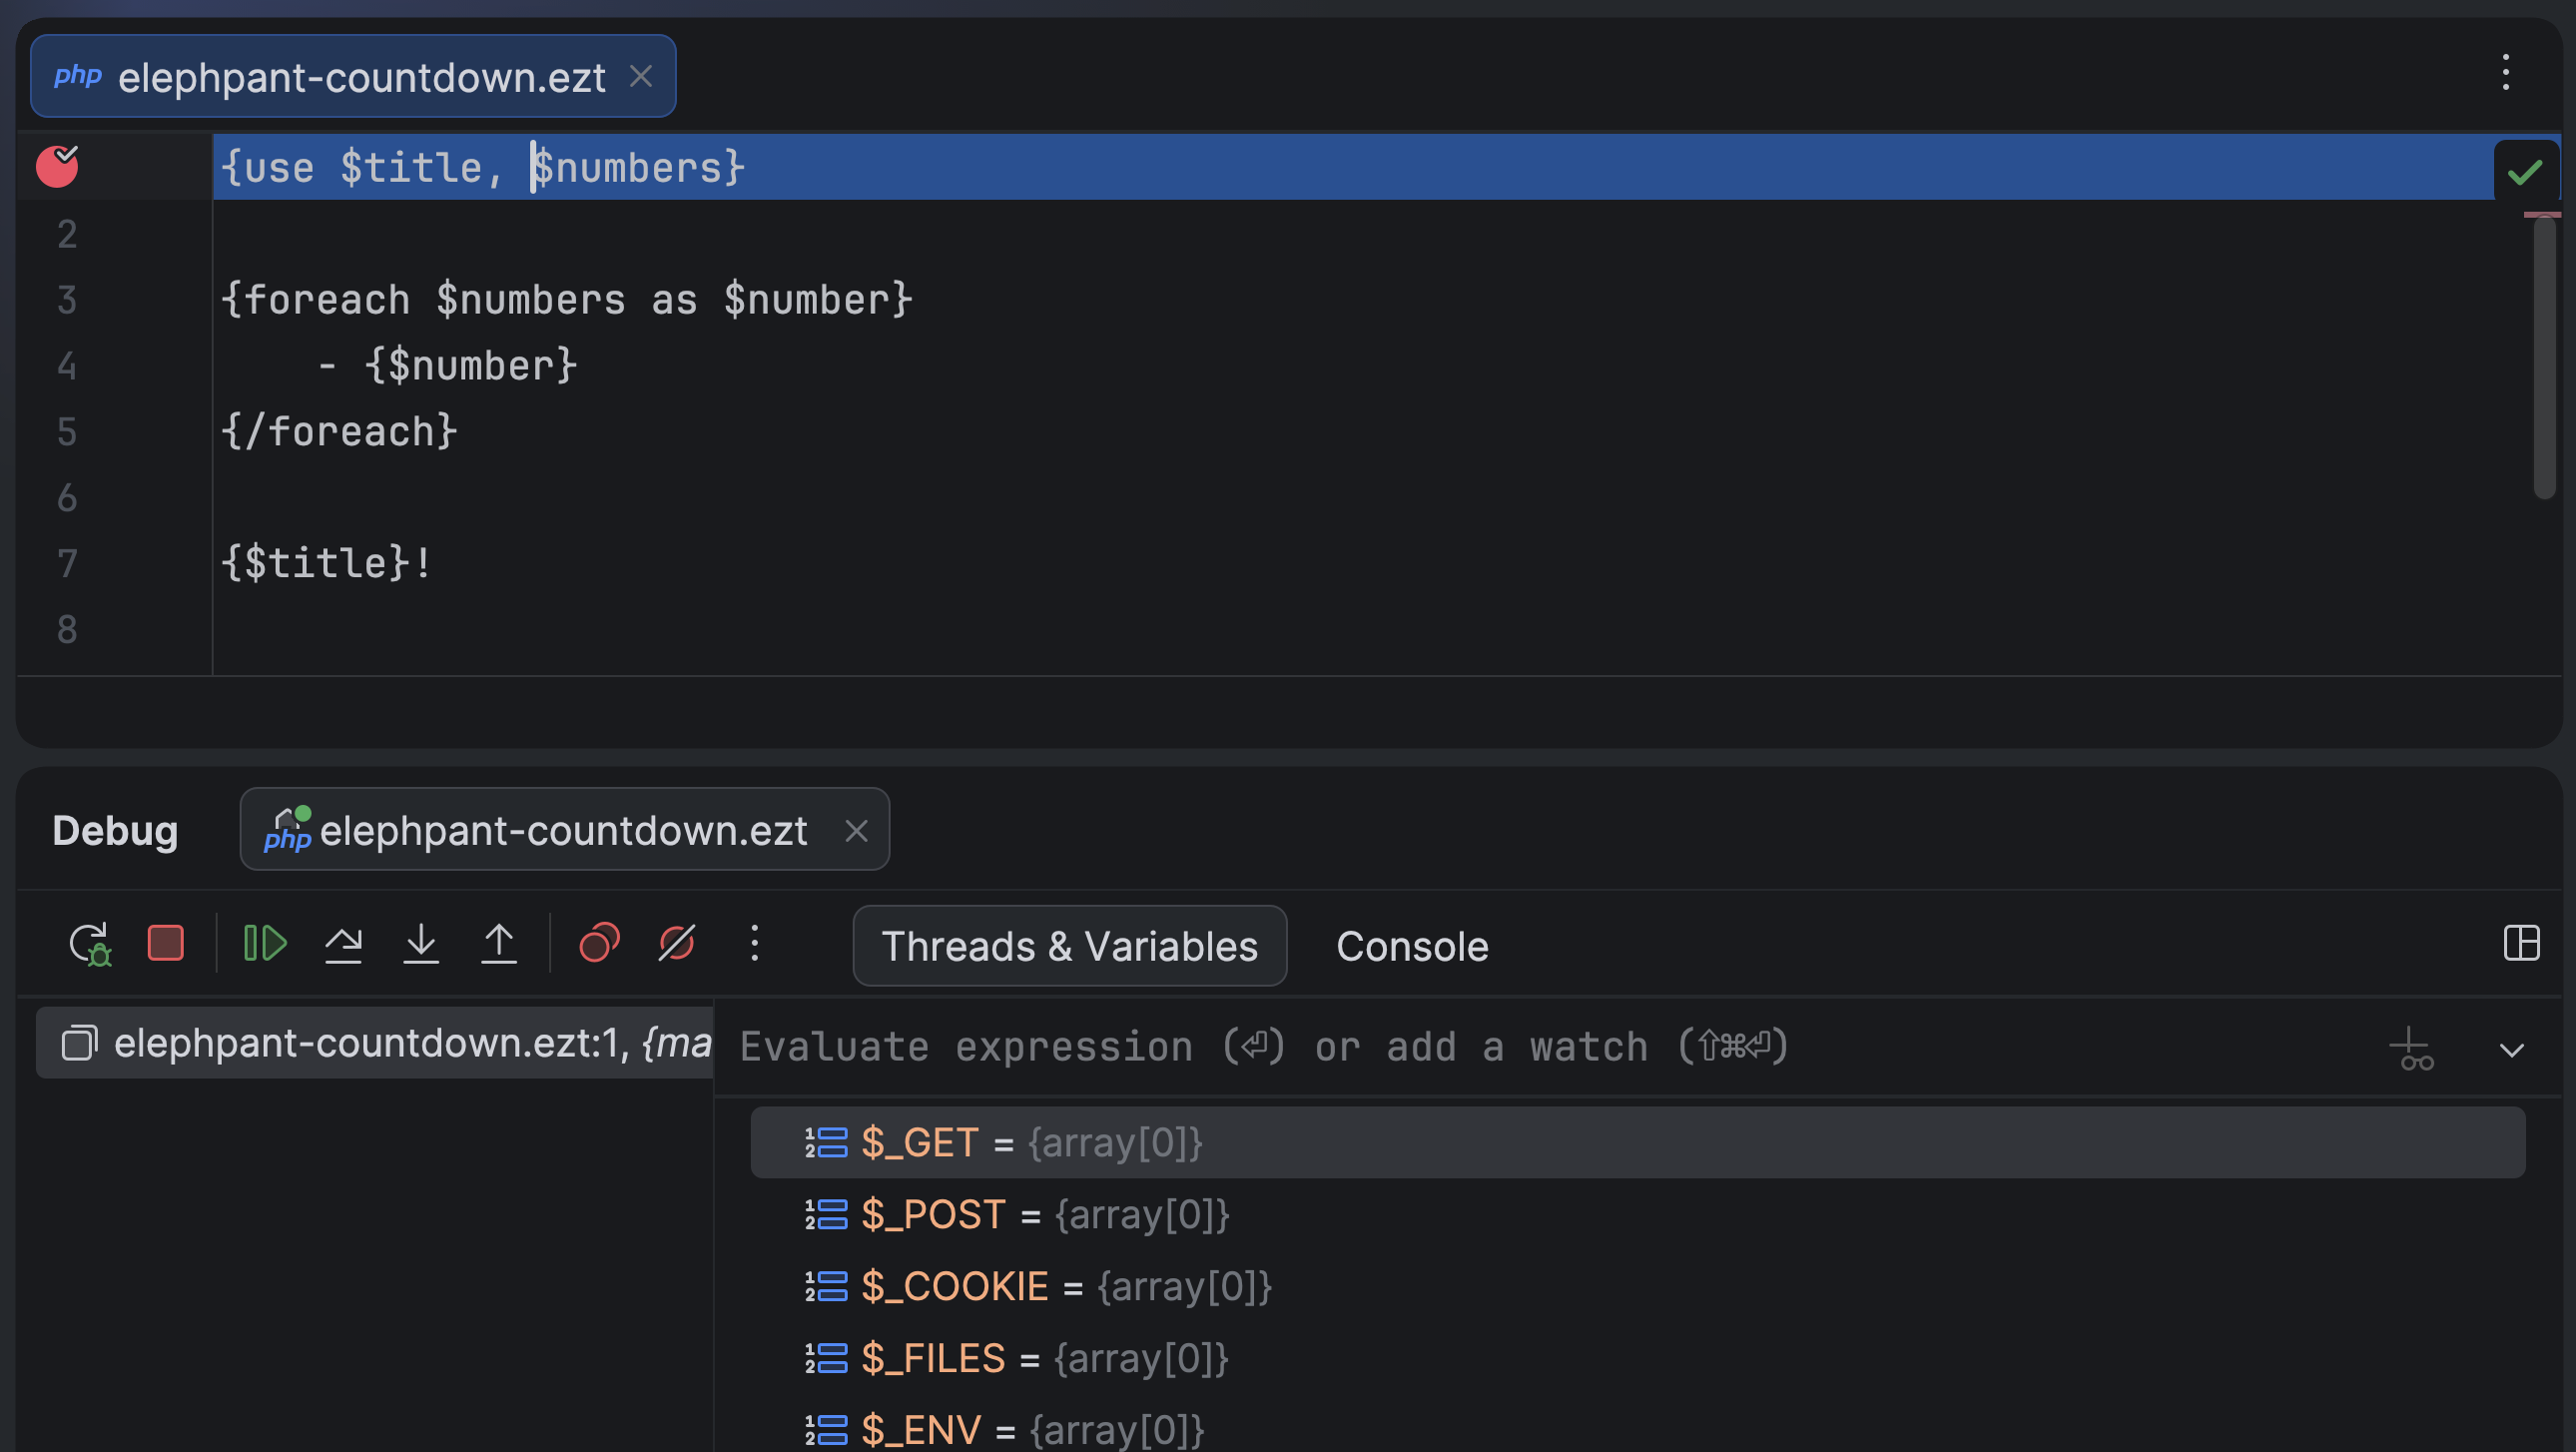
You can now set breakpoints in non-PHP files as soon as the file name pattern is associated with the PHP file type in the IDE settings. Together with native path mapping between templates and compiled PHP files introduced in Xdebug 3.5, this feature allows you to debug source template files of any format, including niche extensions like .ezt.
Improved Go to test navigation
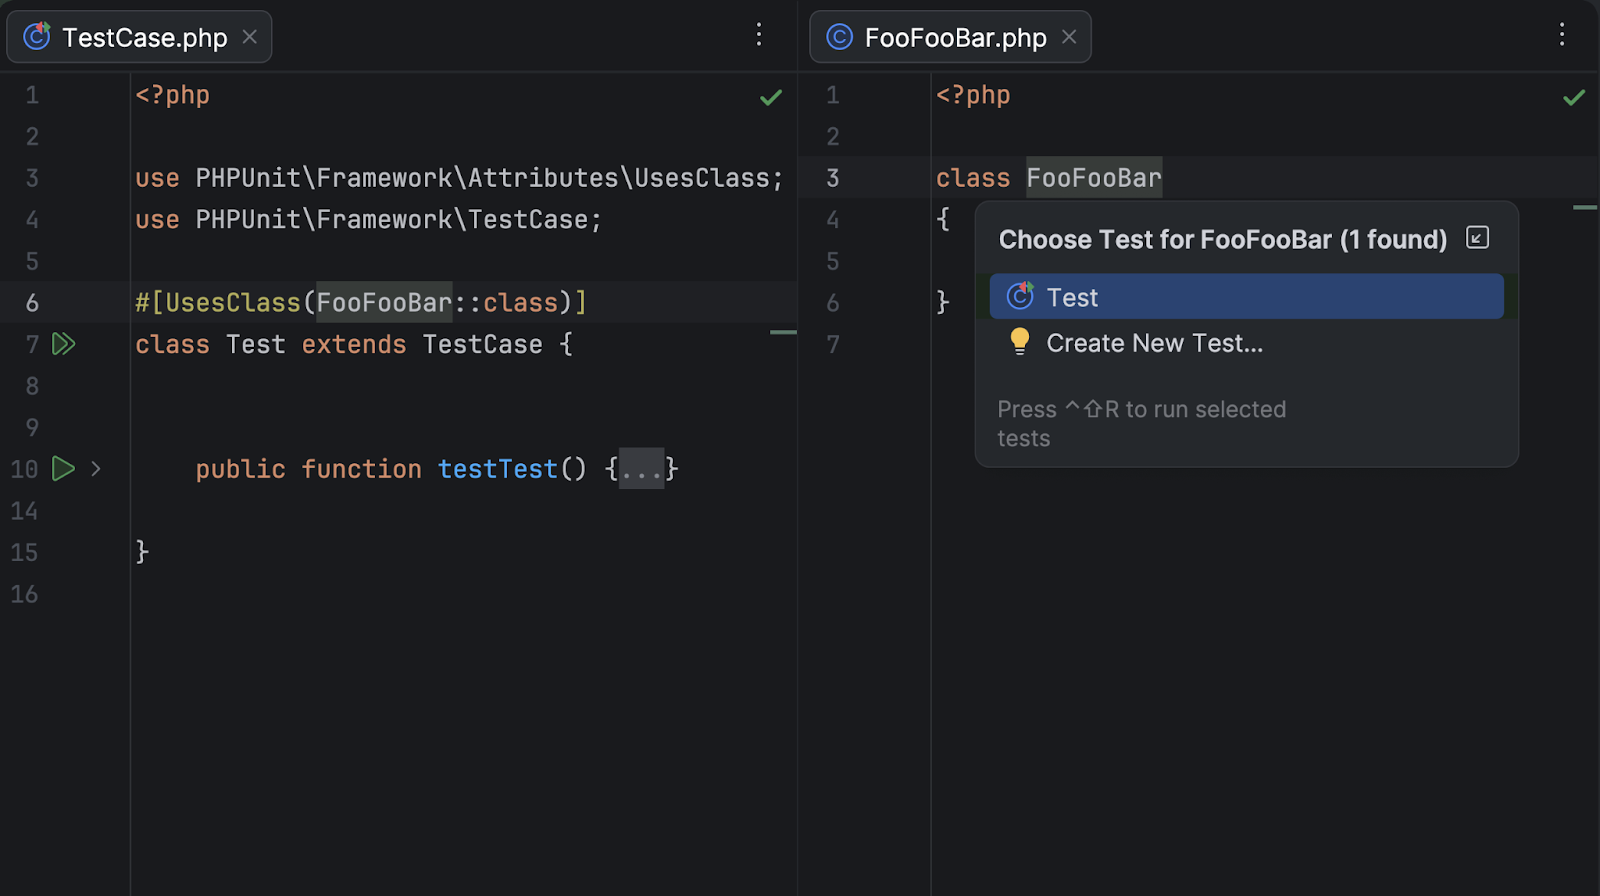
In PhpStorm 2026.1, we’ve improved Go to Test navigation for PHPUnit and Pest tests with the following enhancements:
Navigation between PHPUnit tests that use a #[UsesClass] or #[UsesMethod] attribute and the related class/method.
For Pest tests, you can now navigate from the Test Runner tab to the source test nested inside Pest describe blocks.
Convert to pipe operator quick-fix
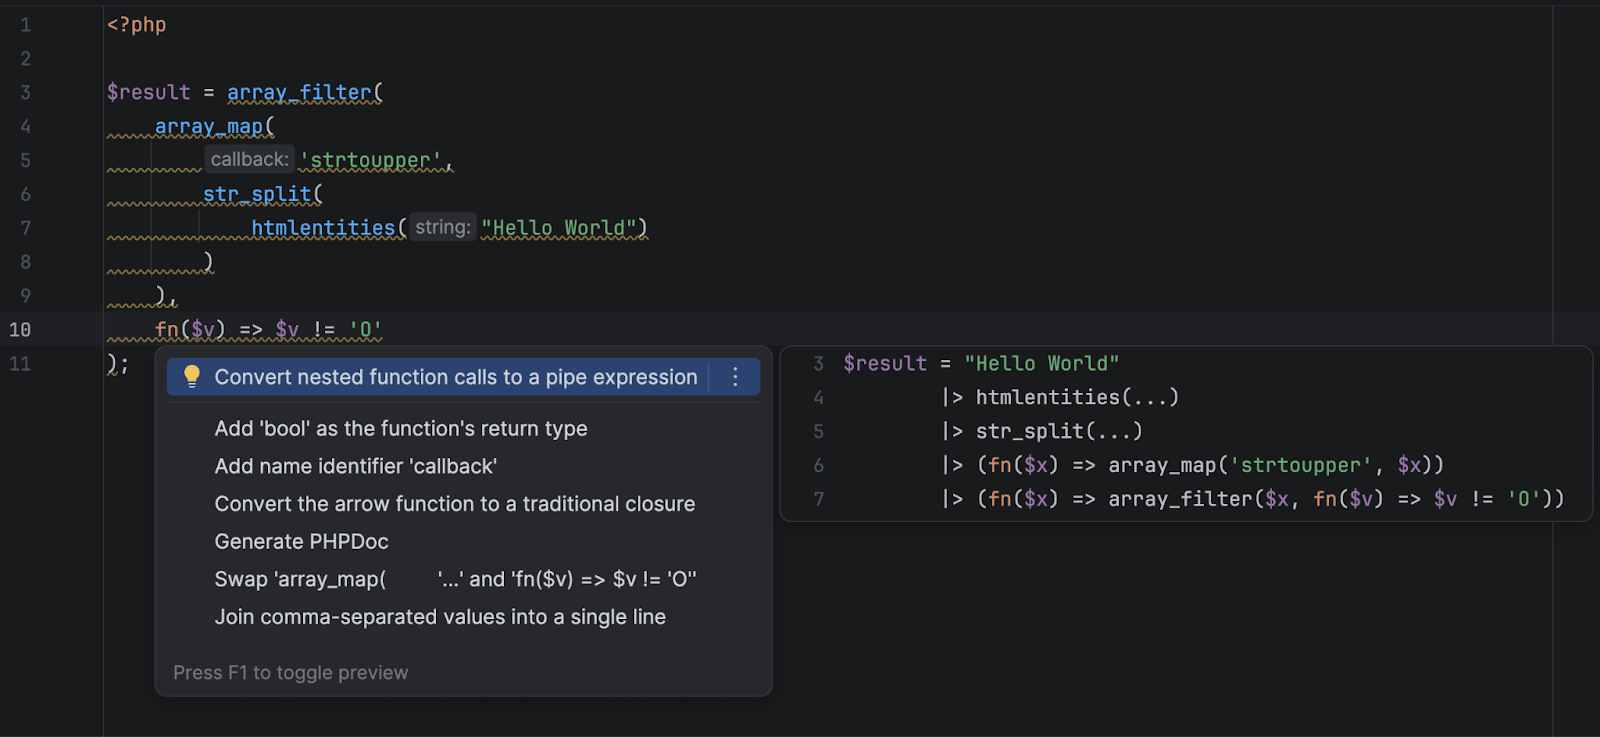
PhpStorm now detects code elements where the PHP 8.5 pipe operator syntax can be used and suggests a quick-fix to convert such code into easier-to-read pipe operator chains.
Laravel
Framework support: support for Laravel 13 and new versions of Livewire and Filament. Support for the new @hasStack and @includeIsolated Blade directives.
New package support: Laravel Wayfinder, PHP Native, staudenmeir/laravel-cte and staudenmeir/laravel-adjacency-list packages.
Eloquent enhancements: advanced #[Scope] methods support, optimized and more accurate Find Usages for scope, attribute and relation methods.
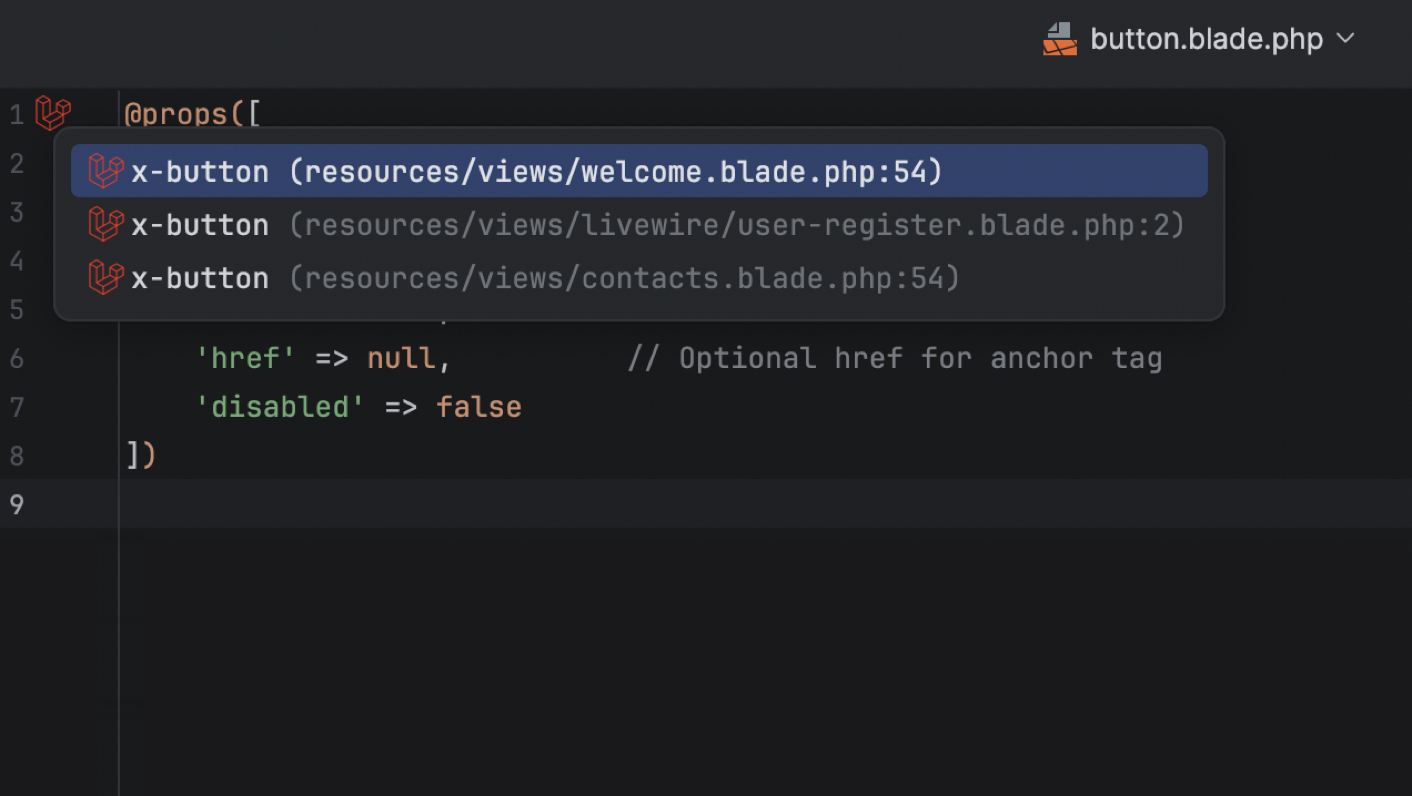
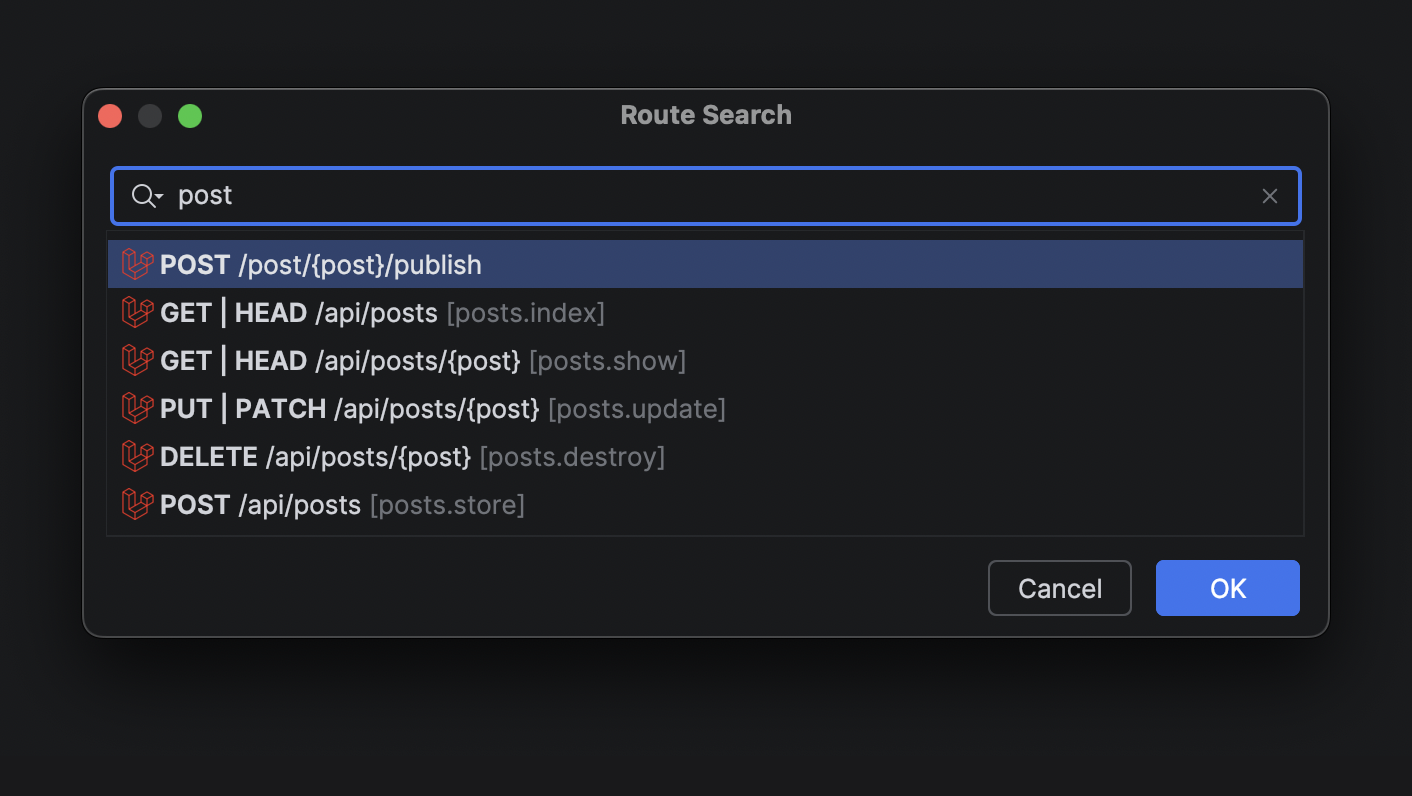
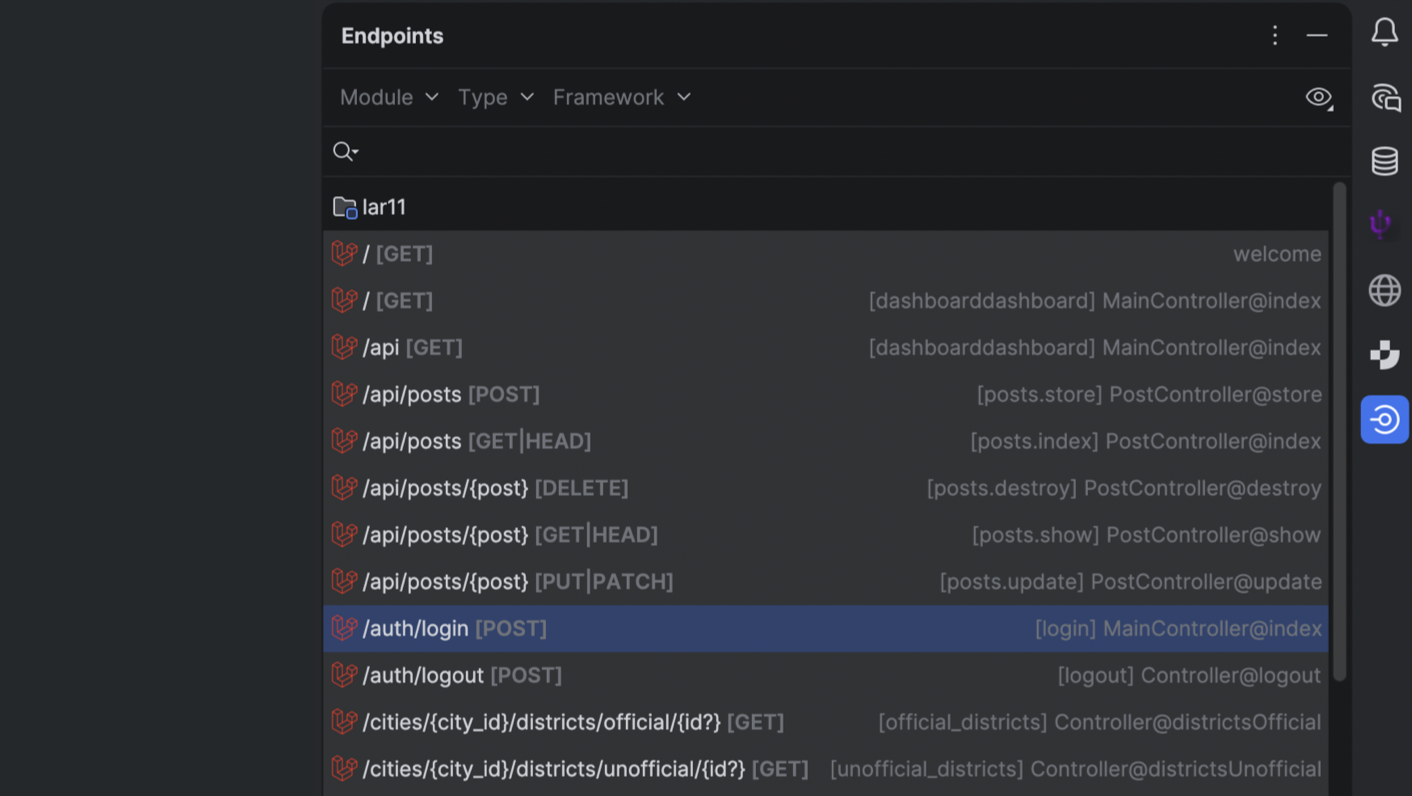
UI and navigation: Blade view usages UI, better controller inlays, new Route Search UI, and routes to the Endpoints tool window.
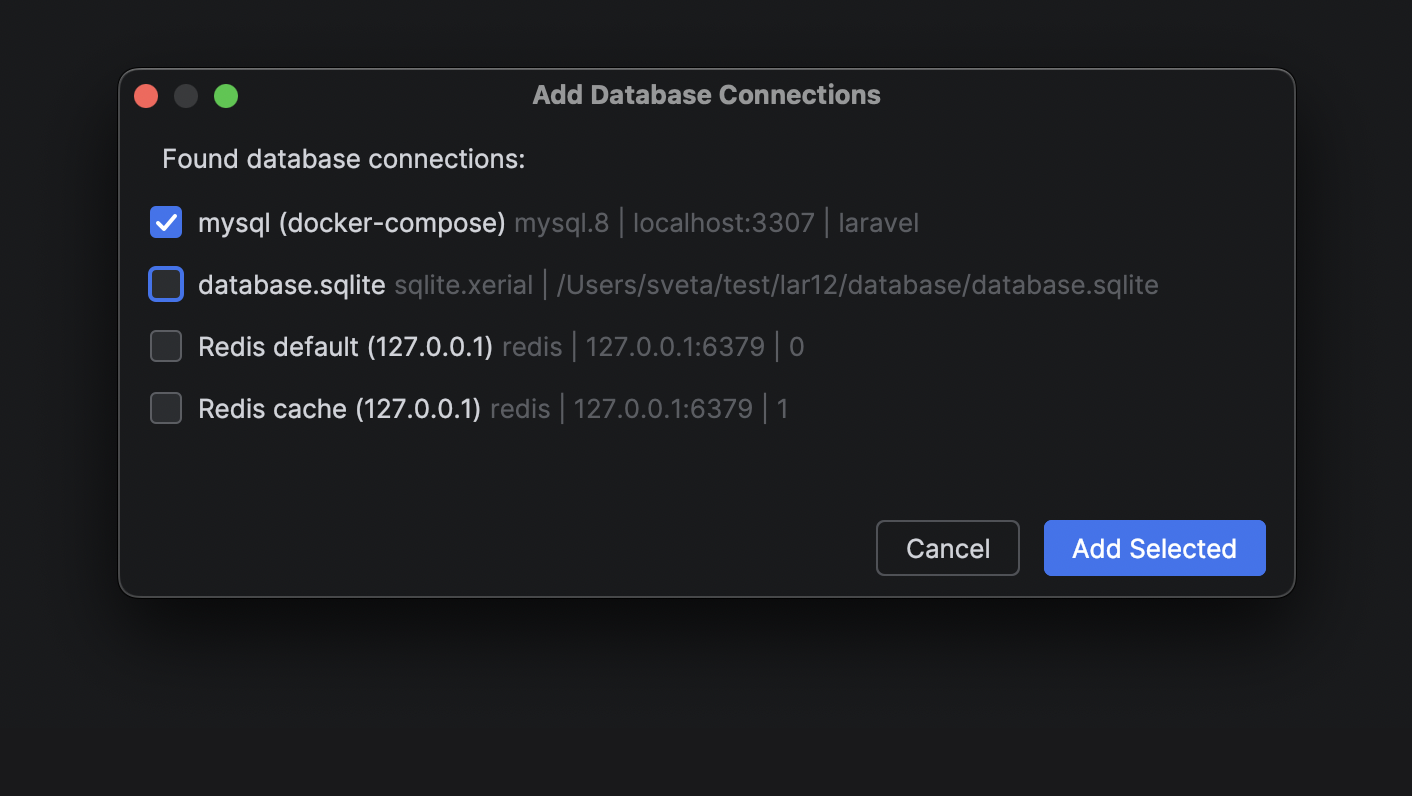
Productivity tweaks: a new Add Application Database action. Run Artisan commands in the Terminal tool window or via PHP interpreter.
Laravel Idea MCP server shipped with the PhpStorm MCP server.
For the full list of updates, see Laravel Idea’s changelog.
Frontend
PhpStorm’s TypeScript support now uses the service-powered type engine (built on the TypeScript language service) by default, delivering more accurate type inference and lower CPU usage in large projects. The TypeScript support is further improved with better auto-import handling for path aliases and project references, as well as the integration of inlay hints from the TypeScript Go-based language server. JavaScript parsing now also correctly handles string-literal import / export specifiers.
Framework and styling support have been refined across the board:
The IDE now highlights React’s new use memo and use no memo directives.
The Vue integration uses the updated 3.1.8 version of @vue/typescript-plugin.
Astro settings accept JSON-based configuration for language server integration.
Modern CSS color() functions and additional color spaces are supported in swatches and previews.
Angular 21.x template syntax is supported.
Databases
The AI chat integration for Codex and Claude Agent now offers full, native support for your connected databases. With that, you can now query, analyze, and modify your database state using natural language right from the IDE.
The same functionality is available for external agents via an MCP server.
Data source settings can now be stored in your JetBrains Account via data source templates. Especially nifty for All Products Pack users or anyone who uses multiple instances of JetBrains IDEs, this upgrade allows you to access data source templates and settings in every JetBrains IDE with database functionality.
Productivity-enhancing features
Editor caret and selection updates
We’re continuing to modernize our IDEs, and in this update, we’ve refreshed something you interact with constantly – the editor. Smooth caret animation and updated selection behavior provide improved comfort, a cleaner look, and a more enjoyable coding experience.
Read more
Work on multiple branches at once with Git Worktrees
With the evolution of AI agents, running multiple tasks in parallel has become a major time-saver, and this is precisely where Git worktrees are extremely handy. To support cutting-edge workflows for AI-boosted software development, PhpStorm now provides first-class support for Git worktrees. Create a separate worktree for an urgent hotfix, hand off another one to an AI agent, and keep working in your main branch – all at the same time, without interruption.
Even if you don’t use agents, worktrees will save you time on branch switching, especially in big projects.
Native Wayland support
IntelliJ-based IDEs now run natively on Wayland by default. This transition provides Linux professionals with ultimate comfort through sharper HiDPI and better input handling, and it paves the way for future enhancements like Vulkan support.
While Wayland provides benefits and serves as a foundation for future improvements, we prioritize reliability: The IDE will automatically fall back to X11 in unsupported environments to keep your workflow uninterrupted. Learn more.
Terminal completion
Stop memorizing commands. Start discovering them. In-terminal completion helps you instantly explore available subcommands and parameters as you type. Whether you’re working with complex CLI tools like Git, Docker, or kubectl or using your own custom scripts, this feature intelligently suggests valid options in real time.
Code With Me sunset
As we continue to evolve our IDEs and focus on the areas that deliver the most value to developers, we’ve decided to sunset Code With Me, our collaborative coding and pair programming service. Demand for this type of functionality has declined in recent years, and we’re prioritizing more modern workflows tailored to professional software development.
As of version 2026.1, Code With Me will be unbundled from all JetBrains IDEs. Instead, it will be available on JetBrains Marketplace as a separate plugin. 2026.1 will be the last IDE version to officially support Code With Me, as we gradually sunset the service.
Read the full announcement and sunset timeline in our blog post.
RubyMine 2026.1 is here! This release brings a range of improvements aimed at making Ruby and Rails development faster and more enjoyable.
You can get the new build from our website or via the free Toolbox App.
Let’s take a look at the highlights of this release.
AI
RubyMine continues to evolve as an open platform that lets you bring your preferred AI tools directly into your development workflow. With RubyMine 2026.1, working with multiple AI agents and integrating them into your IDE experience is now easier than ever.
Use more AI agents in RubyMine
In addition to Junie and Claude Agent, you can now choose more agents in the AI chat, including Codex. Additionally, Cursor and GitHub Copilot, along with dozens of external agents, are now supported via the Agent Client Protocol (ACP). With the new ACP Registry, you can discover available agents and install them in just one click.
Work with connected databases directly in the AI chat
The AI chat integration for Codex and Claude Agent now offers full, native support for your connected databases. With that, you can now query, analyze, and modify your database state using natural language right from the IDE.
The same functionality is available for external agents via MCP server.
Get next edit suggestions throughout your file
Next edit suggestions are now available without consuming AI quota of your JetBrains AI Pro, Ultimate and Enterprise subscriptions.These suggestions go beyond what is offered by traditional code completion for your programming language. Instead of updating only what’s at your cursor, they intelligently apply related changes across the entire file, helping you keep your code consistent and up to date with minimal effort.
This natural evolution of code completion delivers a seamless Tab Tab experience that keeps you in the flow.
Code insight
Try the new code insight engine (Beta)
RubyMine 2026.1 introduces a new, currently experimental, symbol-based language modeling engine.
This engine changes how RubyMine understands classes, modules, and constants (support for methods is planned for future releases), laying the groundwork for faster and more reliable code insight.
Our internal benchmarks show significant improvements.
Qualified first-element constant completion is about 40% faster, while the overall time for constant completion improved by roughly 50%. Type-matched completion for exceptions became dramatically faster – by about 95%. In addition, the performance of Find Usages improved by around 60% in large projects and by about 15% in typical cases.
Additional areas that benefit from the new engine include:
Rename refactoring
Quick Documentation, Quick Definition, and Ctrl+Hover hints
Structure view
Navigation (Go to Declaration and Go to Type Declaration)
Because the engine is still in Beta, it is disabled by default. You can enable it in Settings | Languages & Frameworks | Ruby | Code Insight.
Give it a try and share your feedback!
Remote development
Boost your productivity with Stable remote development
Remote development officially moves out of Beta and becomes Stable in RubyMine 2026.1.
You can now connect to your development environments via SSH, Dev Containers, or WSL 2, and the IDE backend will run on the remote machine while the user interface remains fast and responsive on your local device.
This setup gives you the full RubyMine experience wherever your code lives.
Rails
Work seamlessly with variables passed via render
RubyMine now correctly recognizes local variables passed via render.
Variables provided through the locals: option are no longer marked as unresolved and appear in code completion.
This behavior works consistently across views, layouts, partials, and templates (ERB and HAML), providing cleaner code insight and fewer unnecessary warnings.
Detect deprecated Rails associations instantly
Keeping Rails projects modern and maintainable is now easier with improved deprecation detection.
When a Rails association is marked as deprecated (for example, has_many :posts, deprecated: true), RubyMine highlights all its usages throughout your project and shows a clear deprecation notice in the Quick Documentation popup.
This helps you identify outdated APIs early and update your code proactively.
Use Rails virtual database columns
RubyMine 2026.1 adds recognition for virtual generated columns from PostgreSQL 18 (or later versions) in Rails projects.
These non-persisted columns behave just like regular attributes in the IDE. Code completion, type hints, and navigation to the column definition in schema.rb work seamlessly.
Ruby and RBS
Use endless methods with access modifiers
RubyMine now fully supports Ruby 4.0 endless methods with access modifiers. Code such as private def hello = puts "Hello" is now parsed correctly and no longer produces errors.
Use more Ruby and RBS operators in completion
You can now type Ruby and RBS operators (=, !, +, *, and others) directly in the completion popup without closing it. This keeps you in the flow and helps you finish expressions faster.
Rename global variables safely
RubyMine now validates global variable names during renaming.
Invalid names such as $foo!@# are no longer allowed, preventing broken code and syntax errors. The IDE ensures renamed variables follow Ruby’s syntax rules, making refactoring safer and more reliable.
Let RubyMine select the Ruby interpreter automatically
RubyMine 2026.1 can automatically detect the correct Ruby interpreter by analyzing configuration files such as .ruby-version or .tool-versions.
There are three scenarios:
Single match found: RubyMine sets the interpreter automatically so you can start coding immediately.
Multiple matches or no match found: RubyMine shows a notification and helps you choose the correct interpreter.
No configuration file found: RubyMine selects the latest installed MRI Ruby version as a safe default.
If you prefer manual configuration, you can disable this behavior in Settings | Languages & Frameworks | Ruby. Find more details in our docs.
User experience improvements
Debug failing tests faster with the diff viewer
RubyMine 2026.1 introduces a diff viewer for failed RSpec and minitest tests.
When a test fails, simply click Click to see differencein the test results to open a side-by-side comparison of expected and actual values. This makes it much easier to identify the issue and fix failing tests quickly.
Configure linting and formatting with ease
RubyMine now features a redesigned configuration for RuboCop and the standard gem, along with a new Linting and Formatting section in Settings | Tools | RuboCop.
You can choose from mutually exclusive options:
Default
Standard gem inspections
Standard on save
RuboCop server mode
RuboCop on save
The updated settings simplify configuration, prevent conflicts between tools, and integrate tightly with RubyMine formatting actions.
Other
Plan ahead for the sunsetting of Code With Me
Starting with RubyMine 2026.1, Code With Me will be unbundled from JetBrains IDEs and distributed as a separate plugin on JetBrains Marketplace.
RubyMine 2026.1 will be the last IDE version to officially support Code With Me as the service is gradually sunset.
Read the full announcement and timeline in our blog post.
Stay in touch
Follow RubyMine on X to stay up to date on all the latest features.
We invite you to share your thoughts in the comments below. You can also suggest and vote for new features in our issue tracker.
Agent-assisted development is quickly becoming a common mode of software development. New techniques are emerging to help LLMs generate code that matches your preferences and standards.
One common approach is to create an AGENTS.md, CLAUDE.md, or GEMINI.md file with project details, build instructions, and coding guidelines. The AI agent loads this file into context on every request.
This has two drawbacks:
It consumes tokens on every request, increasing cost.
Loading too much context into an LLM degrades its effectiveness.
Agent Skills is a new initiative that solves both problems by managing context progressively and extending AI agent capabilities on demand.
What are Agent Skills?
Agent Skills is an open standard introduced by Anthropic, to extend AI agent capabilities with specialized knowledge and workflows.
Consider a use case where you want an AI to generate presentations using your company’s slide template and design guidelines. You can package those assets (the PPT template, font files, and design rules) into a skill. The agent then uses that skill to generate slides that match your standards automatically.
A skill is a folder containing a SKILL.md file. This file includes metadata (name and description at minimum) and instructions that tell an agent how to perform a specific task. Skills can also bundle scripts, templates, and reference materials.
---
name: name-of-the-skill
description: Skill description.
license: Apache-2.0
metadata:
  author: author/org
  version: "1.0"
compatibility: Requires git, docker, jq, and access to the internet
---

Skill Content
In a SKILL.md file, name and description are required fields, and you can add optional fields like licence, metadata, compatibility, etc. You can explore more about the Skill Specification here.
How do Agent Skills manage context?
At startup, agents load only the metadata (name and description) of installed skills. When you ask the agent to perform a task, it finds the relevant skill and loads only that SKILL.md into context.
This progressive loading keeps context minimal and pulls in additional information only when needed, unlike a monolithic CLAUDE.md that loads everything upfront.
What can be a skill?
Skills extend AI capabilities across a wide range: from coding guidelines for a specific library, to step-by-step workflows with reference documents and helper scripts.
For example, you can create a skill that:
Specifies which library APIs to use and which anti-patterns to avoid.
Bundles reference documentation in a references/ directory.
Includes helper scripts in a scripts/ directory.
Case Study: Implementing Spring Data JPA Pagination
Suppose you ask an AI agent to implement a Spring Boot REST API endpoint that returns a paginated list of Post entities along with their Comment collections.
Without guidance, the agent is likely to produce one of these common mistakes:
N+1 SELECT problem — lazy-loading comments trigger a separate query per post.
In-memory pagination — using JOIN FETCH with pagination loads all rows into memory, then paginates in the application layer.
You can check out the sample code from the GitHub repository https://github.com/sivaprasadreddy/agent-skills-demo
Let us see how an AI Agent might generate code when asked to implement a REST API endpoint to return paginated posts along with comments.
Without any specific guidelines or skills, the AI Agent generated the following implementation:
@RestController
@RequestMapping("/api/posts")
class PostController {
   private final PostService postService;

   PostController(PostService postService) {
       this.postService = postService;
   }

   @GetMapping
   PagedResult<PostDto> getPosts(
           @RequestParam(name = "page", defaultValue = "1") int pageNo,
           @RequestParam(name = "size", defaultValue = "10") int pageSize) {
       return postService.getPosts(pageNo, pageSize);
   }

}


@Service
@Transactional(readOnly = true)
public class PostService {
   private final PostRepository postRepository;

   public PostService(PostRepository postRepository) {
       this.postRepository = postRepository;
   }

   public PagedResult<PostDto> getPosts(int pageNo, int pageSize) {
       Sort sort = Sort.by(Sort.Direction.ASC, "id");
       Pageable pageable = PageRequest.of(pageNo <= 0 ? 0 : pageNo - 1, pageSize, sort);
       Page<PostDto> postPage = postRepository.findAllWithComments(pageable).map(PostDto::from);
       return PagedResult.from(postPage);
   }

}
If you run the application and invoke the GET /api/posts endpoint, you will get the results, but in the logs you will find the below WARNING:
HHH000104: firstResult/maxResults specified with collection fetch; applying in memory
This essentially means, Hibernate will load all the entities into memory and then apply pagination. This will result in poor performance and even OutOfMemory exceptions if there are a large number of rows in the posts table.
A Spring Data JPA skill prevents both issues by giving the agent explicit guidelines and a working code example.
Spring Data JPA Agent Skill
Create a spring-data-jpa/SKILL.md file with the following content:
---
name: spring-data-jpa-skill
description: Implement the persistence layer using Spring Data JPA in Spring Boot applications.
---

Follow the below principles when using Spring Data JPA:

1. Disable the Open Session in View (OSIV) filter:
spring.jpa.open-in-view=false
2. Disable in-memory pagination:
spring.jpa.properties.hibernate.query.fail_on_pagination_over_collection_fetch=true

3. Avoid the N+1 SELECT problem: use JOIN FETCH to load associated child collections in a single query.
4. Avoid in-memory pagination: when loading a paginated list of parent entities with child collections:
	* First, load only the parent IDs using pagination
	* Then, load the full entities with their child collections using JOIN FETCH for those IDs
	* Assemble the final Page from the paginated IDs and the loaded entities


## Pagination with child collections example:

PostRepository.java

public interface PostRepository extends JpaRepository<Post, Long> {

   @Query("select p.id from Post p order by p.id")
   Page<Long> findPostIds(Pageable pageable);

   @Query("select distinct p from Post p left join fetch p.comments where p.id in :ids")
   List<Post> findAllByIdInWithComments(@Param("ids") Collection<Long> ids);
}


PostService.java

@Service
public class PostService {
   private final PostRepository postRepository;

   public PostService(PostRepository postRepository) {
       this.postRepository = postRepository;
   }

   @Transactional(readOnly = true)
   public Page<Post> findPosts(Pageable pageable) {
       Page<Long> idsPage = postRepository.findPostIds(pageable);
       if (idsPage.isEmpty()) {
           return Page.empty(pageable);
       }
       List<Post> posts = postRepository.findAllByIdInWithComments(idsPage.getContent());
       return new PageImpl<>(posts, pageable, idsPage.getTotalElements());
   }
}
How to use Agent Skills?
Agent Skills work with Claude Code, Codex, Gemini CLI, JetBrains Junie, and other agents. Install a skill at the project level or user level depending on your preference.
Agent
Project-Level
User-Level
Junie
.junie/skills/
~/.junie/skills/
Claude Code
.claude/skills/
~/.claude/skills/
Codex
.agents/skills/
~/.agents/skills/
Gemini CLI
.gemini/skills/(or).agents/skills/
~/.gemini/skills/(or)~/.agents/skills/
To use the Spring Data JPA skill with Claude Code:
Copy the spring-data-jpa/ directory into {project-root}/.claude/skills/.
Ask Claude Code to implement a paginated REST API endpoint.
Claude Code discovers the skill automatically and follows the guidelines.
As you can see, Claude Code automatically discovered the Spring Data JPA skill and generated the following implementation following the guidelines given in the skill.
@Service
public class PostService {
   private final PostRepository postRepository;

   public PostService(PostRepository postRepository) {
       this.postRepository = postRepository;
   }

   @Transactional(readOnly = true)
   public Page<Post> findPosts(Pageable pageable) {
       Page<Long> idPage = postRepository.findPostIds(pageable);
       if (idPage.isEmpty()) {
           return Page.empty(pageable);
       }
       List<Post> posts = postRepository.findAllByIdInWithComments(idPage.getContent());
       return new PageImpl<>(posts, pageable, idPage.getTotalElements());
   }
}
With this implementation, only the Post IDs of the desired page will be loaded first, and then a list of posts along with their comments will be fetched in a separate query. This will fix the pagination in-memory issue.
Using Agent Skills with Junie
You can use the JetBrains Junie Agent to generate code which automatically loads the necessary skills from .junie/skills and directory.
The Junie agent loaded spring-data-jpa skill based on the given task and applied the guidelines. You can also observe that Junie automatically runs the relevant tests to verify the generated code is working or not and iterate until the tests are passed.
In the sample repository https://github.com/sivaprasadreddy/agent-skills-demo, you can find the following branches to try out the spring-data-jpa Agent Skill:
main: Starting point to try implementing the mentioned usecase without any skills.
in-memory-pagination-issue: Usecase implementation generated by AI that results in in-memory pagination issue.
skills: With spring-data-jpa skill to try implementing the mentioned usecase.
Summary
If the AI agent is generating code with any anti-patterns or not following team coding standards and conventions, instead of fixing issues one-by-one with follow-up prompts, consider creating a skill to provide those as guidelines.
To explore more on Agent Skills, please refer to the following resources: