Anime vs. Marvel/DC: Designing Digital Products With Emotion In Flow

Design isn’t only pixels and patterns. It’s pacing and feelings, too. Some products feel cinematic as they guide us through uncertainty, relief, confidence, and calm without yanking us around. That’s Emotion in Flow. Others undercut their own moments with a joke in the wrong place, a surprise pop-up, or a jumpy transition. That’s Emotion in Conflict.

These aren’t UX-only ideas. You can see them everywhere in entertainment. And the clearest way to feel the difference is to compare how anime handles emotional shifts versus how Marvel and DC films stumble. We’ll use two specific examples, one from Dan da Dan (anime series on Netflix) and one from James Gunn’s Superman movie, to define the two concepts, and then translate them into practical product design patterns you can apply right away.

Note: We’ll focus on digital products, including apps, SaaS, and web.

Emotion In Flow (Anime: Dan da Dan)

In Dan da Dan, the tonal range is wild, horror, comedy, tenderness, yet it flows.

Example: In one arc, the protagonists are on a bizarre, comedic quest involving the “golden genitals” of one of the main characters (yes, really), and in another, we’re drawn into a heartbreaking story of a mother whose child is kidnapped. On paper, that shift should be a car crash. On screen, it’s coherent and emotionally legible.

Why does this work on screen?

  • Continuity of stakes.
    Even when a gag lands, the characters’ goals and danger stay intact. Humor releases tension after a mini‑resolution; it doesn’t deny the threat.
  • Clear mood cues.
    Music, framing, pacing, and character reactions telegraph the next feeling. You’re primed for the shift, so you ride it rather than getting yanked.
  • One emotional anchor.
    Relationships remain the North Star, so the scene’s heart doesn’t get lost when the tone moves.

How does this translate to UX?

Good products do the same: prepare, transition, resolve, so users stay immersed as the emotional tone shifts.

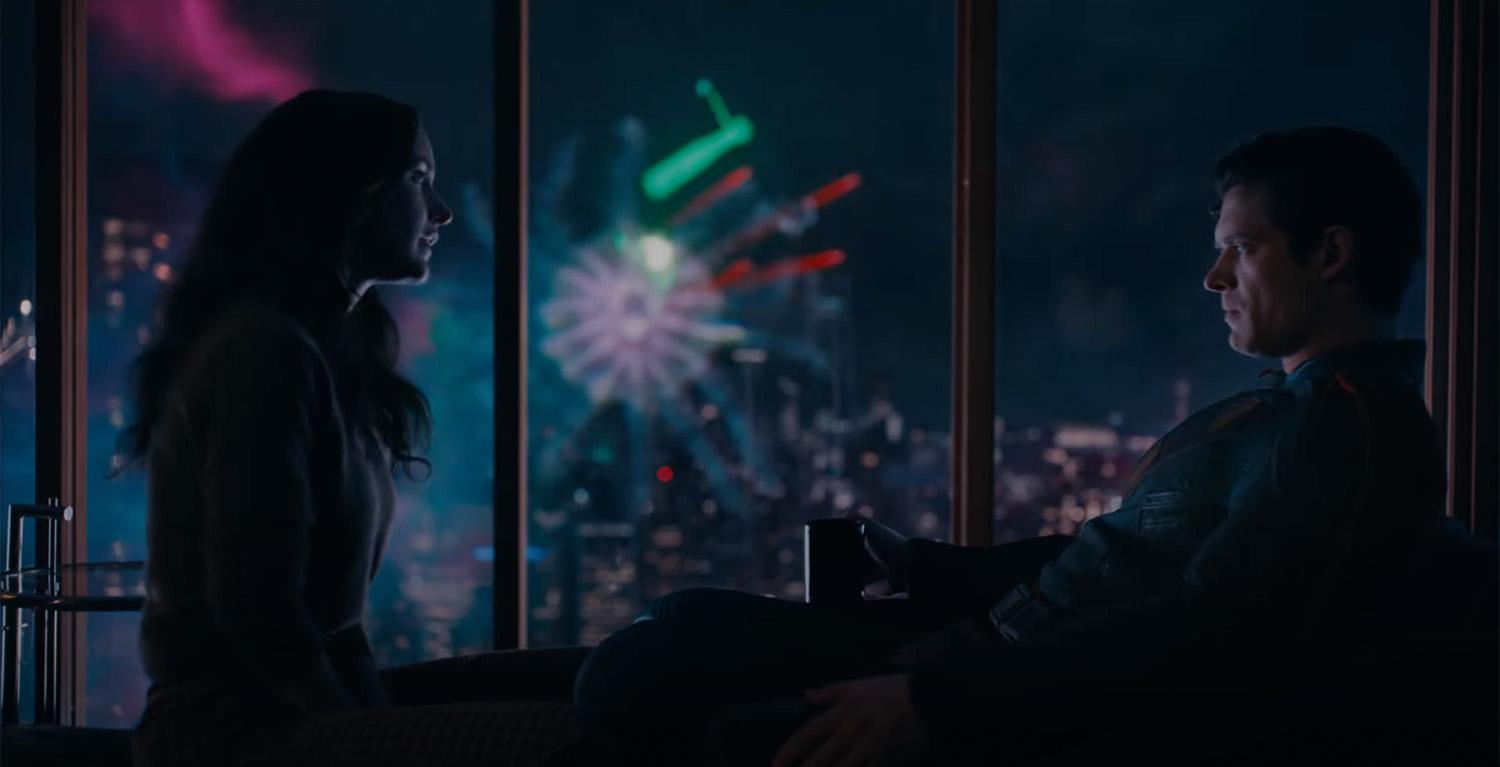
Emotion In Conflict (Marvel/DC: James Gunn’s Superman)

Lois & Clark are having a heartfelt, intimate conversation, a slow, human moment, while in the background a running gag plays out (a monster getting clobbered with a giant baseball bat). The gag steals the focus right when the scene asks you to feel something real. The result is a tonal clash that punctures the emotion instead of releasing it.

Why does this fail on screen?

  • Increased cognitive load.
    What’s happening here maps directly to cognitive load theory. When a scene (or interface) asks users to process two competing emotional signals at once, it introduces extraneous cognitive load, mental effort that has nothing to do with the task or moment itself. Instead of focusing on the emotional beat, attention is split between signals that don’t resolve each other. In products, this is what happens when humor, promotions, or unexpected UI changes intrude on high-stakes moments: users are forced to interpret tone and intent at the same time they’re trying to act, which slows comprehension and increases stress.
  • Competing beats at the same time.
    The joke overlaps the climax of a serious beat; the audience pays attention to the switch rather than the feeling.
  • No tonal handoff.
    There’s no transition that lands the intimacy before humor arrives, so the moment feels undercut rather than resolved.

How does this translate to UX?

In products, this is the confetti-before-confirmation problem, the cheeky error in a money flow, or the promo modal that appears right in the middle of a critical task. This also spikes cognitive load: users must process the humor while trying to fix a problem, which slows them down and increases stress.

Quick Definitions

Emotion in Flow
Emotional shifts feel earned, telegraphed, and timed so they resolve prior beats. Immersion holds.

Emotion in Conflict
A jarring switch (or hard cut) that punctures a live emotional beat. Immersion breaks.

Now that we’ve named it: how does this connect to UX?

How Emotions Shape Product Memorability

People don’t remember the average of an experience; they remember peaks and the ending. If your flow’s peak is frustration, or your ending is messy, that’s what sticks. So design the emotional curve on purpose.

Emotions live across three layers (from Don Norman’s Emotional Design), and your product needs to line them up:

  • Visceral (gut): First-impression signals: visuals, motion, haptics, sound.
    Examples: A steady skeleton loader calms more than a jittery spinner; a gentle success chime/haptic tap lets the win land without shouting; consistent easing/direction tells the eye what changed.
  • Behavioral (doing): Can I complete my task smoothly? Friction here means stress.
    Examples: Three clear payment steps with predictable progress; error states that explain what happened and how to recover; inline validation instead of end-of-form explosions.
  • Reflective (meaning): The story I tell myself after, “Was that worth it? Do I trust this?”
    Examples: A tidy wrap-up screen (“Done. You’ll get X by Friday.”) gives closure; a small recap (“You saved €18 this year”) creates pride without fireworks.

Microinteractions are the emotional glue. Each one has a trigger (I tap Pay), rules (what the system does), feedback (progress and a clear result), and loops or modes (what happens if the user tries again). Get these right, and your transitions bridge feelings. Get them wrong, and they break the flow.

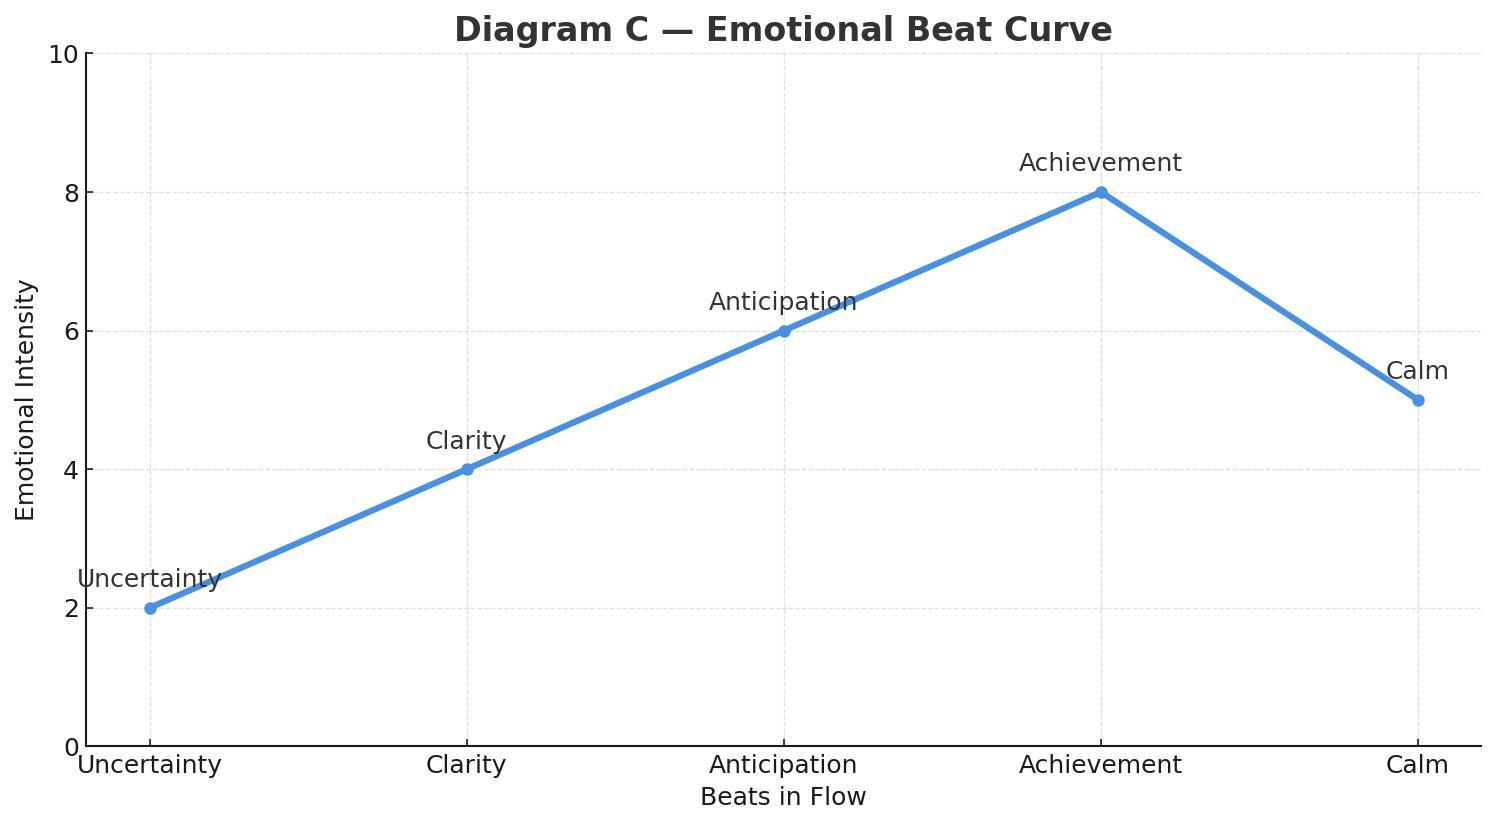
The emotional beat sheet maps cleanly onto Norman’s layers of experience:

  • Uncertainty lives in the visceral and early behavioral layers, where users rely on sensory cues (motion, clarity, feedback) to understand what’s happening.
  • Clarity is firmly in the behavioral layer, the moment when the system’s intent and the user’s next action lock into place.
  • Anticipation is a blend of behavioral (the user is doing something with purpose) and reflective (the user is already predicting the outcome and imagining what comes next).
  • Achievement is a reflective peak, where the user evaluates success, trust, and whether the experience “felt right.”
  • Calm/Closure is primarily reflective, helping users wrap up the meaning of the interaction and decide if the product is trustworthy and worth returning to.

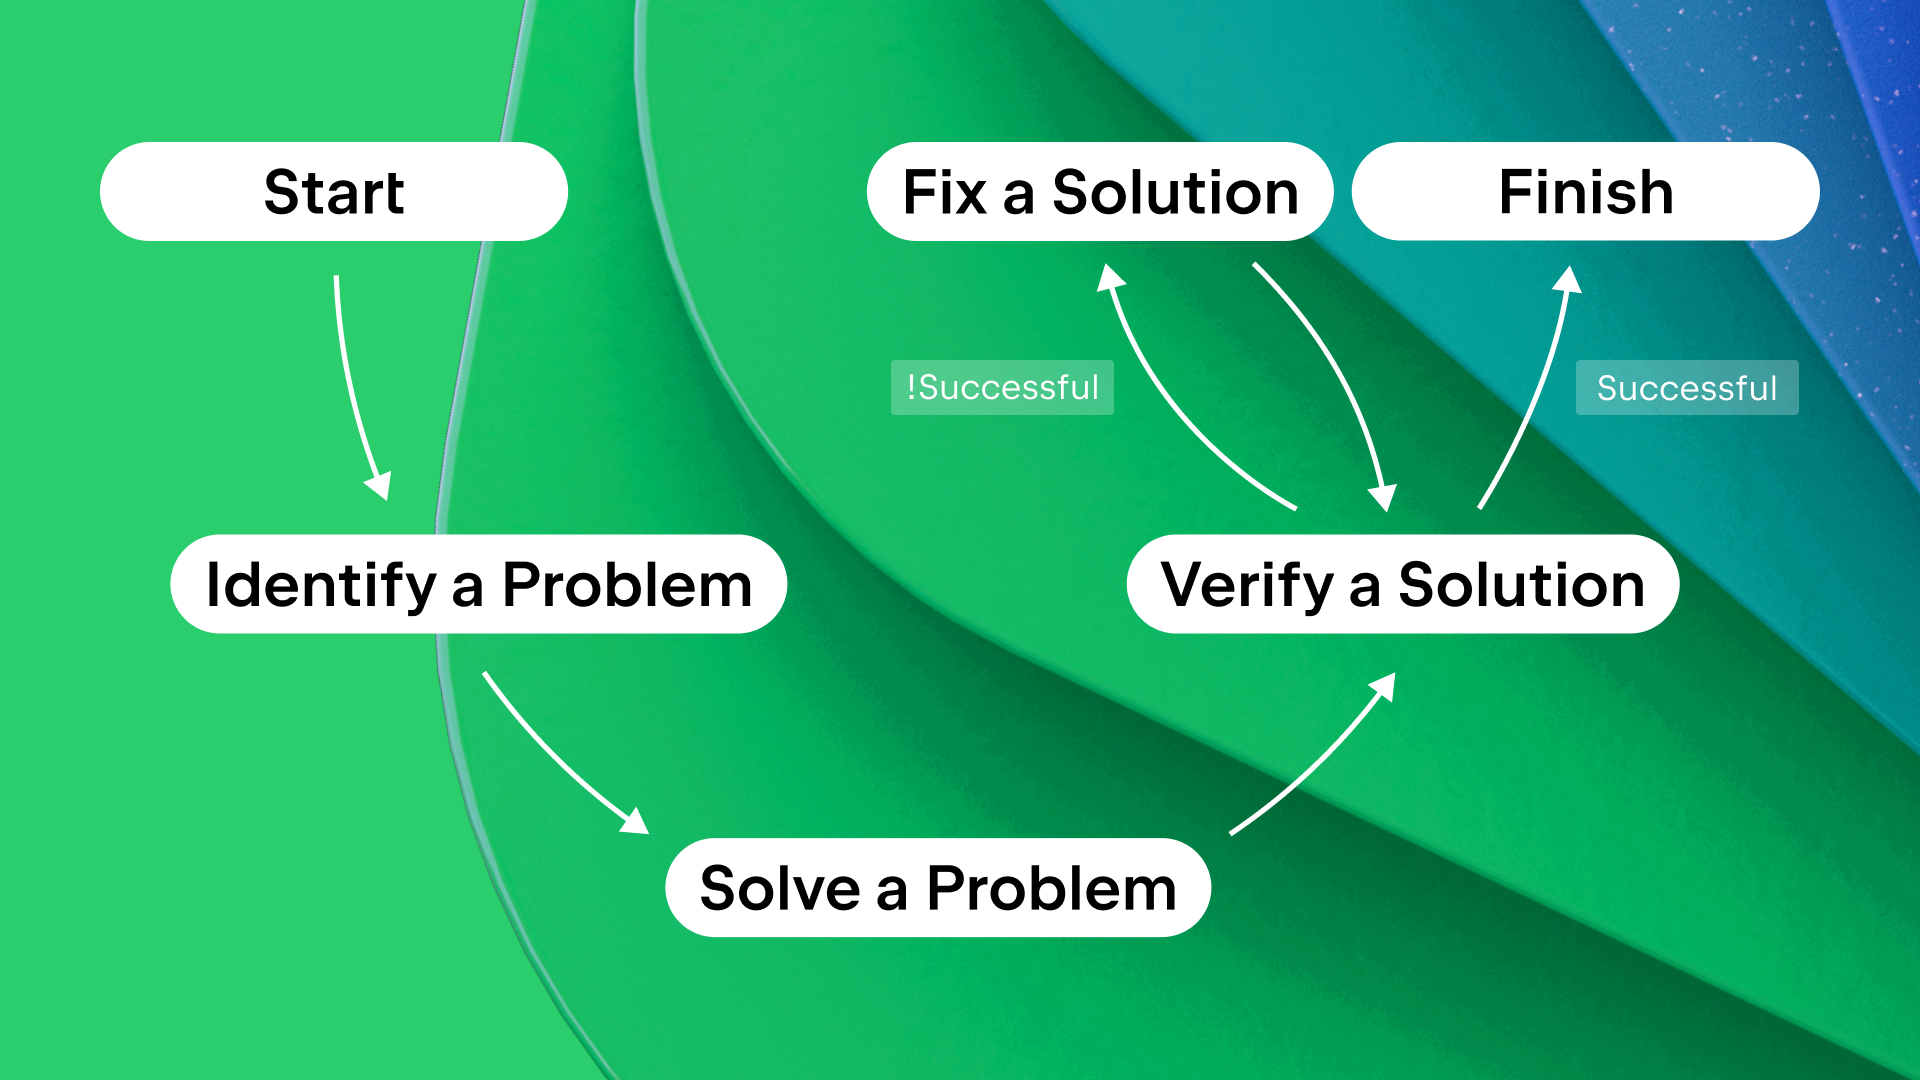
In real products, this sequence doesn’t disappear when things go wrong. Errors, latency, and degraded states are not exceptions to the emotional arc — they are part of it. Seen through a narrative lens, these moments are the obstacles in the hero’s journey. A well-designed recovery state acknowledges the setback, clarifies what happened, and guides the next step without introducing new emotional noise. When failure is treated as a beat instead of a rupture, emotional flow can be preserved even under stress.

UX Examples: Emotion In Flow vs. Emotion In Conflict

Emotion In Flow

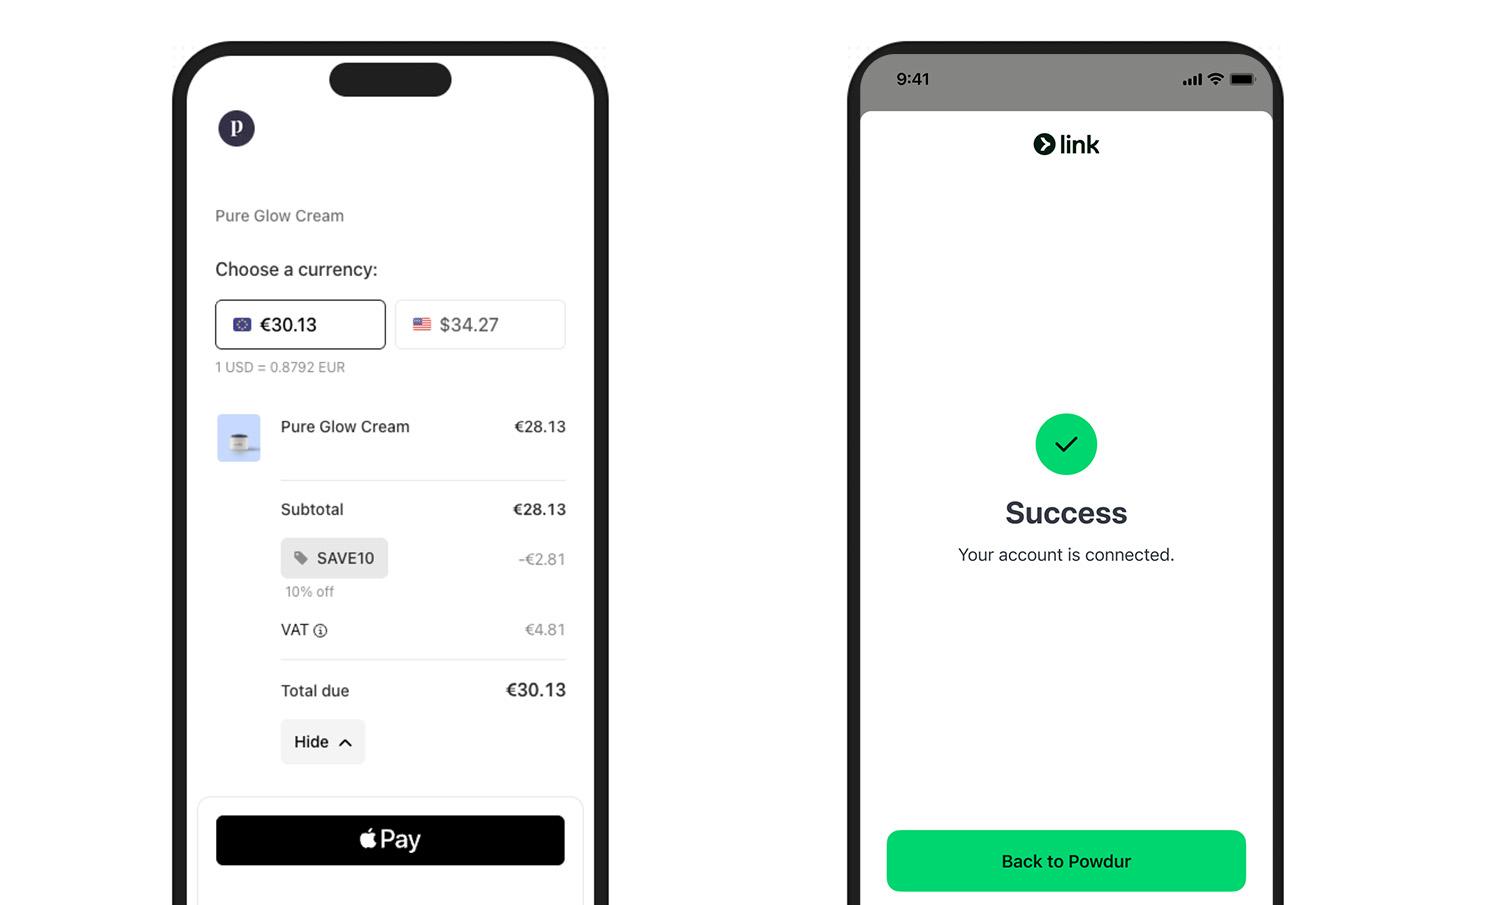
Checkout done right (Stripe/Apple Pay style): short steps, clear progress, and a crisp success state (a checkmark with an optional soft haptic). The peak (success) lands, and the end gives closure (receipt or next step).

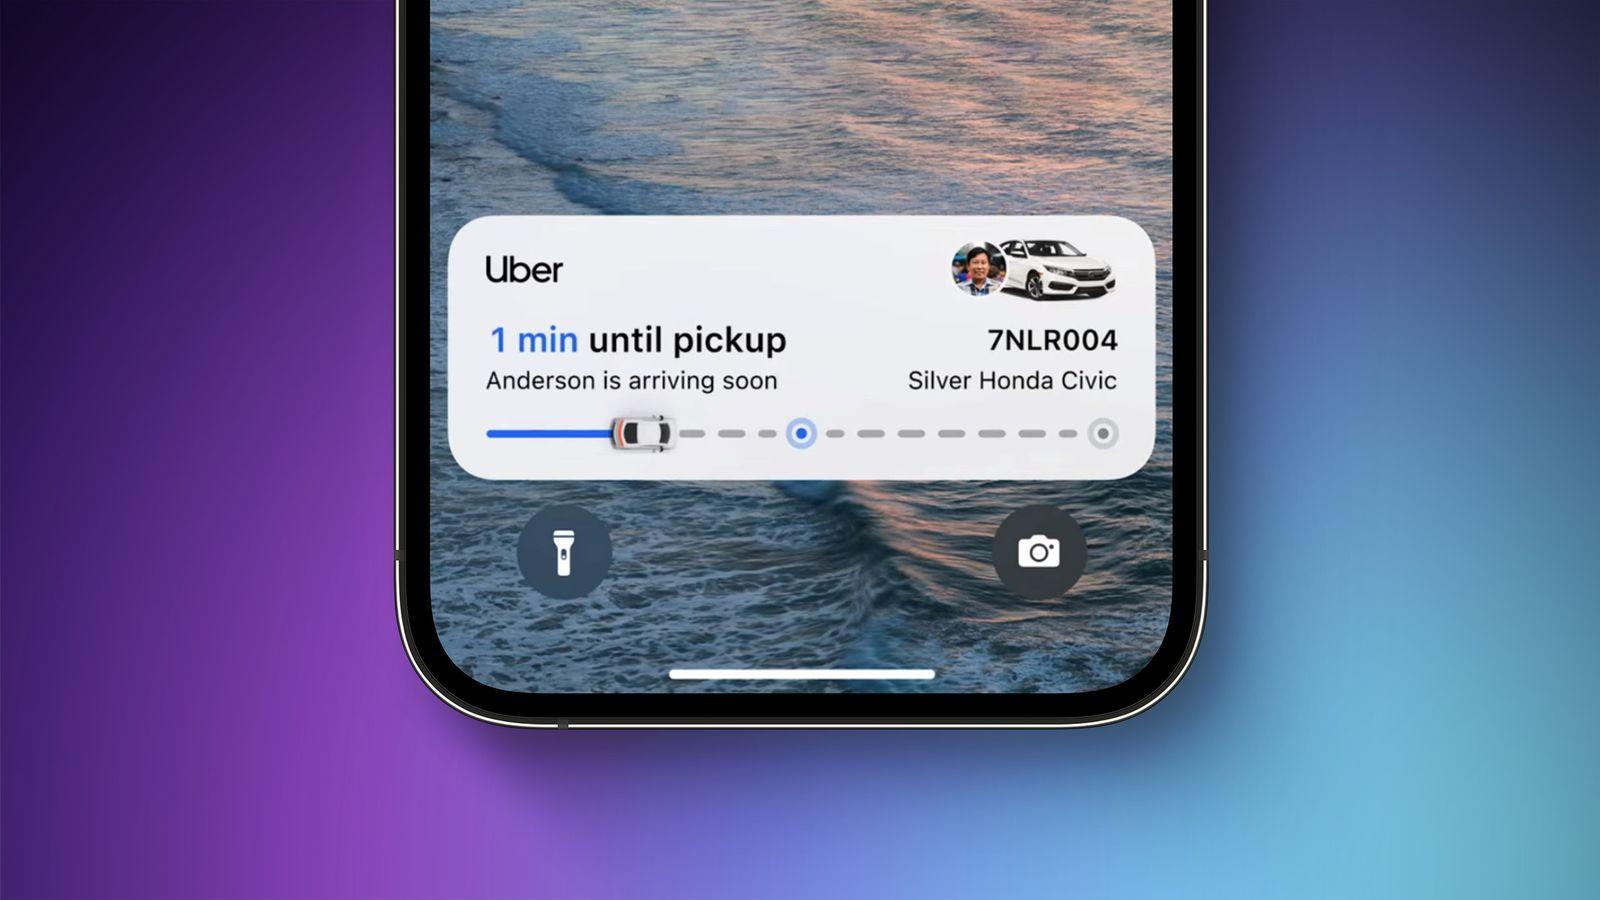
Pickup status (ride‑hailing apps, e.g., Uber, Free Now, or Bolt): progressive updates maintain orientation and reduce anxiety (“Driver arriving”, “2 min away”, “Arrived”). Uncertainty turns into clarity, with gentle motion preparing each transition.

Emotion In Conflict

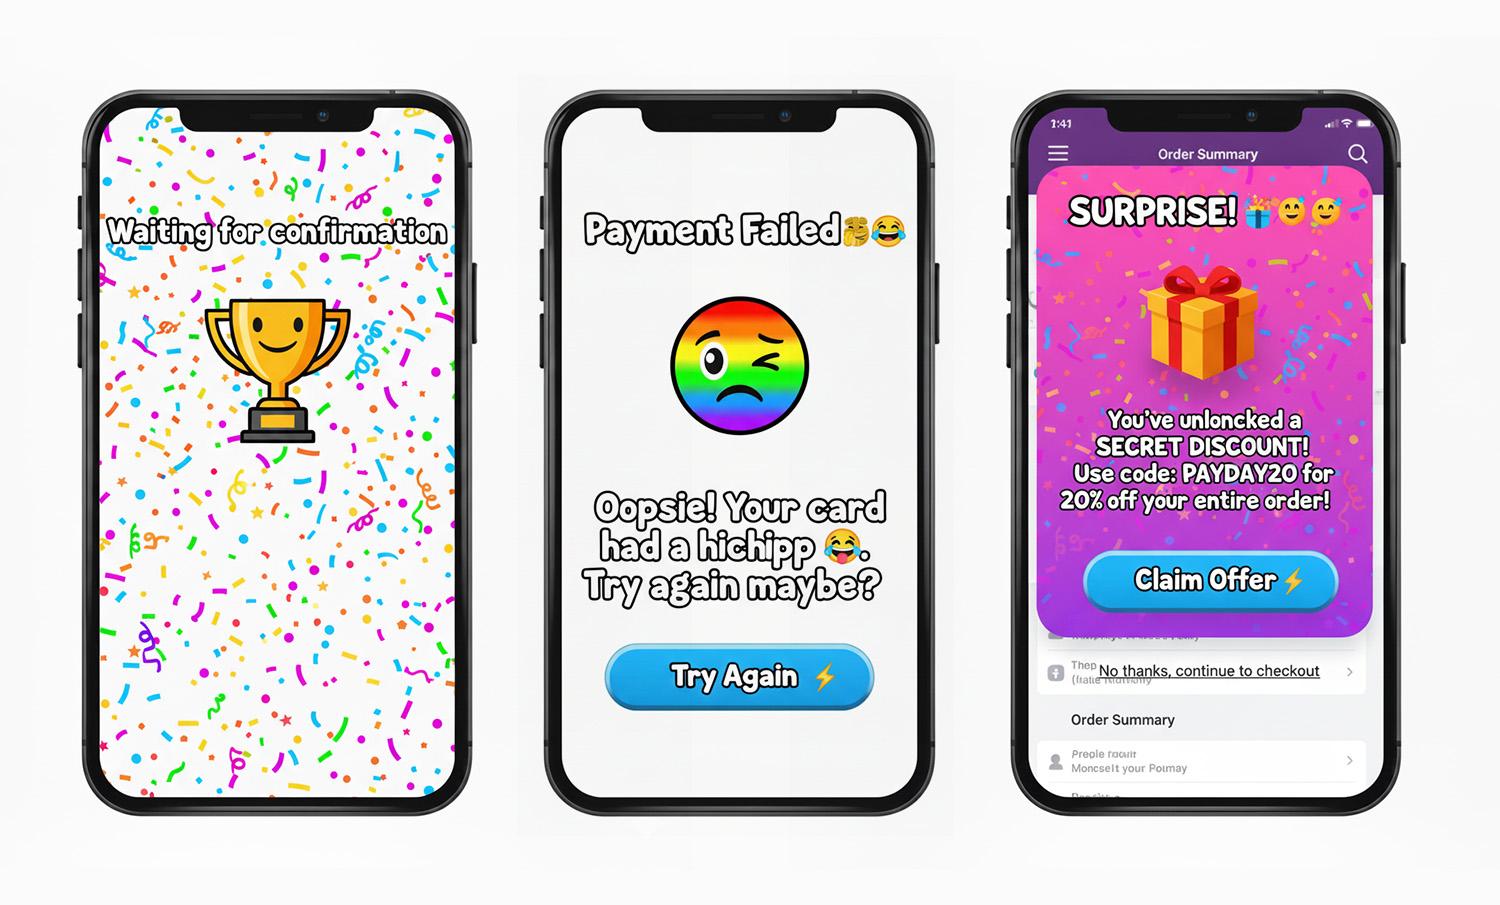
Note: We’re not naming specific products here — we respect the work behind them. Instead, we’re showing the patterns that cause emotional conflict and exactly how to fix them.

  • Jokes in serious moments.
    Cheeky copy-in-error states for money/health/security. Users are stressed; humor amplifies irritation.
  • Celebration before resolution.
    Confetti, fireworks, or loud sounds before confirmation. The party interrupts the climax.
  • Hard state jumps.
    Surprise modals/promos mid‑task, full‑screen takeovers without preparation. Feels like an abrupt cut during an emotional beat.

What You Can Do To Ensure Emotion in Flow

Here’s a Notion page with the full template you can duplicate:

  • Emotional beat sheet template.

1. Write The Emotional Beat Sheet First

For each core flow (onboarding, payment, recovery), map the feelings per step: uncertainty → clarity → anticipation → achievement → calm. Attach copy, motion, and microinteractions to each beat. (Who carries the emotion where?)

2. Align Tone With Task Risk

Create a tone matrix (risk level × state). In high‑risk errors, be calm, plain, and solution‑oriented. Save playfulness for low‑risk contexts.

Template snippets:

  • High‑risk error: “We couldn’t verify your ID. Try again or contact support.”
  • Low‑risk empty state: “Nothing here yet. Want to start with a sample?”

This is where many mature products quietly drift into emotional conflict. Over time, teams add delight by habit rather than intent.

A useful self-check is to ask: If we removed every playful or celebratory element from this step, would the flow still feel humane — or were those elements masking friction?

Good emotional design clarifies experience; great emotional design doesn’t need decoration to compensate for confusion.

3. Design Peak And End On Purpose

Engineer one clear peak (the moment of success) and one clean end (confirmation and what happens next). Measure recall and satisfaction at both points.

4. Use Microinteractions As Bridges, Not Spotlights

  • Prepare: Small, consistent motion hints before a big state change.
  • Confirm: Success gets a subtle settle, with a slightly slower ease-out and an optional light haptic.
  • Recover: Repeated failure gracefully shifts tone from upbeat to supportive and guides the next step.

5. Test For Emotional Continuity

In usability sessions, don’t just ask “Was that easy?” Instead, you can ask “What feeling changed here?” If you hear “confused → amused → confused,” you’ve got conflict, not flow. Iterate transitions, not just screens.

How To Avoid Emotion in Conflict: Fast Checklist

Red flags → fixes:

  • Jokes in serious moments → swap for calm, direct language, and a clear recovery path.
  • Celebration before resolution → move celebration to after confirmation; tone it down for high‑risk tasks.
  • Hard state jumps → pre‑announce transitions; keep framing consistent; use meaningful motion to preserve continuity.
  • Cross‑team tone drift → centralize voice & tone guidelines with examples per risk level and state.

There are moments when breaking emotional flow is intentional and necessary. Security warnings, legal confirmations, and safety-critical alerts often benefit from abrupt tonal shifts. In these cases, disruption signals importance and demands attention. The problem isn’t emotional conflict itself; it’s accidental conflict. When designers choose disruption deliberately, users understand the stakes instead of feeling whiplash.

Conclusion

Great experiences are directed experiences. Dan da Dan shows how to move through feelings without losing us: it prepares, transitions, and resolves. The Superman scene shows the opposite: a gag colliding with a heartfelt beat.

Do the former. Map your emotional beats, align tone to task risk, and let microinteractions bridge feelings so users remember the right peak and the right end, not the whiplash in the middle.

Your Python API Calls Will Fail. Here’s How to Handle It.

Every HTTP call you make to a third-party API will eventually fail. The endpoint will time out. The service will rate-limit you. The server will return a 503 for twelve minutes on a Tuesday afternoon.

Most Python codebases handle this with a bare try/except and a hope. That works until it doesn’t — and when it doesn’t, you get cascading failures, silent data loss, and a service that goes down without telling you why.

I built APIGuard to fix this. It’s a small Python library (905 lines of source) that gives you three production resilience patterns — without pulling in a heavy framework.

The Three Patterns

1. Token Bucket Rate Limiting

Rate limits are contracts. Break them and the API cuts you off. A token bucket enforces the contract on your side before you hit the remote server.

from apiguard import TokenBucket

# 100 requests allowed, refills at 10/second
bucket = TokenBucket(capacity=100, refill_rate=10.0)

if bucket.acquire(tokens=1):
    response = httpx.get("https://api.example.com/data")
else:
    # Back off — you're at the limit
    pass

The implementation uses time.monotonic() for sub-second precision and is thread-safe. No background threads, no timers — just math.

2. Circuit Breaker

A circuit breaker tracks failures. After enough consecutive failures, it stops sending requests entirely — “opening” the circuit. This prevents your app from hammering a dead service and wasting resources (yours and theirs).

It follows a three-state machine: CLOSED (normal) → OPEN (blocking requests) → HALF_OPEN (testing recovery) → back to CLOSED.

from apiguard import CircuitBreaker, CircuitOpenError

breaker = CircuitBreaker(
    failure_threshold=5,     # Open after 5 failures
    recovery_timeout=60.0,   # Try again after 60 seconds
    success_threshold=2      # Need 2 successes to fully close
)

try:
    with breaker:
        result = call_external_api()
except CircuitOpenError:
    # Circuit is open — don't even try
    return cached_fallback()

The key detail: the success_threshold in HALF_OPEN state. One lucky success doesn’t mean the service is back. You need consecutive successes before the breaker fully closes again.

3. Retry with Exponential Backoff

Retry sounds simple. It isn’t. Naive retry (same delay, unlimited attempts) turns your client into a DDoS tool. Exponential backoff with jitter spreads retry load and respects Retry-After headers.

from apiguard import RetryHandler

handler = RetryHandler(
    max_retries=3,
    base_delay=1.0,
    jitter=0.5,                              # Randomize delay by up to 50%
    retryable_status_codes={429, 500, 502, 503, 504}
)

async for attempt in handler:
    response = await client.get("/endpoint")
    if response.status_code not in handler.retryable_status_codes:
        break
    await handler.wait(attempt, response)    # Respects Retry-After header

The delay formula: base_delay * 2^(attempt - 1) * (1 + random * jitter). Third attempt at base_delay=1.0 waits ~4 seconds plus jitter. This is what RFC 7231 recommends.

Composing All Three

The patterns work independently, but the real value is composition. APIGuard ships a client that wires all three together:

from apiguard.adapters.httpx import AsyncRateLimitedClient

async with AsyncRateLimitedClient(
    capacity=50,          # 50 requests in the bucket
    refill_rate=5.0,      # Refill at 5/second
    max_retries=3,
    failure_threshold=5,
    recovery_timeout=30.0
) as client:
    response = await client.get("https://api.stripe.com/v1/charges")

One client. Rate limiting, retry, and circuit breaking. The request either succeeds, retries intelligently, or fails fast with a clear error. No silent failures.

Real Integration: Replacing 623 Lines

I built APIGuard while working on GRID, a 190k-line Python AI framework. GRID had a custom circuit breaker implementation — 623 lines of hand-rolled state management, no rate limiting, no retry coordination.

After integrating APIGuard, that 623-line file became a 40-line adapter:

# GRID's FastAPI middleware using APIGuard
from apiguard import CircuitBreaker, BucketRegistry

class APIGuardCircuitBreakerMiddleware:
    def __init__(self, app, failure_threshold=5, recovery_timeout=60.0):
        self.app = app
        self.breaker = CircuitBreaker(
            failure_threshold=failure_threshold,
            recovery_timeout=recovery_timeout
        )

    async def __call__(self, scope, receive, send):
        with self.breaker:
            await self.app(scope, receive, send)

Same behavior. Fewer lines. Tested independently (106 tests, 100% coverage) instead of tangled into the framework.

What I Learned Building It

Thread safety matters even in async code. The token bucket and circuit breaker both use locks. In production, you’ll have concurrent requests from multiple coroutines hitting the same bucket. Without locks, you get race conditions that silently over-consume your rate limit.

Jitter is not optional. Without jitter, all your retries fire at the same time (the “thundering herd” problem). Even 0.3 jitter factor spreads the load enough to matter.

Retry-After headers are a gift. Most rate-limited APIs tell you exactly when to come back. Ignoring this header and using your own backoff schedule means you’ll either wait too long or retry too soon. APIGuard checks for it on every retry.

Keep the dependency surface small. APIGuard’s only runtime dependency is httpx. No framework opinions, no configuration files, no dependency tree. pip install grid-apiguard and you’re done.

The Numbers

Metric Value
Source lines 905
Test functions 106
Test coverage 100%
Core patterns 3
Runtime dependencies 1 (httpx)
Python versions 3.11, 3.12, 3.13
License MIT

When You Should Use This

  • You call third-party APIs and don’t have resilience patterns in place
  • Your retry logic is a while True loop with time.sleep(1)
  • You’ve been rate-limited and your solution was “catch the 429 and retry”
  • You want circuit breaking without importing a framework

When You Shouldn’t

  • You’re already using Tenacity or Stamina and they work fine
  • Your API calls are internal, low-latency, and rarely fail
  • You need distributed circuit breaking across multiple instances (APIGuard is single-process)

APIGuard is on PyPI: pip install grid-apiguard

Source is available on request. Built solo, tested end-to-end, used in production in a 190k-line framework.

If you need API integrations built with this level of failure handling, I do this work professionally — Upwork profile.

SmarterCSV 1.16 Released — Faster Than CSV.read, Bad Row Quarantine, Instrumentation, New Features, Improved API

Coffee time ☕ — this one’s a long read. But if you’ve ever had silent data import bugs ruin your day, it’s worth it.

New to SmarterCSV? Start here first:

  • 10 Ways Ruby’s CSV.read Can Silently Corrupt or Lose Your Data
  • Switch from Ruby CSV to SmarterCSV in 5 Minutes

SmarterCSV 1.16 is out — it brings major performance gains, new bad-row quarantine system, instrumentation hooks, significantly expanded API, new features.

gem 'smarter_csv', '~> 1.16'

Performance: 1.8×–8.6× Faster Than CSV.read

The headline number that usually surprises people: SmarterCSV 1.16 returns fully processed symbol-keyed hashes with numeric conversion — and still beats CSV.read (which returns raw string arrays with no post-processing at all):

Comparison Speedup
vs CSV.read (raw arrays) 1.8×–8.6× faster
vs CSV.table (symbol keys + numeric conversion)¹ 7×–129× faster
vs SmarterCSV 1.15.2 up to 2.4× faster
vs SmarterCSV 1.14.4 9×–65× faster

Measured on 19 benchmark files, Apple M1 Pro, Ruby 3.4.7. The 129× figure is on a 117-column import file where CSV.table‘s overhead compounds with column count.

¹ The comparison against CSV.table is more apples-to-apples: both produce symbol-keyed hashes with numeric conversion. That’s what you actually need in a Rails app — but CSV.table has bugs, including silently mis-handling numbers with leading-zero. See 10 Ways Ruby’s CSV.read Can Silently Corrupt or Lose Your Data.

What drove these gains

The C extension was overhauled to minimize allocations and per-row overhead in the inner parsing loop. The pure-Ruby path was also improved to build result hashes more directly, with key options cached upfront instead of re-read on every row.

Column selection speedup

When using headers: { only: [...] } to keep a subset of columns, excluded columns are skipped entirely in the C hot path. This is most significant when the columns you need are towards the front of the file. If the columns you want are near the end, the parser still has to read through all the preceding columns before it can skip anything — so the gains will be smaller.

Columns kept Speedup vs no selection
2 of 500 ~16× faster
10 of 500 ~8× faster
50 of 500 ~3× faster
# Only extract the 3 columns you need from a 500-column file
rows = SmarterCSV.process('wide_export.csv',
  headers: { only: [:id, :name, :email] })

Instrumentation Hooks

SmarterCSV.process('large_import.csv',
  chunk_size: 1000,
  on_start: ->(info) {
    puts "Starting import of #{info[:file_size]} bytes"
  },
  on_chunk: ->(info) {
    puts "Chunk #{info[:chunk_number]}: #{info[:total_rows_so_far]} rows so far"
  },
  on_complete: ->(info) {
    puts "Done: #{info[:total_rows]} rows in #{info[:duration].round(2)}s"
    puts "Bad rows: #{info[:bad_rows]}"
  }
)

Expanded Read API

SmarterCSV.parse — parse strings directly

# Before — had to wrap in StringIO
reader = SmarterCSV::Reader.new(StringIO.new(csv_string))

# Now
rows = SmarterCSV.parse(csv_string)

Drop-in equivalent of CSV.parse(str, headers: true, header_converters: :symbol) — with numeric conversion included.

SmarterCSV.each / Reader#each — row-by-row enumerator

Reader now includes Enumerable:

# Lazy pipeline — process a 10M-row file with constant memory
SmarterCSV.each('huge.csv')
  .lazy
  .select { |row| row[:status] == 'active' }
  .first(100)
  .each { |row| MyModel.create!(row) }

SmarterCSV.each_chunk / Reader#each_chunk

SmarterCSV.each_chunk('data.csv', chunk_size: 500).each_with_index do |chunk, i|
  puts "Importing chunk #{i}..."
  MyModel.import(chunk)
end

Bad Row Quarantine

Real-world CSV files are malformed. Until now, SmarterCSV raised on the first bad row and stopped — all-or-nothing. 1.16 adds a full quarantine system.

on_bad_row:

# :raise (default) — fail fast, same as before
SmarterCSV.process('data.csv')

# :collect — continue and keep the error records
good_rows = SmarterCSV.process('data.csv', on_bad_row: :collect)
SmarterCSV.errors[:bad_rows].each do |rec|
  Rails.logger.warn "Bad row #{rec[:csv_line_number]}: #{rec[:error_message]}"
  Rails.logger.warn "Raw: #{rec[:raw_logical_line]}"
end

# callable — inline handling, no Reader instance needed
bad_rows = []
good_rows = SmarterCSV.process('data.csv',
  on_bad_row: ->(rec) { bad_rows << rec })

# :skip — continue, count available afterwards
SmarterCSV.process('data.csv', on_bad_row: :skip)
puts SmarterCSV.errors[:bad_row_count]   # => 3

Each error record contains:

{
  csv_line_number:     3,
  file_line_number:    3,
  file_lines_consumed: 1,
  error_class:         SmarterCSV::HeaderSizeMismatch,
  error_message:       "extra columns detected ...",
  raw_logical_line:    "Jane,25,Boston,EXTRA_DATAn",
}

SmarterCSV.errors — class-level error access (1.16.1)

Previously, accessing bad_row_count after a class-level call required switching to SmarterCSV::Reader. 1.16.1 exposes errors directly:

SmarterCSV.process('data.csv', on_bad_row: :skip)
puts SmarterCSV.errors[:bad_row_count]   # => 3

SmarterCSV.process('data.csv', on_bad_row: :collect)
puts SmarterCSV.errors[:bad_rows].size   # => 3

SmarterCSV.errors is thread-local — each thread in Puma/Sidekiq tracks its own state independently. It stores the result of the most recent call on the current thread.

⚠️ Fibers: SmarterCSV.errors uses Thread.current, which is shared across all fibers
in the same thread. If you process CSV in fibers (Async, Falcon, manual Fiber
scheduling), use SmarterCSV::Reader directly — its errors are scoped to the instance.

field_size_limit: — DoS protection

One unclosed " in a large file causes Ruby’s CSV to read the entire rest of the file into a single field — a silent OOM risk. field_size_limit: N raises FieldSizeLimitExceeded as soon as any field or accumulating multiline buffer exceeds N bytes:

SmarterCSV.process('uploads/user_data.csv',
  field_size_limit: 1_000_000,   # 1 MB per field
  on_bad_row: :collect)

bad_row_limit: — abort after too many failures

reader = SmarterCSV::Reader.new('data.csv',
  on_bad_row: :collect,
  bad_row_limit: 10)

begin
  result = reader.process
rescue SmarterCSV::TooManyBadRows => e
  puts "Aborting: #{e.message}"
  puts "Collected so far: #{reader.errors[:bad_rows].size}"
end

Other new options

  • collect_raw_lines: true (default): Include the raw stitched line in bad-row error records. Set to false for privacy or memory savings.
  • nil_values_matching: regex: Set fields matching the regex to nil. With remove_empty_values: true (default), nil-ified values are removed from the hash. Replaces the deprecated remove_values_matching:.
  • verbose: :quiet / :normal / :debug: Symbol-based verbosity. :quiet suppresses all output; :normal (default) shows behavioral warnings; :debug adds per-row diagnostics to $stderr. Replaces the deprecated verbose: true/false.

Quote Handling Improvements

quote_boundary: :standard (default — minor breaking change)

Previously, a quote character mid-field (e.g. 5'10" or O'Brien) could toggle quoted mode and silently corrupt the row. The new default :standard mode only recognizes quotes as field delimiters at field boundaries — RFC 4180 compliant behavior.

In practice, mid-field quotes were already producing silent corruption in 1.15.x, so this is a bug fix that looks like a breaking change. Use quote_boundary: :legacy only if you deliberately relied on the old behavior.

quote_escaping: :auto (default)

MySQL SELECT INTO OUTFILE, PostgreSQL COPY TO, and many Unix tools escape quotes as " instead of "" (RFC 4180). :auto mode handles both conventions row-by-row without configuration:

# Both of these parse correctly with the default quote_escaping: :auto
rows = SmarterCSV.process('mysql_export.csv')    # uses "
rows = SmarterCSV.process('excel_export.csv')    # uses ""

Writer Improvements

IO and StringIO support

# Write to any IO object
SmarterCSV.generate($stdout) do |csv|
  csv << {name: "Alice", age: 30}
end

# Write to a StringIO buffer
buffer = StringIO.new
SmarterCSV.generate(buffer) do |csv|
  csv << {name: "Alice", age: 30}
end
csv_string = buffer.string

Generate to String directly

csv_string = SmarterCSV.generate do |csv|
  csv << {name: "Alice", age: 30}
  csv << {name: "Bob",   age: 25}
end

New writer options

SmarterCSV.generate('output.csv',
  encoding:          'ISO-8859-1',
  write_nil_value:   'NULL',
  write_empty_value: '',
  write_bom:         true,        # UTF-8 BOM for Excel compatibility
) do |csv|
  csv << row
end

Streaming mode

When headers: or map_headers: is provided at construction, the Writer skips the internal temp file entirely — the header line is written immediately and each << streams directly to the output. No API change; existing code benefits automatically.

Bug Fixes

1.16.0:

  • Empty/whitespace-only header cells now auto-generate names (column_1, column_2, …) instead of colliding on "" — fixes #324 and #312
  • Mid-field quotes no longer corrupt unquoted fields (quote_boundary: :standard)
  • All library output now goes to $stderr — nothing written to $stdout
  • Writer temp file no longer hardcoded to /tmp (fixes Windows)

1.16.1:

  • col_sep in quoted headers was parsed incorrectly — fixes #325 (thanks to Paho Lurie-Gregg)
  • Quoted numeric fields were not converted to numeric

Deprecations

These options still work but emit a warning — update when convenient:

Old New
remove_values_matching: nil_values_matching:
strict: true missing_headers: :raise
strict: false missing_headers: :auto
verbose: true verbose: :debug
verbose: false verbose: :normal

By the Numbers

1.15.1 → 1.16.1
RSpec tests 714 → 1,410 (+696)
Line coverage 100%
Benchmark files 19
New options 10
New exceptions 2

Further Reading

  • 10 Ways Ruby’s CSV.read Can Silently Corrupt or Lose Your Data — the silent failure modes that make switching worthwhile, with reproducible examples for each
  • Switch from Ruby CSV to SmarterCSV in 5 Minutes — a practical migration guide with before/after examples and a quick-reference options table

Links

  • GitHub: github.com/tilo/smarter_csv
  • Docs: Full documentation
  • RubyGems: rubygems.org/gems/smarter_csv
  • Full changelog: 1.16.0 · 1.16.1
  • Benchmarks: Full benchmark tables

Your Team Doesn’t Have a Jira Problem. It Has a Context Problem.

Scattered Context

I don’t think most teams are slowed down by lack of effort.

I think they’re slowed down because the context for the work is scattered.

The task is in Jira.
The decision is in a doc.
The code is on a branch.
The AI prompt that explains the reasoning is in chat history somewhere.

Everything exists.
But not in one place where the next person can actually use it.

So every handoff starts with reconstruction.

What were we trying to do?
Why did we make that tradeoff?
Which branch has the latest version?
Where did that decision happen?

I’ve been noticing this more and more as I work with AI.

At first I thought AI would reduce the need for documentation and coordination. Instead it made the problem easier to see.

If the context is stale, incomplete, or spread across five tools, the output drifts.

That is true for AI.
And it’s true for teams.

That’s the shared context problem.

The Problem Isn’t Just Missing Information

Most teams don’t actually have a shortage of information.

They have a shortage of shared, current, easy-to-find information.

That’s a different problem.

I’ve seen this over and over:

  • the story is technically written down, but the real reasoning lives in comments
  • the latest implementation details are only visible on a feature branch
  • the best explanation of the problem lives in an AI prompt that nobody else can see
  • a key decision was made in chat and never made it back into the work itself

So when someone else picks up the task, they have to reconstruct the thought process before they can move forward.

That reconstruction work is expensive. It slows down handoffs, reviews, onboarding, and AI-assisted development.

The Workarounds I’ve Seen

Most teams know this is a problem, so they try to patch around it.

Keep the context in the repo

This is usually the first instinct, and honestly, I think it’s directionally right.

Keeping context near the code is better than keeping it in a detached system no developer wants to live in all day.

But if the context lives in the main repo, another problem shows up fast:

Which branch has the latest version?

If the plan changed on a feature branch, the rest of the team has to know that branch exists. If multiple branches each have part of the story, then the source of truth depends on knowing where to look.

That works for one developer who remembers everything.
It breaks down for a team.

Keep the context in another repo

I’ve seen teams try this too.

The idea is clean: separate the context from the product repo so it doesn’t interfere with the codebase.

But now every meaningful context update becomes its own coordination problem.

You need context PRs.
You need someone to review them.
You need to wait for them to merge.

So instead of making context easier to maintain, you create a second workflow around maintaining the workflow.

That overhead adds up quickly.

Leave it spread across tools

This is where most teams end up by default.

A little in Jira.
A little in GitHub.
A little in Notion.
A little in Slack.
A little in AI prompts.

People can usually find enough to keep moving, but not without friction.

And friction compounds.

What AI Made Obvious to Me

Working with AI made this problem impossible for me to ignore.

When an AI assistant gets a bad prompt, incomplete files, or missing constraints, the result is usually disappointing. Not because the model is useless, but because the context is weak.

That reminded me of how humans work too.

We expect teammates to make good decisions with partial tickets, outdated notes, and disconnected artifacts. Then we’re surprised when they miss the intent.

AI didn’t create the shared context problem.
It just exposed it more clearly.

What I Actually Want

I want the context for the work to be:

  • close to the code
  • visible to the team
  • easy to update while working
  • available to AI
  • tied to the task, not floating in some disconnected place

In other words, I want the “why,” the “what,” and the supporting artifacts to travel with the work itself.

That’s the idea behind what I’ve been building with imdone.

How imdone Helps

imdone turns Jira and GitHub issues into a shared context repository next to the code.

That means the issue, comments, attachments, plans, and working notes can live in a local structure that developers can open in their editor and work with directly.

For me, that’s a much better model than treating Jira like a separate universe you visit in the browser.

It keeps context close at hand.
It makes it easier to update while the work is happening.
And it gives AI access to the same local context the team is using.

I’ve also been pairing that with hypothesis-driven workflows, where each story captures:

  • the outcome we’re trying to create
  • the hypothesis behind it
  • the success metrics
  • the design and plan
  • the demo path

That structure helps both humans and AI stay grounded in the same goal.

To me, that’s the real opportunity here.
Not just better issue management.
Better alignment.

Why This Matters

I don’t think most teams are blocked because they lack tools.

I think they’re blocked because too much of the reasoning around the work is fragmented.

When the context is shared and current:

  • handoffs are easier
  • reviews are faster
  • AI is more useful
  • product decisions stay connected to implementation
  • the team spends less time reconstructing and more time building

That’s a meaningful shift.

A Simple Test

If your team has ever asked:

  • “Which branch has the latest plan?”
  • “Where did we decide that?”
  • “Can you send me the prompt you used?”
  • “Why did we do it this way?”

…then you’re already feeling the shared context problem.

The question isn’t whether the context exists.

The question is whether the whole team, and your AI tools, can see the same current version of it without hunting for it.

If not, it’s probably time to change the workflow.

If you want to see how I’m approaching this, take a look at imdone.io.

License to Skill: Everything You Need to Take Your AI Agent Game to the Next Level

At Dryft, we build systems that replicate human decisions in industrial operations, through a combination of AI agents and mathematical optimization and simulation. Our agents analyze data and enterpise context to provide actionable recommendations, all in real-time conversations with domain experts.

All of our agents are built on Pydantic AI (We are big fans of Pydantic ). In this article we will use Pydantic AI as our point of reference for building agents, but the techniques and the concepts mentioned in the article should be applicable to any agentic framework.

The agents live under their own domain, as we follow Domain Driven Design (DDD). That means all core agent logic is implemented concretely in its own distinct domain, and not mixed with API routes, database models, or other concerns. This keeps the codebase clean and maintainable.

This post will explore some agent structuring patterns, from the simplest pattern to the most complex, along with the reasoning behind when to use each.

Table of Contents

  • Agent Anatomy

    • 1. Model & Settings
    • 2. Dependencies (Deps)
    • 3. System Prompt & Instructions
    • 4. Tools
    • 5. Output Type
  • Progressive Complexity

    • Level 1: Simple Structured Output
    • Level 2: Tools + Dynamic Context + Post-Processing
    • Level 3: Full Agentic Workflow with Streaming
  • Modular Prompts

    • XML Over Markdown in Prompts
    • Constants and Dynamic Sections
  • Internationalization for LLM Agents
  • Agents Reason, Tools Compute

    • Feature Flags
  • Streaming & Observability
  • Open Problems

    • Secure Code Execution by Agents
    • Dynamic Context
    • Testing Non-Deterministic Flows
  • Closing Thoughts

Agent Anatomy

Every agent we build is composed of at least these five building blocks. Understanding these makes it straightforward to go from “I need an agent that does X” to a working implementation.

Mermaid Diagram of Agent Anatomy

1. Model & Settings

We centralize model settings in a single config. Each model has predefined settings for temperature, max tokens, and (for reasoning models) reasoning effort level. These can of course be overridden at the agent level depending on the needs.

The LLM provider is defined in a single factory method, and we fully manage its lifecycle — we do a lot of heavy asynchronous workflows and we want our agents to be thread safe. The idea is to be able to experiment with other providers via a single line of code.

We distinguish between reasoning models (like gpt-5.4 or o3(old news)) which have a reasoning_effort parameter, and standard models (like gpt-4.1) which use traditional temperature control. Choose reasoning models for complex analysis and cheaper models for simpler tasks like matching or classification.

For a gentle introduction to temperature, max tokens, and LLM decoding we recommend the HuggingFace blog post. Reasoning effort is inspired by the concept of Chain-of-Thought prompting, which each LLM provider implements in their own way and describes in their docs.

2. Dependencies (Deps)

Every agent declares a dependency type — a dataclass or Pydantic model that gets injected into tools at runtime via Pydantic AI’s RunContext. Deps are the agent’s “working memory” across tool calls.

They range in complexity depending on what the agent needs to do:

  • Minimal: A simple dataclass with just basic identifiers for the agent to run (e.g., a classification agent)
  • Rich: A Pydantic model with computed fields and a factory method (e.g., an agent that pre-computes deltas so the LLM doesn’t have to do arithmetic)
  • Full: A dataclass with 30+ fields, different factory methods for hydration, and caching.

The key pattern: deps start sparse and get hydrated by tools**, if their hydration depends on LLM inference. For example, we don’t know which entity the user is asking about until we parse their prompt — so the first tool call resolves that, and subsequent tools reuse what’s already loaded. Other agents can hydrate their deps entirely upon initialization.

Caching the state of an agents deps and it’s interactions (what is usually referred to as “conversation”, is also a powerful pattern for multi-turn conversations. From a user perspective, it ensures that one can resume their tasks, without any delays. From a developers perspective, it provides an easy way to debug and analyze Agent interactions.

3. System Prompt & Instructions

There are two mechanisms for injecting prompts into the agent:

  • system_prompt: A static string set at construction time. Used when the prompt doesn’t need runtime data.
  • instructions: A list of callables that receive RunContext and return strings. Evaluated at runtime with full access to deps. This is the preferred pattern for dynamic prompts.

The reason we prefer instructions is that we can dynamically inject context into the prompt to keep relationships between data and instructions as close as possible. We found that this way the agent is much more likely to take the correct context into account, and it leads to more understandable instructions. (e.g instead of saying “Given the following data, do X”, we can say “Given that the efficiency_ratio is 0.65, which is below the acceptable threshold of 0.8, analyze the potential causes and recommend improvements”.). This also avoids the problem of having the context too far away from the instructions, which can lead to the LLM forgetting or ignoring it.

As Donald Hebb said, “Neurons that fire together wire together” — the closer the context and instructions are in the prompt, the more likely the LLM is to associate them correctly. This is also the main reason we use elaborate tool docstrings and Model Field descriptions, in both input and output Tool Fields.

4. Tools

Tools are async functions that do the heavy deterministic work and return Pydantic models. This is a core design principle: the agent decides what to do, the tools do the actual computation. Essentially we believe that the LLM works best as the magic glue that connects data and decisions, while deterministic tools should be responsible for doing the actual computations and the math.

A tool receives RunContext[DepsType] as its first argument (auto-injected by Pydantic AI). The function’s docstring and parameter annotations become the tool description the LLM sees.

Why Pydantic models as return types? By annotating return model fields with Field(description=...), the LLM gets self-documenting data. Each field carries its own explanation — what it means, its unit, its range. This is far more effective than returning raw dicts or strings, because the LLM can reason about the data accurately without needing extra prompt instructions, and it significantly reduces the chances of misinterpretation.

The second point that isn’t directly related to the LLM is that this leads to a much better developer experience. The more effort we put on better understandable data structures, the easier it is to keep our colleagues happy and productive.

For example, imagine a tool that returns a cost analysis model with fields like efficiency_ratio described as “Fraction of demand fulfilled on time (0.0 to 1.0)” and performance_breakdown described as “Detailed statistics including delays and demand type breakdown”. The LLM reads these descriptions and understands exactly what it’s looking at. That, along with data constraints (e.g., ge=0.0 and le=1.0) makes it much more likely the LLM will interpret the results correctly and make informed decisions.

Key conventions:

  • Tools can mutate deps to share state (e.g., caching fetched data for later tools).
  • Use ModelRetry to ask the LLM to correct its inputs and retry.
  • Return Pydantic models and in general structured self-documented models, not dictionaries or strings.
  • Let tools do the heavy lifting — simulations, calculations, comparisons, and business logic belong in deterministic tool code, not in LLM reasoning.

5. Output Type

Two output patterns:

  • str (default): Free-form text output. Used usually by conversational agents.
  • Pydantic BaseModel: Structured output validated by Pydantic AI. Used when you need typed, parseable results (e.g., an extraction agent returning a model with title, category, scope, adjustments). Pydantic has become the standard for structured LLM output in Python — even OpenAI’s own SDK uses Pydantic for structured outputs.

Progressive Complexity

Not every agent needs the full kitchen sink. We think about agent complexity in three levels, and we’ve found it helpful to start at Level 1 and graduate upward only when needed. We believe that the “art” of building AI agents is build on “less is more” — adding complexity only when absolutely necessary (You need to scrap half of your agent code and instructions to realise that first 😀 ).

Level 1: Simple Structured Output

The simplest pattern. The agent has:

  • No tools — the LLM processes input and returns structured data directly
  • Minimal deps — just a company identifier
  • Dynamic prompt — via a compilation system
  • Structured output — a Pydantic model

It’s invoked with agent.run() (no streaming needed) and returns a validated Pydantic object. This pattern works well for classification, extraction, and transformation tasks where the LLM doesn’t need external data.

Level 2: Tools + Dynamic Context + Post-Processing

Builds on Level 1 by adding tools, rich dynamic prompts, and output post-processing.

What’s new:

  • Tools that fetch and process domain data for the LLM to infer and decide upon.
  • Dynamic context injection: The system prompt is constructed at runtime by loading contextual data and interpolating it into the compiled base prompt. This means the prompt is finely curated for each particular task — minimal and on point — leading to better and faster solutions with lower costs. Only keep the absolutely necessary instructions for the LLM to solve the problem.
  • Output post-processing: After the LLM returns its result, a deterministic function applies business rules that can override the LLM’s reasoning when critical conditions are met. That balances arbitrary decisions powered by the LLM with more deterministic guardrails.
  • Richer deps: Computed fields and factory methods for construction. The reason we do that is to have the agent do as little calculation as possible and make the data interpretation seamless. Your deps could have a bunch of pre-calculated fields. Do not let the LLM do math.

Level 3: Full Agentic Workflow with Streaming

The full kitchen sink — multi-turn conversations, streaming, precomputed reasoning, company-specific tools.

What’s new:

  • Application-specific tool mapping: Different applications can get different tool implementations, all registered via a dynamic configuration pattern. Only keep the absolutely necessary tools for variants of the same Agent.
  • Tool renaming: Long function names can be aliased to shorter LLM-friendly names. This is a great pattern for keeping it simple for the LLM while also maintaining code clarity for your fellow developers. It can also be used for overloading tool variants.
  • Streaming entry point: An async generator that manages the full lifecycle: session creation, deps initialization, agent streaming, conversation persistence. The streaming is done via WebSockets, so users can see the LLM output, tool calls, and even the reasoning process live. Remember the last time you used any LLM application that didn’t have streaming? Thats how it feels.
  • i18n in the agent itself: Given the fact that we have customers all over the world, it is important to not leave internationalization an afterthought, everything we do is already internationalized — this has become especially easy with the use of LLMs.
  • Deps factory with caching: Deps are optionally hydrated from a cache to avoid re-fetching data in multi-turn conversations.

Modular Prompts

As your agent count grows, prompt management becomes a real challenge. You want to reuse common sections across agents, override specific parts per customer, and support multiple languages — without copy-pasting prompts everywhere.

The key insight is to treat prompts like code: break them into modular, composable sections. Pydantic AI gives you two mechanisms for this — static system_prompt and dynamic instructions. With instructions, you can build a compilation layer on top that resolves sections with fallback chains (config-specific → agent default → global) and handles language variants automatically.

XML Over Markdown in Prompts

We use XML tags heavily in our system prompts instead of markdown headers. XML provides clearer semantic boundaries that LLMs parse more reliably — especially for nested, structured instructions. This is also recommended by OpenAI in their GPT-5.2 prompting guide.

<mission>
  Analyze the given data and recommend optimal parameters:
  <parameters>
    <parameter name="threshold" type="int" min="0"/>
    <parameter name="buffer_size" type="int" min="0"/>
  </parameters>
</mission>
<actions>
  <general>Always run the analysis tool first to get an overview.</general>
  <evaluation_steps>
    Use the selected data point with its parameters and costs...
  </evaluation_steps>
</actions>

XML works particularly well for:

  • Structured data definitions — parameters, component descriptions, tool declarations
  • Nested instructions — actions containing sub-steps
  • Semantic boundaries — the LLM clearly sees where one section ends and another begins
  • Translation/terminology blocks

Constants and Dynamic Sections

Sections can support {CONSTANT_NAME} placeholders that are injected from a centralized constants dict. This keeps magic values out of prompt text, as then you may need to update them in five different places, but the one you missed.

Internationalization for LLM Agents

This is a topic we don’t see discussed enough. When your customers speak different languages and use different terminology, your agents need to handle that at two levels: prompt-level (the terminology the LLM uses in its reasoning) and runtime-level (labels in Code-generated output like tables and snippets).

The idea is to maintain a base translation set per language, let each customer override specific terms (because one company’s “delivery date” is another’s “ship date”), and dynamically inject the resolved terminology into the system prompt at compile time. The LLM then uses consistent, customer-specific vocabulary without any extra prompting effort per request.

Agents Reason, Tools Compute

A core principle we follow: agents reason, tools compute. The LLM decides what to do and interprets the results — the actual computation lives in deterministic tool code. This aligns well with Anthropic’s thinking on writing effective tools for agents. Pydantic AI’s ModelRetry pattern is also worth mentioning here — when a tool receives invalid input, it tells the LLM what went wrong so it can correct and retry, instead of failing hard.

Feature Flags

Every major feature or improvement we ship is behind a feature flag, and the code remains backwards compatible to the state before it. Once the feature is fully consolidated and has been proven in production, any superfluous code paths can be removed. This means that incomplete features may reach the main branch before they’re enabled, keeping merge conflicts and long-lived branches at bay. This has been a common practice in the software world, where for instance companies expose new features via experimental flags.

Streaming & Observability

We stream all agent output to the frontend via WebSockets — users see tokens appear in real time, tool calls execute live, and the whole experience feels conversational. Pydantic AI supports this out of the box with agent.run_stream().

For observability, we integrate with Langfuse via OpenTelemetry, giving us full traces of LLM calls, tool executions, token usage, and latency. When an agent makes a questionable recommendation, being able to trace back through its entire reasoning chain is invaluable for debugging and for building trust with domain experts.

Open Problems

These are topics that we feel are very relevant to us and to the broader future of AI-based solutions. They’re also the kind of problems that get us excited to come to work in the morning (or keep us awake at night 😅).

Secure Code Execution by Agents

Having agents generate and run arbitrary code can become a really powerful tool, but at the same time a security nightmare — it can literally be any code.

Pydantic’s Monty is a newly released library that solves this exact problem. It allows for low-latency, secure code execution designed for AI agents — essentially a sandboxed Python interpreter.

Dynamic Context

AI agents don’t operate in a vacuum. Planners bring domain expertise, they know their suppliers, their materials, their constraints. Our context engine is a dynamically adapting system that incorporates user-defined business rules and feedback directly into how agents reason.

When a planner rejects a suggestion or defines a new rule, the system evolves and adjusts, thus future optimizations reflect those decisions. How exactly we assemble, layer, and adapt that context across agents and companies is something we keep under the hood.

Testing Non-Deterministic Flows

LLMs do not generate deterministic outputs. This makes testing complex agent flows especially challenging, as the usual convention of assert a == b simply doesn’t apply anymore.

One approach we’ve experimented with is using a large enough sample of test cases combined with statistical metrics to assess whether the agent’s solutions are in line with verified target solutions. By maintaining a big enough test set to account for unexpected variability, we can measure the global deviation of agent outputs from known-good results.

But agents don’t only produce numeric results — they generate explanations, analyses, and recommendations in natural language. For these cases, ideas we’d like to experiment with include using evaluation agents that validate the alignment between generated and expected explanations, as it would usually be impossible to do it any other way if the generated text is longer than a sentence.

Some relevant tools and frameworks in this space:

  • DeepEval — open-source LLM evaluation with metrics like G-Eval and faithfulness scoring
  • Confident AI’s guide on agent evaluation — covers task success, tool usage quality, and reasoning coherence
  • Braintrust’s evaluation framework — practical patterns for testing multi-step agents

We would love to hear your ideas on this.

Closing Thoughts

These patterns have evolved through iterative development and experimentation. We continuously evolve and refine this structure via brainstorming, experimentation, and bridging gaps as they arise. The goal is to build a system for building agents that can handle a wide range of complexity while remaining maintainable, testable, and adaptable to new use cases.

This is still a field in its infancy, and along with the rapid LLM and tooling iterations, one can be a pioneer in defining how to best build agents that solve real-world problems, introducing workflows and solutions that were simply not possible less than two years ago. There is still a lot of room for innovation and improvement, especially in treating agents as first-class citizens with proper software engineering practices, testing methodologies, and design patterns, and not just another MVP.

PS: We are not sponsored by Pydantic, we simply love open source tools like the ones from Astral.

Java 26 in IntelliJ IDEA

The Java release cadence means we get a new Java version every six months. Java 26 was released on March 17, 2026. At JetBrains, we are committed to supporting the latest technologies in IntelliJ IDEA and adding useful enhancements for both stable and preview features. In this blog post, we will give you an overview of what Java 26 delivers and how it is supported in IntelliJ IDEA.

Java 26 delivers ten JEPs, of which five are final. There are no new stable language features in this release, but there are meaningful performance improvements and new library additions. In addition, several preview features continue to mature. 

We are also happy to share that a JetBrains colleague contributed a small but useful improvement to the Java platform.

Before diving in, let’s start by setting up IntelliJ IDEA to use Java 26.

Using Java 26 in IntelliJ IDEA (setup)

Java 26 support is available in IntelliJ IDEA.

To use Java 26, you will need to download the JDK. You can do so from inside IntelliJ IDEA or by using tools like SDKMAN! 

To download a JDK from IntelliJ IDEA, open the Project Structure, go to the tab Project Settings | Project, open the drop-down menu in the SDK field, and select Download JDK. In the Download JDK popup that opens, set Version to 26, and in the Vendor field, select the vendor you want to use.

Note that you can also download early access builds from inside IntelliJ IDEA. For example, Java 26 also introduced a new build of Project Valhalla, which is also available for download.

Download JDK 26 Valhalla Early Access

IntelliJ IDEA already has support for value classes from Project Valhalla, as demonstrated in the What’s New In IntelliJ IDEA 2025.3 video:

What’s New In IntelliJ IDEA 2025.3 – Java 26 Valhalla Early Access value type support

If you use SDKMAN! or asdf to manage your JDKs, IntelliJ IDEA can read the .sdkmanrc or .tool-versions file in your project and configure the JDK automatically when you open the file. For example, if you are using SDKMAN! and the JDK version specified in the .sdkmanrc file is not yet installed, an inlay hint will appear in the file, allowing you to download it directly from the IDE by running the relevant SDKMAN! command. 

Run sdk install java 26

If it is already installed but not yet configured for the project, there will be an inlay hint Set as project JDK. Click the inlay hint to set the mentioned JDK version for the project. Once set, there will be an inlay hint Project JDK (26). Click the link to open the Project Structure popup where the SDK is set.

Set project SDK using .sdkmanrc

Make sure to configure IntelliJ IDEA to use the right language level. To use Java 26 stable features, set Language level to 26 – No new language features. As mentioned, Java 26 introduces no new stable language features, hence this description.

Language Level: 26 – No new language features

To try out preview features, set Language level to 26 (Preview) – Primitive types in patterns (Fourth preview). Setting the right language level means that IntelliJ IDEA will show support for this language level in the editor, including inspections and quick-fixes. Usage of preview features will be highlighted as such, as you might not want to use preview features in production code yet.

Language Level: 26 (Preview) – Primitive types in patterns (Fourth preview)

When you set the language level to Java 26 (either stable or preview), IntelliJ IDEA will show you all relevant inspections. To see which inspections were added in the last version of IntelliJ IDEA, open Settings | Editor | Inspections, click on the Filter Inspections button, and select Show New Inspections in IDEA 2026.1.

New Inspections in IDEA 2026.1

A full list of inspections is available on Inspectopedia. In upcoming releases of IntelliJ IDEA, we will continue to add more inspections for Java language support, based on current and new language features.

New stable features in Java 26

Let’s take a quick look at the features Java 26 introduces.

JEP 516: Ahead-of-Time Object Caching with Any GC

Java continues to improve startup time and warmup performance, as part of Project Leyden. JEP 516 extends the HotSpot JVM’s ahead-of-time (AOT) cache to work with any garbage collector, including the low-latency ZGC, by storing cached Java objects in a GC-agnostic format and loading them sequentially into memory at startup.

JEP 517: HTTP/3 for the HTTP Client API

Update the HTTP Client API, introduced in Java 11, to support the HTTP/3 protocol, to make it possible for libraries and applications to interact with HTTP/3 servers with minimal changes to the code. This allows applications using the HTTP Client API to benefit from improvements offered by the HTTP/3 protocol, such as potentially faster handshakes, more reliable transport, and avoidance of network congestion issues. The HTTP/3 protocol is already supported by most web browsers and almost 40% of all websites.

JEP 522: G1 GC: Improve Throughput by Reducing Synchronization

This JEP improves application throughput for applications using the G1 garbage collector by reducing the synchronization required between application threads and GC threads.

JEP 500: Prepare to Make Final Mean Final

JDK 26 introduces warnings when deep reflection is used to mutate a final field, aiming to prepare developers for a future release where final truly means final, making Java programs both safer and potentially faster. Applications that rely on this pattern can update their code ahead of the eventual restriction, or selectively opt back in where truly needed.

JEP 504: Remove the Applet API

The Applet API, deprecated for removal since JDK 17, has been removed. Neither modern browsers nor recent JDK releases still support applets.

Preview features in Java 26

With Java’s release cadence of six months, new language features are often released as preview features. This gives developers a chance to try out new features and provide their feedback before these features become final. A preview feature may go through multiple rounds, either with or without changes, before it is finalized as a standard part of the language.

IntelliJ IDEA strives to support preview features, allowing you to experiment with them before they become final. Because of how these features work, IntelliJ IDEA is committed to only supporting preview features for the current JDK. To enable preview features, set Language level to 26 (Preview) – Primitive types in patterns (fourth preview).

Java 26 contains four preview features and one incubator feature. There are several changes to the preview features in Java 26, compared to Java 25.

JEP 530: Primitive Types in Patterns, instanceof, and switch (Fourth Preview)

This feature enhances pattern matching to support all primitive types in pattern contexts, including instanceof and switch. This feature lifts some of the existing limitations in pattern matching, making it possible to match, test, and safely convert primitive values in these constructs. Removing the need for unsafe manual casts (which might cause subtle bugs) and range checks, this feature improves code safety and readability. This feature is previewed again, with some changes since Java 25, which add some constraints (see JEP for details). 

For a quick example of using primitive types in switch expressions with guard patterns, see Java 24 and IntelliJ IDEA. For a longer explanation of the feature, see the section Primitive Types in Patterns, instanceof, and switch (Preview Feature) in Java 23 and IntelliJ IDEA. Note that there are some changes to this feature in the latest preview.

For more background information on this feature, watch the following video:

JEP Explained. JEP 455: Primitive Types in Patterns, instanceof, and switch

JEP 526: Lazy Constants (Second Preview)

As Java programmers, we are aware that we should strive for immutability, as it offers many benefits. Since an immutable object can be in only one state, it can be safely shared across multiple threads. The current way to manage immutability is to declare fields final. However, final fields must be set eagerly, either during construction for instance fields or during class initialization for static fields. This initialization leads to longer startup times and might not even be necessary if the fields are not actually used. 

Lazy constants offer greater flexibility as to the timing of their initialization. They are, as the name implies, initialized lazily. A lazy constant is a java.lang.LazyConstant object holding a single immutable value that is set only when first needed. The JVM treats them as true constants and applies the same performance optimizations.

To be eligible for constant folding (the process of simplifying constant expressions at compile time), a lazy constant must be stored in a final field. IntelliJ IDEA 2026.1 adds an inspection and quick-fix to make a LazyConstant final.

Make LazyConstant final

There are some changes to this feature compared to Java 25, mainly focusing on high-level use cases, removing low-level methods, and renaming the feature accordingly – from stable values to lazy constants.

JEP 525: Structured Concurrency (Sixth Preview)

Structured concurrency gives us better “idioms” for multithreaded code, which expresses the synchronous way of thinking. This makes concurrent code easier to understand and reason about. In addition, it helps to eliminate thread leaks and cancellation delays. It treats a group of related tasks running in different threads as a single unit of work, improving observability, cancellation, and error handling in concurrent code. 

IntelliJ IDEA has a live template sts to add structured concurrency to your code. If you know a live template exists, you can use it by name. 

Insert live template sts for structured concurrency

IntelliJ IDEA 2026.1 includes some improvements to the debugger regarding virtual threads. Virtual threads are grouped into containers representing their scopes, making it easy to see which threads are virtual and which are platform threads. Any virtual thread without its own container is placed under the Root container. This grouping is new and gives you a clear view of the structure in structured concurrency.

Get Thread Dump with Debugger

For background information on structured concurrency, watch the following video:

JEP Explained. JEP 480: Structured Concurrency

Note that there have been changes to this preview feature since the video was recorded.

JEP 524: PEM Encodings of Cryptographic Objects (Second Preview)

This JEP provides a preview API for encoding and decoding cryptographic objects to/from the Privacy-Enhanced Mail (PEM) format. The second preview contains some changes compared to the previous version.

Incubator features in Java 26

Incubator features are experimental APIs made available for developers to try out and provide feedback on. Unlike preview features, incubator APIs may change significantly or even be removed in future releases and are not intended for production use.

To use an incubator feature, you’ll need to explicitly add the module while you run it. To use Vector API, add the following: --add-modules jdk.incubator.vector.

If you are running your program from IntelliJ IDEA, you can add this to the run configurations for your application. Select the run configuration for your program and click the three dots for More Actions. Select Edit… to open the Run/Debug Configurations. Click the link Modify Options, and in the Add Run Options popup, select Add VM Options. A new field will appear with the hint VM Options. Add the option --add-modules jdk.incubator.vector to that field.

Add VM Options

JEP 529: Vector API (Eleventh Incubator)

This JEP introduces an API that allows developers to express vector computations that reliably compile to optimal vector instructions on supported CPUs. Vector operations enable more work to be performed in a single CPU cycle, which can result in significant performance gains. 

This eleventh incubator contains no substantial changes compared to the previous version. The Vector API will continue to incubate until the necessary features from Project Valhalla are available, at which point it will be adapted and promoted to preview.

For background information on Vector API, watch the following video:

JEP Explained. JEP 469: Vector API 

Contributions to the Java platform

When we spot an opportunity to make Java safer or less error-prone, we, of course, try to provide useful features in IntelliJ IDEA to help you write better code. But we also try to contribute improvements back to the platform.

Our colleague Tagir Valeev – author of 100 Java Mistakes and How to Avoid Them – contributed two new default methods to java.util.Comparator: min(T, T) and max(T, T). These make it straightforward to find the lesser or greater of two objects using a given comparator, without needing verbose workarounds. You can find more details in JDK-8356995. We are happy to see this change accepted into the platform!

Conclusion

Java 26 may not be an LTS release, but it brings meaningful performance improvements, useful library additions, and continues to evolve several important preview features. IntelliJ IDEA supports Java 26 from day one, so you can start taking advantage of everything this release has to offer right away.

IntelliJ IDEA will continue to support the latest Java features. As always, please let us know if you have any feedback.

Agile tools became Excel for managers. So I built a gamified Scrum board that lives inside your IDE.

Scrum shouldn’t be a reporting chore

Here’s a pattern I’ve seen at every company that “does Scrum”:

Sprint planning is a calendar ritual. The backlog is a graveyard of tickets nobody reads. Daily standups are people reading yesterday’s status off a screen while everyone else zones out. And the PM tool? A bloated browser app that takes 8 seconds to load, existing primarily so someone in management can export a burndown chart to a slide deck.

The tools aren’t built for the people doing the work. They’re built for the people watching the work get done.

For developers, the workflow is brutal. You’re in the zone, deep in your editor, and then you need to update a ticket status. Context-switch to a heavy browser tab, wait for it to load, click through three dropdowns, and by the time you’re back in your terminal you’ve forgotten what you were doing.

I got tired of it. So I built something different.

What I built: Lasimban (羅針盤)

Lasimban means “compass” in Japanese. It’s a Scrum-specialized task management tool — not a generic project management Swiss army knife, but a tool that actually understands the Scrum framework.

The structure is opinionated by design. Epics break down into Product Backlog Items (PBIs), PBIs live in sprints, sprints contain tasks. This isn’t a flexible “use it however you want” board — it’s Scrum Guide constraints baked into the data model. You can’t accidentally create a 6-week sprint or have orphan tasks floating in the void.

A few things that matter to me:

Native 4-language support (EN, JA, VI, TL). I work with teams spanning Tokyo and Manila. Language shouldn’t be a barrier to using your own project management tool. This isn’t bolted-on i18n — it’s built in from day one.

Real-time sync via GraphQL subscriptions. When someone in Manila moves a task, the board updates instantly in Tokyo. No refresh button, no “someone else modified this item” conflicts.

DSU (Daily Stand-Up) mode. Tasks untouched for 48 hours glow red — they’re probably blocked. Tasks completed in the last 24 hours glow green. Your daily standup becomes a 30-second visual scan instead of a 15-minute status recital.

Sprint doctor

“Scrum is a Game” — Why I added confetti to a B2B SaaS

This is where people usually raise an eyebrow. Confetti? In a B2B tool? Hear me out.

Scrum, at its core, is a multiplayer game. You have a team, a timebox, a goal, and a set of rules. There are rounds (sprints), a score (velocity), and win conditions (sprint goals met). The problem is that every tool on the market treats it like a spreadsheet exercise. Check the box, move the card, generate the report.

So I leaned into the game metaphor:

Rocket Launch

  • Starting a sprint triggers a sailing departure animation. You’re setting off on a voyage.
  • Completing a task plays a sparkle effect. Small, quick, satisfying.
  • Completing a PBI drops confetti. Because shipping a feature should feel like something.
  • Completing a sprint launches a rocket animation.

None of this is flashy for the sake of it. It’s about dopamine loops. The same reason every game gives you visual feedback when you accomplish something — it reinforces the behavior. Completing tasks should feel good, not feel like paperwork.

I also added keyboard navigation shortcuts. Press g followed by a key to jump anywhere — g b for the backlog, g s for sprints, g d for the dashboard. Your hands never leave the keyboard. Because if you’re building a tool for developers, it should respect how developers actually work.

The hack: MCP integration — never leave your IDE

This is the part I’m most excited about technically.

MCP (Model Context Protocol) is an open standard that lets AI assistants connect to external tools and data sources. Think of it as a universal API layer between LLMs and your applications. If your editor has an AI assistant (Cursor, Claude Code, GitHub Copilot, etc.), MCP lets that assistant talk directly to Lasimban.

The motivation is simple: developers live in the IDE. If I can bring the Scrum board into the editor through AI, there’s zero context-switching. You ask your AI assistant “what’s left in this sprint?” and it pulls the answer from Lasimban without you ever opening a browser.

Here’s how I built it.

Stateless HTTP, not SSE

The MCP spec defines SSE (Server-Sent Events) streaming as a transport option, but I went with stateless HTTP — POST request in, JSON response out, connection closed.

Why? The backend runs on Cloud Run, which scales containers from 0 to 10 based on request volume. SSE requires long-lived connections and session management — a client connects, holds the connection open, and the server pushes events over time. That’s fundamentally at odds with Cloud Run’s request-based scaling model. You’d pay for idle containers holding open connections and need sticky sessions or external session storage.

Stateless HTTP means every request is independent. Container spins up, handles the request, spins down. Auto-scaling just works. Simple to operate, cost-effective, and fully compliant with the MCP 2025-03-26 spec’s Streamable HTTP transport.

The implementation uses mark3labs/mcp-go v0.45.0 mounted on a Gin router. Single endpoint: POST /mcp, speaking JSON-RPC.

Markdown responses for LLM readability

Every tool response is formatted as Markdown text, not raw JSON.

This is deliberate. LLMs understand and summarize Markdown far better than they parse nested JSON objects. When the AI pulls sprint details, it gets a formatted overview with burnup/burndown data laid out in a way that’s easy to reason about. A dedicated Presenter layer handles the conversion — the Usecase layer returns domain objects, and the Presenter formats them into Markdown strings.

The result: when you ask “summarize the current sprint,” the AI gives you a coherent paragraph, not a JSON dump.

API key authentication

Authentication uses lsb_-prefixed API keys — Base62-encoded, 32 bytes of entropy. The plaintext key is shown exactly once at creation, then stored as a SHA-256 hash. Each user can have up to 3 keys, revocable anytime.

This is the same pattern GitHub and Stripe use for their API keys. Prefixed so you can identify them in logs and secret scanners, hashed so a database breach doesn’t compromise access.

Here’s the clever part: after API key authentication, the server generates the same user context as a regular browser login. That means zero new business logic was needed for MCP. The entire auth flow reuses existing infrastructure.

11 tools, read-heavy by design

The MCP server exposes 11 tools:

7 read tools:

  • list_projects — all projects the user has access to
  • list_sprints — sprints for a project
  • list_product_backlog_items — PBIs with status filtering
  • list_backlog_statuses — available status options
  • get_sprint_details — full sprint data including burndown metrics
  • get_product_backlog_item — detailed PBI view
  • get_task — individual task details

4 write tools:

  • update_task_status — change a task’s status
  • create_pbi — create a new PBI (with priority and Markdown description support)
  • create_task — create a new task (with Markdown description and self-assign option)
  • update_pbi_status — update a PBI’s backlog status

Read-heavy, write-light. The AI can observe everything and make targeted changes — creating items and updating statuses — but can’t restructure or delete existing data.

Every tool calls the existing Usecase layer directly. No new business logic was written for MCP — the tools are thin wrappers that authenticate, call the same functions the web app uses, and format the output as Markdown.

What this actually looks like in practice

From your editor, you can do things like:

  • “Summarize the current sprint status” — the AI pulls sprint details, burndown data, and gives you a status overview
  • “Which PBIs have the most remaining tasks?” — the AI identifies where bottlenecks are hiding
  • “Mark task LSMB-42 as done” — status update from your IDE, no browser needed

The full workflow becomes: check your task, implement the code, update the status — all without leaving the editor. Your Scrum board becomes ambient information rather than a destination.

Tech stack

Quick overview for the curious:

  • Backend: Go (Gin framework, clean architecture)
  • Frontend: Next.js
  • API: GraphQL for the web client, JSON-RPC for MCP
  • Real-time: WebSocket
  • Infrastructure: Cloud Run (0-to-10 auto-scaling)
  • MCP: mark3labs/mcp-go, stateless Streamable HTTP

What’s next

The latest update already expanded MCP tools to 11 — you can now create PBIs (with priority levels), create tasks with Markdown descriptions, and update PBI statuses directly from your IDE. The longer-term vision: AI facilitating actual Scrum events. Imagine an AI that auto-summarizes your sprint review based on completed PBIs, or suggests retrospective improvements based on sprint metrics patterns.

The goal isn’t to replace the Scrum Master — it’s to remove the clerical overhead so teams can focus on the conversations that actually matter.

If you want to try it out, Lasimban has a free tier at lasimban.team.

Lasimban – Scrum-Focused Task Management Tool

Make Scrum development more intuitive and enjoyable. Lasimban is a Scrum-focused task management tool that shows your team the right direction.

favicon
lasimban.team

I’m curious — what’s the most annoying thing about your current agile tool? The thing that makes you think “why is this so hard?” every single time. I’d love to hear what pain points other developers are hitting, especially if you’re working across time zones or languages.

Scaling Jenkins: Central Controller vs Instance Sprawl

This article was brought to you by Kumar Harsh, draft.dev.

Jenkins has powered CI/CD pipelines for more than a decade. Many teams start with a single Jenkins controller and a handful of build jobs. At that stage, Jenkins feels simple and flexible.

The problem appears later.

As organizations grow, the number of pipelines increases rapidly. Teams add more agents, install more plugins, and create more complex workflows. Eventually the Jenkins controller becomes the bottleneck that limits build throughput and operational stability.

This article explains why scaling Jenkins becomes difficult, what architectural patterns teams use to manage growth, and how modern CI/CD platforms such as TeamCity approach the same challenge differently.

What does scaling Jenkins actually mean?

Scaling CI/CD is not just about the number of builds a system can run.

At enterprise scale, CI systems must handle:

  • hundreds or thousands of concurrent builds
  • multiple repositories and programming languages
  • complex artifact dependencies
  • short feedback cycles for developers
  • high reliability and compliance requirements

A CI platform that worked well for a few teams must now support an entire engineering organization.

Architecture becomes a critical factor.

Why Jenkins struggles at scale

Jenkins was originally designed around a single controller architecture. The controller performs several responsibilities:

  • scheduling build jobs
  • managing pipeline configuration
  • coordinating build agents
  • storing metadata and artifacts
  • serving the web interface
  • executing plugin logic

When the number of builds increases, these responsibilities compete for the same CPU, memory, and I/O resources.

Even if you add more agents, the controller itself may become the bottleneck.

Common symptoms include:

  • growing build queues
  • slow UI performance
  • controller instability
  • frequent restarts during upgrades

At small scale these problems are manageable. At enterprise scale they become operational risks.

Two ways teams try to scale Jenkins

Organizations usually attempt one of two strategies.

1. A large centralized controller

In this model, one powerful Jenkins controller manages all pipelines across the organization.

Advantages:

  • centralized governance
  • easier visibility across pipelines
  • consistent configuration

Challenges:

  • controller becomes a single point of failure
  • upgrades affect all builds
  • plugin conflicts can impact the entire system

2. Multiple Jenkins controllers

Many organizations split workloads across several controllers.

Each controller may support:

  • a specific product team
  • a set of repositories
  • a particular environment

Advantages:

  • reduced load per controller
  • partial isolation between teams

Challenges:

  • configuration drift
  • inconsistent plugin versions
  • duplicated maintenance work
  • fragmented governance

Over time this approach often leads to Jenkins instance sprawl.

Instead of one complex controller, organizations manage dozens of smaller Jenkins environments.

The plugin ecosystem at scale

The Jenkins plugin ecosystem is one of the platform’s biggest strengths. Integrations with version control systems, cloud platforms, and developer tools are usually implemented through plugins.

However, plugin management becomes significantly more complex as systems grow.

Common problems include:

  • dependency chains between plugins
  • incompatible plugin versions across controllers
  • controller restarts required for upgrades
  • abandoned or unmaintained plugins
  • security vulnerabilities in plugin code

A single plugin upgrade may trigger additional dependency updates. Administrators often need to test plugin combinations carefully before deploying them in production.

At enterprise scale, plugin management becomes an operational discipline of its own.

Operational costs of running Jenkins at scale

Infrastructure costs are only part of the equation.

Organizations running large Jenkins installations must also manage:

  • plugin lifecycle management
  • controller upgrades
  • security patching
  • access control governance
  • pipeline configuration maintenance

Downtime can affect hundreds of developers simultaneously. When builds stop, releases are delayed and engineering productivity drops.

In regulated environments, compliance requirements add another layer of complexity. Administrators must track plugin usage, credential access, and audit logs across multiple Jenkins instances.

How modern CI platforms approach scalability

Modern CI/CD platforms are increasingly designed with scalability as a core architectural principle.

Instead of relying heavily on plugins and controller customization, they focus on:

  • built-in integrations
  • predictable upgrade processes
  • clearer separation between orchestration and execution

This approach reduces operational overhead and improves system stability as organizations grow.

How TeamCity addresses CI/CD scaling

TeamCity uses a server-agent architecture that separates orchestration from build execution.

Key capabilities include:

  • native integrations for common tools
  • build chains for managing pipeline dependencies
  • built-in artifact management
  • configuration as code using Kotlin DSL
  • centralized governance and visibility

Because many integrations are built into the platform, organizations rely less on third-party extensions. This reduces dependency management and simplifies upgrades.

At larger scale, fewer moving parts can translate into more predictable CI/CD operations.

💡 Read also: Centralized Power: How TeamCity’s Architecture Solves Jenkins’ Scaling Problem

Jenkins vs TeamCity at scale

Capability Jenkins TeamCity
Core architecture Single controller with agents Server and agents
Integrations Plugin ecosystem Mostly built-in
Upgrade complexity Plugin dependency management Integrated release cycle
Governance Varies across controllers Centralized
Operational overhead Higher at large scale Typically lower

Both platforms can support enterprise CI/CD, but they approach scalability differently.

Evaluating CI/CD platforms for large organizations

When choosing a CI/CD platform, organizations should evaluate several factors:

Build scale
How many builds run daily and how quickly developers need feedback.

Governance requirements
Whether compliance or security standards require centralized visibility and control.

Operational complexity
How much engineering time can be dedicated to maintaining CI infrastructure.

Integration needs
Whether teams rely on highly customized integrations or prefer built-in capabilities.

Running a proof-of-concept migration with a small project is often the best way to compare platforms.

Conclusion

Jenkins remains one of the most widely used CI/CD tools in the industry. Its flexibility and plugin ecosystem helped it become the backbone of many engineering organizations.

However, scaling Jenkins often requires significant operational investment. Organizations must manage controllers, plugin dependencies, and infrastructure as their CI environments grow.

Platforms like TeamCity take a different architectural approach. By emphasizing built-in capabilities and centralized management, they aim to reduce the operational burden of running CI/CD at enterprise scale.

For teams reassessing their CI infrastructure, the key question is simple:

Do you want to engineer your CI platform, or focus on engineering your product?

Koog Comes to Java: The Enterprise AI Agent Framework From JetBrains

Adding AI agents to your enterprise backend shouldn’t mean compromising your architecture. If your core systems are built in Java, orchestrating LLMs shouldn’t require you to introduce separate Python microservices or rewrite your stack.

Today, we are launching Koog for Java. Originally built to keep pace as JetBrains scaled up its own activities, Koog replaces unpredictable, ad hoc prompt changing with structured, observable, and fault-tolerant agent workflows.

Now, one of the JVM’s most powerful agent frameworks comes with a fully idiomatic Java API. Your Java teams can build reliable AI agents directly inside your existing backends, with fluent builder-style APIs, thread pool executors, and native Java abstractions – completely free of Kotlin-specific friction.

What you get with Koog for Java

The Java API provides access to all of Koog’s features:

  • Multiple workflow strategies (functional, graph-based, and planning): Control exactly how your agent executes tasks.
  • Spring Boot integration: Drop Koog into your existing Spring applications.
  • Support for all major LLM providers: Use your preferred models from OpenAI, Anthropic, Google, DeepSeek, Ollama, and more.
  • Fault tolerance with Persistence: Recover from failures without losing progress or repeating expensive LLM calls.
  • Observability with OpenTelemetry: Get full visibility into agent execution, token usage, and costs, with Langfuse and W&B Weave support out of the box
  • History compression: Reduce token usage and optimize costs at scale
  • And much more!

Read on to see what building agents in Java with Koog looks like.

Simple setup

AI agents work by connecting large language models (LLMs) with functions from your application, which are generally referred to as “tools”. The LLM decides which tools to call and when, based on the task you give it. Building an agent in Java starts with defining these tools. Annotate your existing Java methods with @Tool and add descriptions so the LLM understands what each function does:

public class BankingTools implements ToolSet {
    @Tool
    @LLMDescription("Sends money to a recipient")
    public Boolean sendMoney(
        @LLMDescription("Unique identifier of the recipient")
        String recipientId,
        Integer amount
    ) {
        return true; // Your implementation here
    }

    @Tool
    @LLMDescription("Account balance in $")
    public Integer getAccountBalance(String userId) {
        return 1000000; // Your implementation here
    }
}

Next, create an agent using the builder API. You’ll need to configure which LLM providers to use (OpenAI, Anthropic, etc.), set a system prompt that defines the agent’s role, and register your tools:

// Connect to one or more LLM providers
var promptExecutor = new MultiLLMPromptExecutor(
    new OpenAILLMClient("OPENAI_API_KEY"),
    new AnthropicLLMClient("ANTHROPIC_API_KEY")
);

// Build the agent
var bankingAgent = AIAgent.builder()
    .promptExecutor(promptExecutor)
    .llmModel(OpenAIModels.Chat.GPT5_2)  // Choose which model to use
    .systemPrompt("You're a banking assistant")  // Define the agent's role
    .toolRegistry(
        ToolRegistry.builder()
            .tools(new BankingTools())  // Register your tools
            .build()
    )
    .build();

// Run the agent with a user task
bankingAgent.run("Send 100$ to my friend Mike (mike_1234) if I have enough money");

When you run this agent, it will:

  1. Check the account balance using getAccountBalance()
  2. If there’s enough money, call sendMoney() with the right parameters
  3. Return a response to the user

This connects your Java application’s functionality with a fully autonomous AI agent that can reason about which actions to take.

Predictable workflows with custom strategies

The simple example above lets the LLM decide everything – which tools to call and in what order. But for production systems, you often need more control. What if you want to ensure certain operations happen before others? Or limit which tools are available at each step? Or implement verification loops?

Koog provides different approaches to defining agent workflows: functional (code-based), graph-based, and planning-based.

Functional strategies let you orchestrate individual agentic steps in code. Think of it like writing a regular Java method, but each step can involve LLM calls and tool executions. You split large tasks into smaller subtasks, each with its own prompt, limited set of tools, and type-safe inputs/outputs:

var functionalAgent = AIAgent.builder()
    .promptExecutor(promptExecutor)
    .functionalStrategy("my-strategy", (ctx, userInput) -> {
        // Step 1: First, identify the problem
        // Only give the agent communication and read-only database access here
        ProblemDescription problem = ctx
            .subtask("Identify the problem: $userInput")
            .withOutput(ProblemDescription.class)  // Type-safe output
            .withTools(communicationTools, databaseReadTools)  // Limited tools
            .run();

        // Step 2: Now solve the problem
        // Give the agent database write access only after problem identification
        ProblemSolution solution = ctx
            .subtask("Solve the problem: $problem") // Use output from step 1
            .withOutput(ProblemSolution.class)
            .withTools(databaseReadTools, databaseWriteTools)
            .run();

        // Verify the solution and try to fix it until the solution is satisfying
        while (true) {
            var verificationResult = ctx
                .subtask("Now verify that the problem is actually solved: $solution")
                .withVerification()
                .withTools(communicationTools, databaseReadTools)
                .run();

            if (verificationResult.isSuccessful()) {
                return problemSolution;
            } else {
                problemSolution = ctx
                    .subtask("Fix the solution based on the provided feedback: ${verificationResult.getFeedback()}")
                    .withOutput(ProblemSolution.class)
                    .withTools(databaseReadTools, databaseWriteTools)
                    .run();
            }
        }

    })
    .build();

This approach gives you the flexibility of code while still using AI agents for individual steps. Notice how you control the order of operations and which tools are available at each step. You can check the full runnable example here.

Graph strategies define workflows as finite state machines with type-safe nodes and edges. Unlike functional strategies, graph strategies separate the logic (nodes and edges) from its execution. This enables powerful features like fine-grained persistence – if your agent crashes, it can resume from the exact node where it stopped, not from the beginning:

var graphAgent = AIAgent.builder()
    .graphStrategy(builder -> {
        // Define the overall graph structure
        var graph = builder
            .withInput(String.class)
            .withOutput(ProblemSolution.class);

        // Define workflow elements: individual nodes (steps) and subgraphs
        var identifyProblem = AIAgentSubgraph.builder()
            .withInput(String.class)
            .withOutput(ProblemDescription.class)
            .limitedTools(communicationTools, databaseReadTools)
            .withTask(input -> "Identify the problem")
            .build();

        var solveProblem = … // subgraph for solving a problem
        
        var verifySolution = … // subgraph for verifying a solution
        
        var fix = ...// subgraph for fixing a problem

        // Connect the nodes with edges to define execution flow
        graph.edge(graph.nodeStart, identifyProblem);
        graph.edge(identifyProblem, solveProblem);
        graph.edge(solveProblem, verifySolution);

        // Conditional edges: if verification succeeds, finish; otherwise, attempt a fix
        graph.edge(AIAgentEdge.builder()
        	.from(verifySolution)
        	.to(graph.nodeFinish)
        	.onCondition(CriticResult::isSuccessful)
        	.transformed(CriticResult::getInput)
        	.build());

        graph.edge(AIAgentEdge.builder()
        	.from(verifySolution)
        	.to(fix)
        	.onCondition(verification -> !verification.isSuccessful())
        	.transformed(CriticResult::getFeedback)
        	.build());

        graph.edge(fix, verifySolution);

        return graph.build();
    })
    .build();

Graph strategies are ideal when you need persistence, complex branching logic, or want to visualize your agent’s workflow. You can share the visualization and discuss it with your ML colleagues:

Each node is type-safe, ensuring that the outputs from one node match the expected inputs of the next. You can find the full example here.

Planning strategies use goal-oriented action planning (GOAP) or LLM-based planning. Instead of defining the exact execution order, you define:

  • Available actions with their preconditions (when they can run)
  • Effects (what they change in the agent’s state)
  • A goal condition (what the agent should achieve)

The planner automatically figures out the optimal order for executing actions to reach the goal. This is powerful for complex scenarios where multiple paths might work, or when requirements change dynamically. See a detailed example here.

Persistence for fault tolerance

AI agents often handle complex, multi-step tasks that can take seconds or even minutes. During this time, servers can crash, network connections can fail, or deployments can happen. Without persistence, your agent would have to start all over again, wasting time and money on repeated LLM calls.

Koog’s persistence feature saves agent state to disk, S3, or a database after each step. If something fails, the graph-based agent can resume from exactly where it stopped, not from the beginning. It will restore at the last individual node and preserve all progress made before the failure:

// First, configure where to store checkpoints
// Can be Postgres, S3, local disk, or your own implementation
var storage = PostgresJdbcPersistenceStorageProvider(
    dataSource = dataSource,
    tableName = “banking_agent_checkpoints”
)

// Install the Persistence feature on your agent
var recoverableAgent = AIAgent.builder()
    // ... other agent configuration
    .install(Persistence.Feature, config -> {
        config.setStorage(storage);
        config.setEnableAutomaticPersistence(true);  // Auto-save after each step
    })
    .build();

// First run - starts fresh
recoverableAgent.run("Help me with my account", "user-session-0123");

// If a crash happens mid-execution...

// Second run with same session ID - automatically recovers and continues
recoverableAgent.run("Help me with my account", "user-session-0123");

The session ID ties checkpoint data to a specific user session (like a user ID or request ID). This lets you run multiple agent instances simultaneously without conflicts.

Observability with OpenTelemetry

When running agents in production, you need visibility into what they’re doing. Which tools did they call? How many tokens did each LLM request use? Where are the bottlenecks? Where did costs come from?

Koog integrates with OpenTelemetry to provide this visibility. Connect to backends like Langfuse or W&B Weave to see detailed traces of agent execution, including nested events (nodes, tool calls, and LLM requests), token counts, costs, and timing information:

var observableAgent = AIAgent.builder()
    // ... other agent configuration
    .install(OpenTelemetry.Feature, config -> {
        // Export telemetry data to your observability backend
        config.addSpanExporter(OtlpGrpcSpanExporter.builder()
            .setEndpoint("http://localhost:4317")  // Your OpenTelemetry collector
            .build());
    })
    .build();

Once configured, every agent run automatically generates detailed traces that you can explore in your observability tool.

History compression

As agents work on complex tasks, their conversation history grows with every LLM call and tool invocation. This history is sent with each subsequent request to provide context. But longer context means:

  • Slower LLM responses
  • Higher costs (you pay per token)
  • Eventually hitting context window limits

Koog’s history compression solves this by intelligently summarizing or extracting key information from the history, reducing token usage while preserving what’s important:

var agentWithCompression = AIAgent.builder()
    .functionalStrategy("compressed", (ctx, userInput) -> {
        var response = ctx.requestLLM(userInput);
        // Your agent logic...

        // When history gets long, compress it
        ctx.compressHistory();
    })
    .build();

You can customize how compression works:

  • HistoryCompressionStrategy.WholeHistory – compress entire history into a summary.
  • HistoryCompressionStrategy.FromLastNMessages(100) – only compress the last N messages.
  • HistoryCompressionStrategy.Chunked(20) – compress in chunks of N messages.
  • RetrieveFactsFromHistory – extract specific facts from history (e.g. “What’s the user’s name?” or “Which operations were performed?”).

You can also implement your own history compression strategy.

Managing Java threads

In a typical Java application, you want fine-grained control over thread pools. Maybe you have a dedicated pool for CPU-bound work and another for I/O operations. Koog lets you specify a separate ExecutorService for each part of an agent’s execution:

var threadControlledAgent = AIAgent.builder()
    .promptExecutor(promptExecutor)
    .agentConfig(AIAgentConfig.builder(OpenAIModels.Chat.GPT5_2)
        .strategyExecutorService(mainExecutorService)      // For agent logic
        .llmRequestExecutorService(ioExecutorService)      // For LLM API calls
        .build())
    .build();

This separation lets you optimize resource usage – for example, using a larger pool for I/O-bound LLM requests while keeping a smaller pool for strategy execution logic.

Try Koog for Java

Koog for Java brings enterprise-grade agent engineering to your Java applications with an API that feels natural and idiomatic. Whether you’re building simple tool-calling agents or complex multi-step workflows with persistence and observability, Koog provides the abstractions you need.

Get started here: https://docs.koog.ai/

Toolbox App 3.4: Remote IDE Lifecycle Hooks, macOS Fullscreen Fix, UTF-8 Support, and More

Toolbox App 3.4 brings several long-awaited fixes alongside new capabilities for plugin developers. You can now hook into the remote IDE launch lifecycle, the Toolbox window behaves correctly in full-screen mode on macOS, and Windows users with non-ASCII usernames no longer need workarounds. The jetbrainsd service introduced in 3.3 also gets a round of reliability improvements.

Remote IDE lifecycle hooks

Toolbox App 3.4 introduces plugin API callbacks for the remote IDE launch lifecycle. If you’re building Toolbox plugins, you can now register hooks that fire when a remote IDE launch starts and when it completes.

What this enables:

  • Pre-launch preparation: Plugins can run custom logic before the IDE process starts – installing plugins, configuring memory settings, or running scripts in the remote IDE directory.
  • Post-launch callbacks: Plugins receive a notification when the IDE launch completes, enabling cleanup or follow-up actions.
  • Asynchronous work: Callbacks support suspending operations, so the launch waits for the plugin’s work to finish before proceeding.

macOS full-screen fix

On MacBooks with a notch, the Toolbox window used to disappear when you moved the cursor away from the menu bar and back. This is now fixed – the window stays open reliably in full-screen mode.

UTF-8 and non-ASCII username support on Windows

Windows users with non-ASCII characters in their usernames (e.g., accented letters or Cyrillic characters) can now install and use the Toolbox App without issues.

Remote development fixes

  • We resolved the file descriptor leak on Linux. The Toolbox App was leaking file descriptors to the ssh_outputs directory, accumulating thousands over time. In some cases, this caused the system tray icon to disappear after a few days.
  • Connections no longer hang with a spinning indicator when connecting to a remote machine.
  • TCP keepalive for OpenSSH connections has been enabled, improving stability for long-running remote sessions.

jetbrainsd service improvements

The jetbrainsd service introduced in 3.3 has received several reliability improvements in this release:

  • The daemon now exits automatically after a timeout when all client applications (Toolbox or IDEs) have disconnected.
  • Protocol handler registration no longer repeats on every startup.
  • The jetbrains:// protocol links now work correctly on Linux systems without a full desktop environment, such as WSL. Previously, xdg-open would fail with a Permission denied error.

Other improvements

  • IDEs now auto-restart correctly when updating to the latest version.
Download the latest version

Let us know what you think of Toolbox App 3.4 – your feedback helps shape what comes next.

The JetBrains Toolbox App team