TL;DR: This is a technical blog post about our work to improve UI responsiveness in IntelliJ-based IDEs. It’s a multi-year effort to fix several architectural constraints. The project is still ongoing, and so far we’ve built new tools and APIs that help move performance-sensitive work away from the UI thread. This change means the UI thread now holds the write lock for much less time, about one-third as long as before. If you are not interested in the technical details, you can skip to the end for the graphs.
One of the most common complaints about IntelliJ-based IDEs is performance. We know. We’re working to make the IDE more responsive. That is not always easy: The IntelliJ Platform is 25 years old, and some of its architectural decisions are baked in. Those decisions also make some optimizations hard.
The deadly entanglement
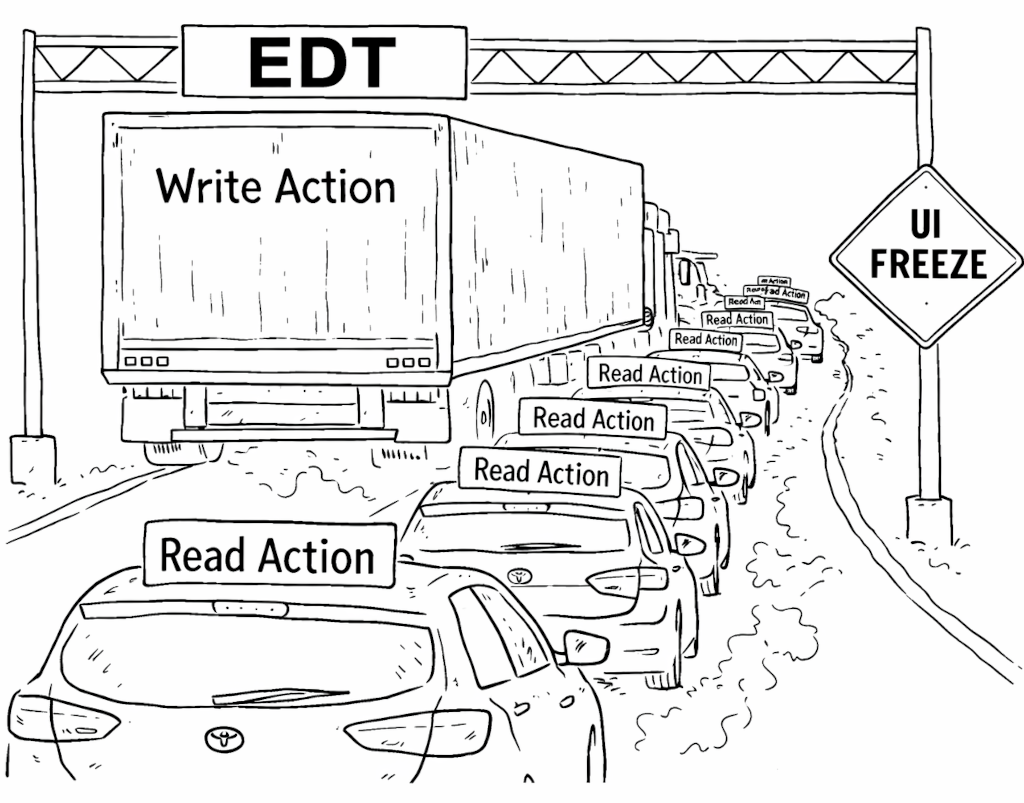
The IntelliJ Platform is a multithreaded framework built around a single read-write (RW) lock. The IDE operates on several core data structures: syntax trees (PSI), the text view of files (the Document subsystem), and a view of the OS file system (the Virtual File System, or VFS). Access to these structures is protected by the RW lock. Operations are divided into read actions and write actions. At any moment, only one write action can exist; multiple read actions can run in parallel, but read actions and a write action cannot run at the same time.
Our IDEs are also UI applications, which means they use a UI framework. In the IntelliJ Platform, that framework is Java AWT, which has a single UI thread: the event dispatch thread (EDT). This thread is responsible for processing user input and painting the UI. Java also allows business logic to run there. The EDT’s performance directly affects how responsive the application feels: If it can process paint events and user input quickly, the IDE feels snappy.
This is where the freezes come from. The write action itself can cause freezes. Some write actions, such as reparsing syntax trees or updating file system views, are expensive on their own. Another, less obvious, source of freezes is waiting to acquire the write lock. Since read actions and write actions cannot run simultaneously, starting a write action means waiting for all active read actions to finish. We’ve put a lot of work into making read actions cancelable, but the problem doesn’t go away entirely: If even one read action is uncooperative, the whole IDE can suffer.
That naturally led us to identifying a key goal: Move write actions off the UI thread.
With good intentions
The effort to support background write actions began in 2019, with Valentin Fondaratov, Andrew Kozlov, and Peter Gromov.
For a long time, code running on the EDT could conveniently access IntelliJ Platform models. With background write actions, that convenience becomes a problem: UI code can no longer assume that model access is always safe without explicit coordination. To preserve compatibility, we had to keep a lot of existing UI code working while we made those assumptions explicit.
There was another complication. Code on the EDT could also start a write action immediately. That is not true for ordinary explicit read actions, because a write action cannot simply begin in the middle of a read action.
This is where write-intent comes in. Write-intent is a lock state that still allows parallel read actions, but can be held by only one thread at a time and can be upgraded atomically to a full write action. That makes it a good fit for EDT code that may need to transition into a write action. Adopting this approach in the platform was an important step toward supporting background writes while preserving existing behavior.
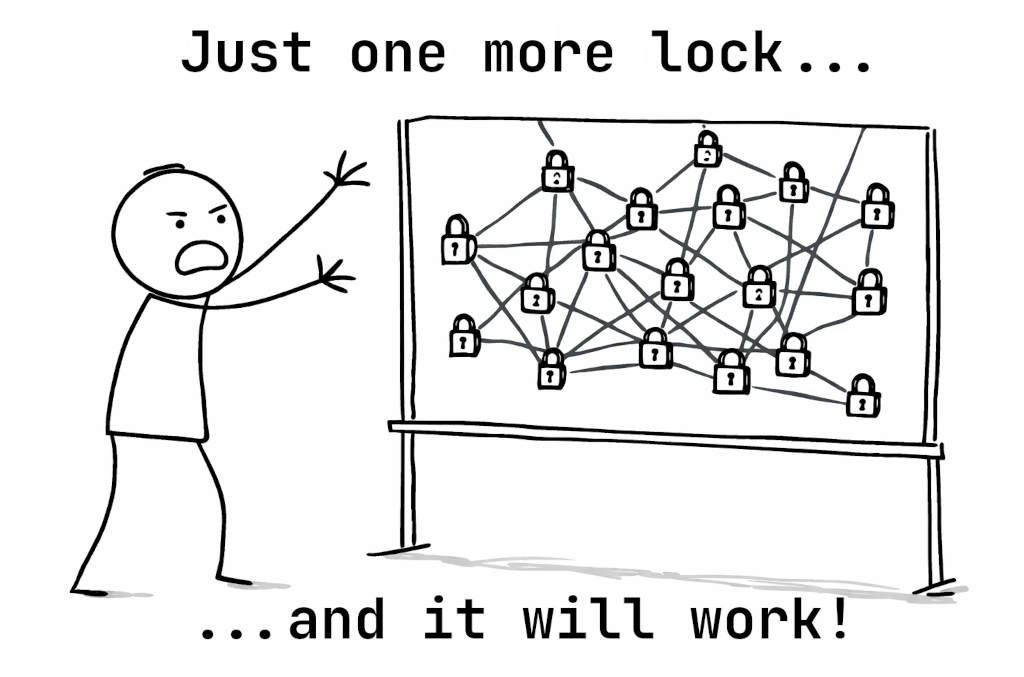
The project was paused in 2020 because the amount of required change was enormous. Many UI components, especially the editor, relied heavily on long-standing assumptions about model access from the EDT.
The grand refactoring

The project was paused, but not abandoned. In 2022, Lev Serebryakov and Daniil Ovchinnikov restarted the effort.
During this stage, we refactored the IntelliJ Platform to surface a lot of assumptions the platform had relied on implicitly. That work reduced some of the platform’s reliance on implicit locking in UI-driven code paths.
Another important part of this stage was our collaboration with the JetBrains Research team. Our previous lock implementation assumed write actions ran only on the EDT. Moving them into the background needed a different lock, and plain old ReentrantReadWriteLock was not a good fit for our needs. The result was a new cancelable lock that now powers the platform (see this research paper).
This stage lasted until the end of 2024.
When one lock is not enough
At the beginning of 2025, Konstantin Nisht took over this part of the project. At that point, we were almost ready to run our first background write actions. But there was one major problem left: modality.
Some UI elements in the IDE need to block the user’s attempts to interact with anything but themselves. These are modal dialogs, such as the Settings dialog. In the IntelliJ Platform, modality also affects the model: While a modal dialog is visible, unrelated write actions should not be able to start. Historically, the EDT scheduler handled much of this by ensuring that UI work launched in a non-modal context would simply not run while a modal dialog was active.
Background write actions do not fit into that model automatically.
If a modal dialog is shown on the EDT while holding write-intent, then a naive attempt to run a background write action can deadlock. At the same time, we still want computations inside the dialog to make progress without being disrupted by unrelated work outside it.
To solve this, we introduced a modality-aware locking strategy that separates what happens inside a modal dialog from what happens outside it. That preserves the guarantees that modal dialogs rely on and lets background write actions run.
This also works for nested modal computations, which matters because real modal workflows are not always flat. With that in place, we were finally able to run our first write actions in the background.
Moving work without breaking plugins
The initial write actions were relatively easy to move into the background. They lived in the Workspace Model and were primarily used to invalidate some caches. After that, it was time to try something more substantial: VFS refresh.
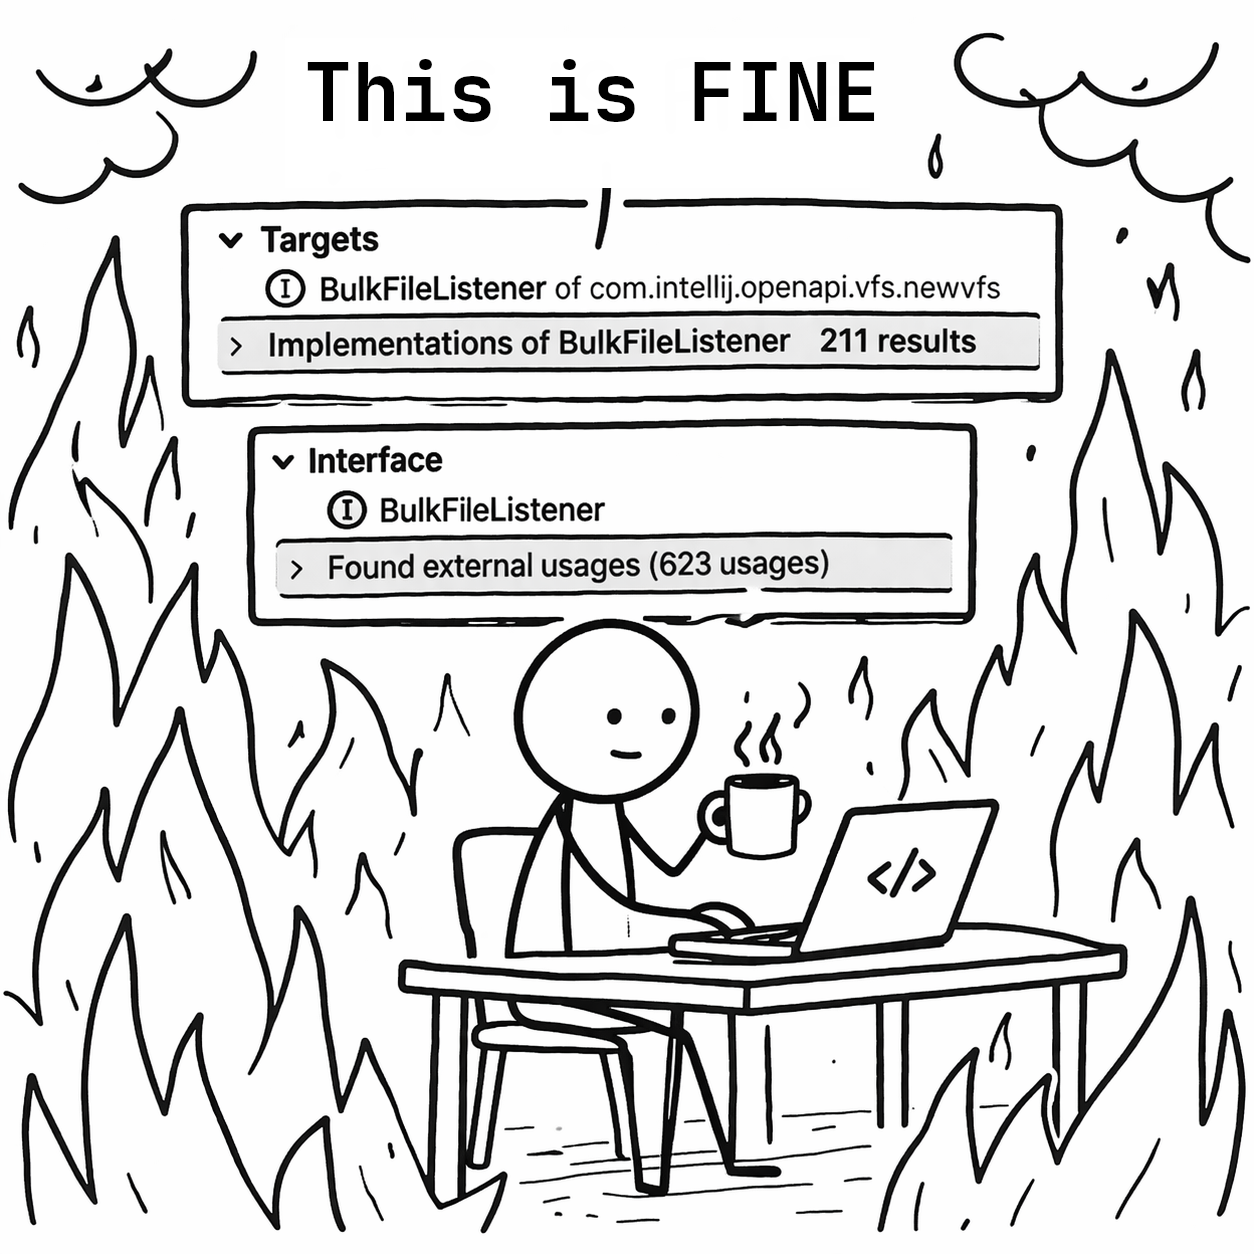
VFS refresh is the process of synchronizing file modification events from the operating system with the IDE’s internal data structures. Besides applying those events, refresh also calls listeners, meaning plugin code that reacts to file system changes. Traditionally, VFS refresh runs in a write action, and those listeners are called there too.
That creates a compatibility problem. For many years, a large amount of listener code has assumed that it would run on the EDT. Some listeners naturally access the UI. Many of them live in plugins we do not control, which means we cannot simply change the execution model and hope everything keeps working.
So the challenge was not only to move the write action itself, but to do it without breaking a long tail of existing plugin code.
The basic idea was straightforward: Keep the write action in the background, but hand specific listener work back to the EDT when compatibility requires it. Swing gives us a synchronous handoff for that with invokeAndWait(...).
Unfortunately, there is a deadlock hiding behind that seemingly simple approach. If the background write action tries to synchronously hand work to the EDT while the EDT is itself blocked waiting on a lock, the IDE can freeze.
To avoid that, we introduced an internal compatibility mechanism that allows carefully selected UI events to keep making progress during these waits. That gave us a way to migrate this incrementally: We could move expensive write work off the EDT while preserving compatibility for listeners that still depended on it.
This turned out to be one of the most important parts of the project. It let us migrate listeners incrementally, keep compatibility for external plugins, and still get most of the performance win by moving the slowest pieces first.
After VFS refresh, we migrated the document commit process as well. This is the process that rebuilds PSI from documents, and once the core write-action machinery was in place, moving it was much more straightforward.
Let’s do it later
Background write actions are not a cure-all. They help reduce the time the EDT spends running write actions, but they do not automatically eliminate the time the EDT spends waiting for locks.
Even if write actions run in the background, the EDT can still be asked to acquire read or write-intent access. While a write action is running, or while one is waiting to acquire the write lock, those requests can still freeze the UI. That brings us to the second part of this project: removing as much lock acquisition from the EDT as possible.
One especially problematic area was the editor. The editor is responsible for drawing content on the screen based on its models, such as the caret, foldings, and document text. But document modification is protected by the RW lock, and the editor still needs access to that data on the EDT. For a long time, this meant read actions were everywhere in the editor, including in paint paths. That is a major problem, because painting can happen at any time, which means the editor could end up demanding read access at exactly the moment we most want the UI thread to stay free.
In this area, we made a pragmatic trade-off. We relaxed some lock requirements for editor-related EDT paths, while keeping some document-related writes on the EDT to preserve consistency. That made editor painting less lock-heavy, even though it did not yet let us move all document modification into the background. We still have to solve that part.
Another source of lock pressure on the EDT was our API for asynchronous computations. To preserve compatibility, many such computations still ended up coupled to write-intent acquisition, which meant they could freeze the EDT at unpredictable moments.
Here, the key observation was simple: If someone schedules work to run asynchronously on the UI thread, that person usually does not care about the exact microsecond when it starts. That means we do not always need to block the EDT waiting for write-intent access. In many cases, we can just delay the computation until that access becomes available. After some changes to the platform’s UI scheduling, this became much less of a problem.
Results, future work, and acknowledgments
Background write actions are complex because they touch fundamental contracts in the IntelliJ Platform. We’re still building APIs and tools to help plugins decouple their logic from the EDT. The work is not finished, but here’s where we are.
As a metric, we track how much time the EDT spends doing write actions. Here is the graph, based on data gathered one week after each release:
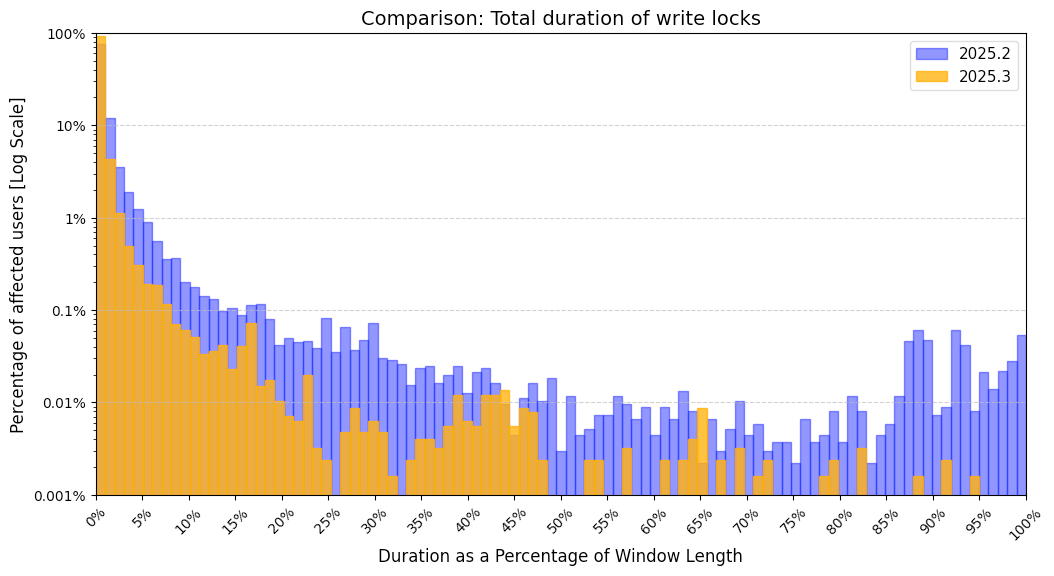
For example, in 2025.2, 1% of users spent 5% of their UI time on write actions. In 2025.3, the same percentile of users spent only 3%. Overall, the expected share of UI time spent on write locks on the EDT dropped from 1.8276% in 2025.2 to 0.5298% in 2025.3.
In the future, our work will focus on removing more write-intent usage from the EDT. We want to eliminate locking from common interactions such as typing. That is a difficult goal because it requires rethinking fundamental structures such as Actions, PSI, and Documents. It’s hard, but we think it’s doable.
Finally, we’d like to thank all the people we haven’t already mentioned who were directly or indirectly involved in this project: Anna Saklakova, Dmitrii Batkovich, Vladimir Krivosheev, Moncef Slimani, Lev Serebryakov, and Nikita Koval, amongst others. This post began as an internal article by Konstantin Nisht and was adapted for the public blog by Patrick Scheibe – with fewer breaking changes than usual.