The rise of artificial intelligence is changing how developers build and maintain web applications. Instead of replacing traditional coding practices, AI tools are becoming assistants that help developers work faster, test efficiently, and improve user experiences.
Today’s development workflow is no longer just about writing code — it’s about combining human creativity with intelligent automation.
AI as a Productivity Tool, Not a Replacement
Many developers use AI-powered tools to generate code suggestions, debug errors, or automate repetitive tasks. While these tools increase productivity, strong programming fundamentals are still essential.
Developers who understand core concepts like system design, API architecture, and performance optimization can use AI more effectively without compromising code quality.
The Importance of Scalable Architecture
AI features often require handling large amounts of data, which makes scalability even more important. Developers focus on creating flexible backend systems that can manage growing user demands while maintaining performance.
Common practices include:
Building modular components
Using microservices architecture
Optimizing server-side logic
Implementing efficient caching strategies
These approaches ensure that applications remain stable as new features are introduced.
Balancing Automation With Creativity
One challenge developers face is balancing automation with creativity. While AI can speed up development, human insight is still necessary for designing user-friendly experiences and solving complex problems.
The best results often come from combining automated tools with thoughtful planning and structured development practices.
Preparing for the Future of Development
As AI continues to evolve, developers are learning new ways to integrate intelligent systems into web and software projects. Staying updated with emerging technologies while maintaining strong fundamentals will be key to building reliable digital products.
Continuous learning, experimentation, and collaboration will shape the next generation of modern development workflows.
Claude Code is an incredible AI coding assistant, but it lives in the terminal. I wanted something more visual — a native desktop app where I could manage multiple projects, coordinate AI agent teams, and connect tools with one click.
So I built Pilos Agents.
What Is Pilos Agents?
Pilos Agents is an open-source (MIT) Electron app that wraps Claude Code with a proper desktop UI. Think of it as the visual layer on top of Claude Code’s CLI.
Key features:
Multi-project tabs — Work on multiple codebases simultaneously, each with isolated conversations
Multi-agent teams — PM, Architect, Developer, Designer, and Product agents collaborate on tasks with distinct perspectives
One-click MCP integrations — Connect GitHub, Jira, Supabase, Sentry, browser automation and more without editing JSON configs
Persistent memory — SQLite-backed project memory that carries across sessions and restarts
Built-in terminal — Full xterm.js terminal embedded alongside agent output
No lock-in. Your Claude Code CLI does all the AI work. Pilos is just the visual layer on top.
The Multi-Agent Approach
The most interesting feature is multi-agent collaboration. Instead of a single AI assistant, you get a team:
PM breaks down tasks and tracks priorities
Architect designs system-level solutions
Developer writes the code
Designer reviews UI/UX and accessibility
Product prioritizes based on user value
Each agent has a distinct personality and perspective. When you describe a feature, they discuss it from their angles before implementation begins. It’s like having a tiny product team inside your editor.
MCP: The Integration Layer
Model Context Protocol (MCP) is what makes Claude Code extensible. Pilos makes MCP setup painless:
GitHub — Create PRs, review code, manage issues
Supabase — Query databases, manage migrations
Jira — Read and update tickets from the conversation
Browser automation — Let Claude see and interact with your browser
Computer Use — macOS screen automation for visual tasks
Instead of hand-editing JSON config files, you toggle integrations on/off with a single click.
Tech Stack
Layer
Technology
Desktop
Electron
Frontend
React 19, Tailwind CSS, Zustand
Build
Vite, TypeScript
Terminal
xterm.js
Storage
better-sqlite3
AI
Claude Code CLI (spawned as child process)
The app spawns Claude Code as a child process and communicates via the CLI’s streaming output. This means you get the full power of Claude Code without any API abstraction layer.
Getting Started
Download:
macOS (.dmg)
Windows (.exe)
Linux (.AppImage)
Prerequisites: Claude Code CLI installed and authenticated.
Or build from source:
git clone https://github.com/pilos-ai/agents.git
cd agents
npm install
npm run dev
What’s Next
We’re actively building:
More MCP integrations (Linear, Notion, Slack)
Custom agent roles and personalities
Team sharing and collaboration features
Join the Community
GitHub — Star the repo, report issues, contribute
Discord — Chat with us and other users
Twitter/X — Follow for updates
If you’re using Claude Code and want a better desktop experience, give Pilos a try. And if you build something cool with it, I’d love to hear about it!
Pilos Agents is MIT licensed. The core is free and open source. Pro extensions (browser automation, computer use, Jira, Sentry) are available at pilos.net/pricing.
I recently had to urgently optimize resources across 200 servers in our environment. Our cloud provider doesn’t offer any built-in rightsizing or capacity optimization tools, and I couldn’t find a simple open-source solution focused specifically on CPU/RAM rightsizing based on Prometheus metrics.
The goal was simple:
Analyze historical usage
Calculate realistic resource requirements
Identify reclaimable CPU cores and RAM
The tool:
Pulls metrics from Prometheus
Calculates p95 CPU usage (non-idle cores, summed per instance)
Calculates p95 RAM usage
Applies a configurable safety margin (default 20%)
Ensures CPU minimum = 1 core
Rounds RAM to 0.5 GB
Generates:
Reclaim recommendations
Grow recommendations (if under-provisioned)
Provides a simple web UI to explore:
Total reclaimable CPU/RAM
Per-job breakdown
Per-host details
It supports:
Linux (node_exporter)
Windows (windows_exporter)
Architecture is intentionally simple:
Prometheus → Analyzer → JSON → FastAPI → Web UI
It’s not meant to replace full FinOps platforms — just a focused, practical tool for teams already using Prometheus.
GitHub: https://github.com/grachamba/prom-analyzer
Looking for feedback
Does the p95 + safety margin approach make sense in your environments?
In the realm of API development, GraphQL has emerged as a game-changer, offering a more flexible and efficient approach compared to traditional REST APIs. Let’s delve into the key aspects of GraphQL and how it transforms the way we interact with APIs.
What is GraphQL?
GraphQL is a query language for APIs that enables clients to request only the data they need, allowing for more precise and efficient data retrieval. Unlike REST APIs, where multiple endpoints dictate the structure of responses, GraphQL provides a single endpoint for querying data.
query{user(id:123){nameemail}}
Benefits of GraphQL
Efficient Data Fetching: Clients can specify the exact data requirements, reducing over-fetching and under-fetching issues.
Strongly Typed: GraphQL schemas define the structure of data, enabling better validation and type checking.
Multiple Resources in One Request: With GraphQL, multiple resources can be fetched in a single request, optimizing network efficiency.
GraphQL vs. REST
REST APIs
In REST APIs, each endpoint corresponds to a specific resource or action, leading to multiple endpoints for different data requirements. This can result in over-fetching or under-fetching of data.
GraphQL
GraphQL, on the other hand, allows clients to request exactly the data they need in a single query. Clients can traverse relationships between entities and fetch related data in a single request, enhancing performance.
Implementing GraphQL APIs
To implement a GraphQL API, you need a schema that defines the types and queries available. Tools like Apollo Server or Express-GraphQL can help set up a GraphQL server easily.
const{ApolloServer,gql}=require('apollo-server');consttypeDefs=gql`
type Query {
user(id: ID!): User
}
type User {
id: ID
name: String
email: String
}
`constresolvers={Query:{user:(parent,args,context,info)=>{// Resolve user data based on args.id}}};constserver=newApolloServer({typeDefs,resolvers});server.listen().then(({url})=>{console.log(`Server ready at ${url}`);});
Conclusion
GraphQL offers a paradigm shift in API development, empowering developers to build more efficient and flexible APIs. By embracing GraphQL, developers can streamline data fetching, reduce network overhead, and enhance the overall performance of their applications. Embrace the power of GraphQL and unlock a new era of API development!
When I first started learning Node.js, everything lived inside a single file.
Routes, business logic, and responses were tightly coupled — and it worked… until it didn’t.
At some point, my Express apps became hard to read, harder to test, and almost impossible to scale.
That’s when I truly understood why structure matters more than speed at the beginning.
Node.js is single‑threaded, but its event‑driven, non‑blocking nature is what makes it powerful.
Express makes HTTP handling simple — but MVC is what makes applications maintainable.
Why MVC actually helped me
MVC isn’t about adding layers for the sake of complexity.
Controllers handle request/response logic
Models represent data (not just databases)
Views render the output
A model can be a database, a file, or even an external API.
Once I separated these concerns, my code became:
Easier to reason about
Easier to test
Easier to extend without fear
A simple controller example
This article was brought to you by Kumar Harsh, draft.dev.
Where there is a CI/CD pipeline, there will be build logs. And while they’re important, anyone who’s stared at one knows the pain: thousands of lines of plain text, buried errors, and endless scrolling just to find out why something failed. What should be a quick diagnosis turns into a needle-in-a-haystack hunt.
Raw logs are useful, but they’re not enough. Developers don’t just need to know that a build failed; they need to know where, why, and how often it’s happening. That’s the difference between the text you read and the insights you act on.
In this article, we’ll look at how TeamCity goes beyond the build log. You’ll see how its structured log view, visual pipeline insights, and trend analysis help you navigate failures faster, spot performance regressions, and even anticipate recurring issues.
By the end, you’ll understand how TeamCity turns “just another log” into a tool for building better software faster.
The wall of text
Every developer has faced the dreaded wall of text. A build fails, and suddenly you’re staring at thousands of lines of console output. Somewhere inside is the clue you need: an error code, a failed test, or a timeout. But it’s buried under a flood of status messages and stack traces.
Searching helps, but you need to know exact keywords, and oftentimes you don’t know the exact error messages to search for. The longer the build, the longer its output, and the harder it gets to pinpoint issues.
Traditional CI systems don’t make this any easier. Take Jenkins. Its build logs are essentially flat text files. You can scroll, you can search, but there’s no real structure. A build step is just a line in the log, indistinguishable from all the noise around it.
If you want to know which step failed or how long each stage took, you’re left to manually scan through endless lines.
This lack of structure creates three major pain points:
Flat logs with no hierarchy: There’s no easy way to jump between stages and steps or to test the results
Zero visual cues: Errors don’t stand out. You have to read line by line.
Hard-to-trace correlations: Connecting a failing test back to its stage or seeing how long a step ran becomes a lengthy, manual exercise.
The result is that debugging builds becomes a time sink. Instead of focusing on fixing issues, you waste cycles just trying to interpret the logs yourself.
That’s the problem TeamCity set out to solve.
What does a TeamCity build look like?
TeamCity rethinks how build information is presented. Instead of forcing you to scroll endlessly through output text, it structures results in a way that’s easy to navigate, interpret, and act on.
Think of it as moving from a raw server console to a dedicated dashboard built for surfing through logs. The build results page is designed to be a living view of your pipeline, complete with context, hierarchy, and visual cues.
You can see the entire flow of a build at a glance, drill into specific steps with a click, and watch logs update in real time as the build progresses.
This shift to a logs “browser” instead of a logs “dumper” is what makes TeamCity different. It focuses on highlighting problems so you can spend more time fixing issues than searching for them.
How does TeamCity structure its logs differently?
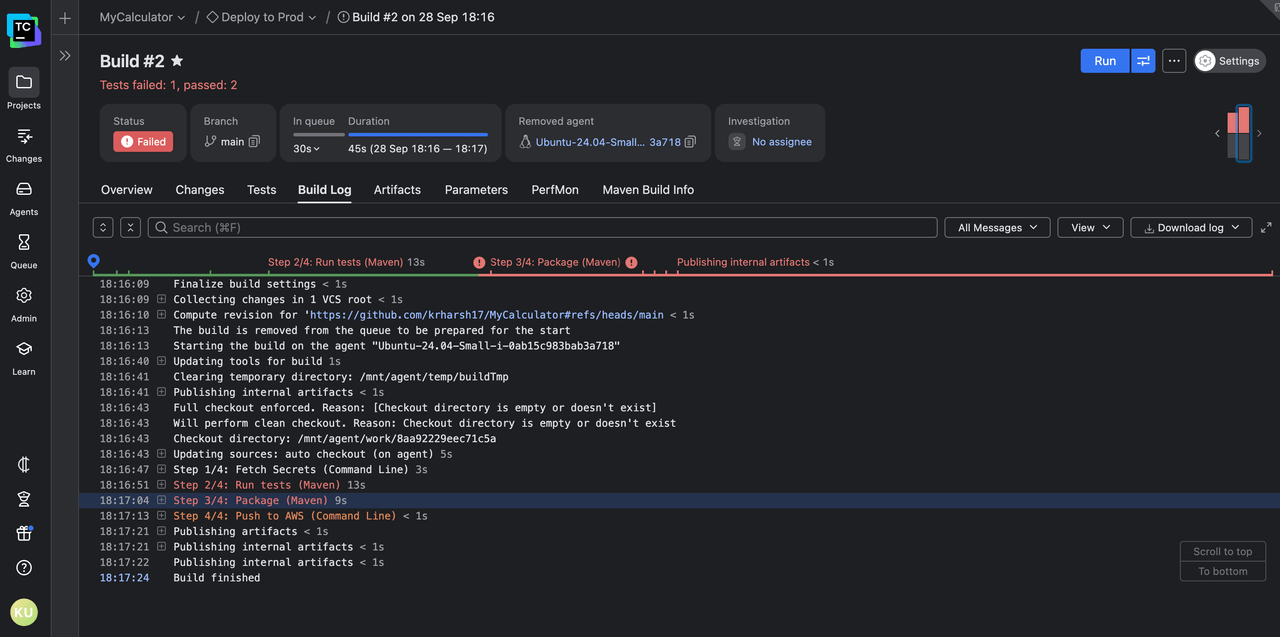
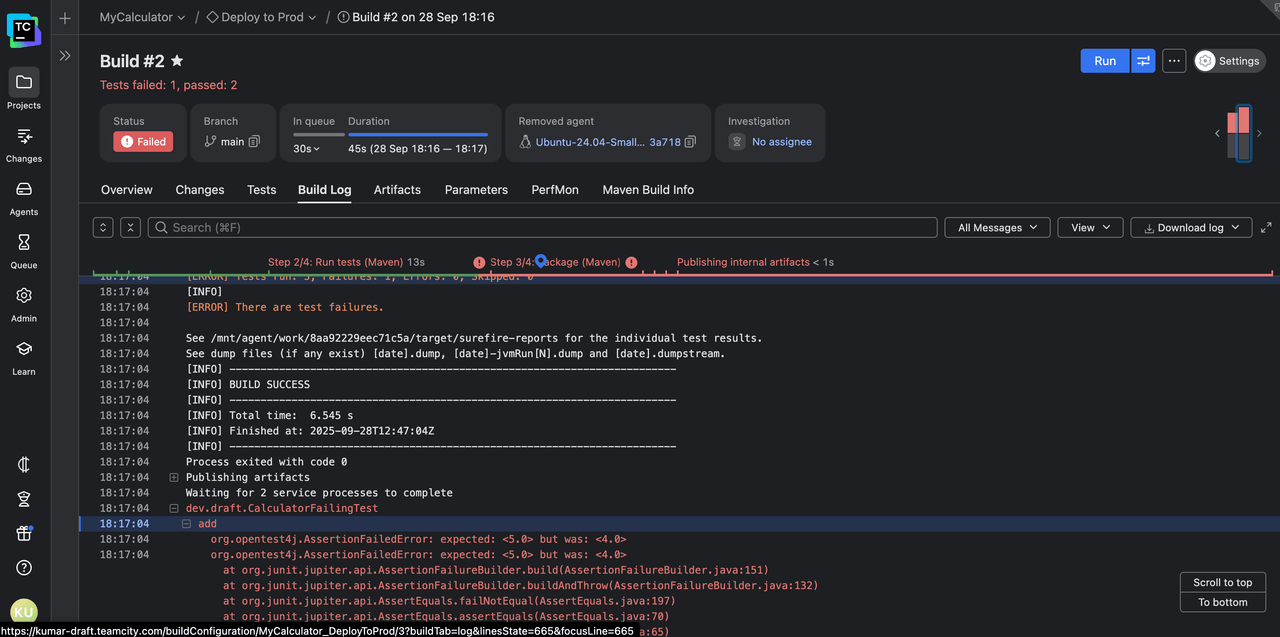
The first, most obvious thing you’ll notice in TeamCity is that logs aren’t just dumped into a giant text file. They’re organized hierarchically, following the natural flow of your pipeline.
Each layer is collapsible, which means you don’t have to scroll past hundreds of lines just to find the one step you care about.
Want to focus on a failing test step? Collapse everything else and zoom in on the problem area.
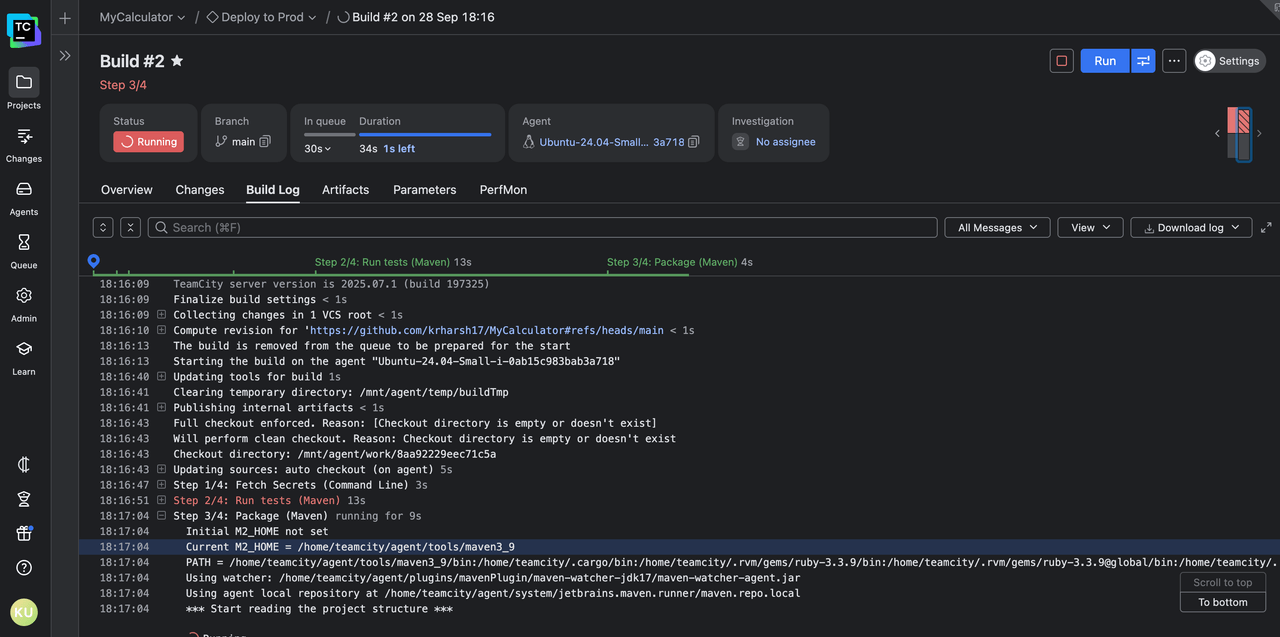
This structure also updates in real time. As your build runs, you can watch each step expand with fresh output while the rest of the log stays neatly tucked away. No more hunting for the latest lines in a never-ending scroll.
This means that, more often than not, you’ll pick up the error message and reason right in front of you as it happens instead of having to wade through lines after a build has failed and has dumped its logs.
How do TeamCity’s visual tools improve developer productivity?
Structured logs are a big step forward, but TeamCity doesn’t stop there. It layers visual context on top of the raw output, so developers can spot problems and patterns without needing to parse every line.
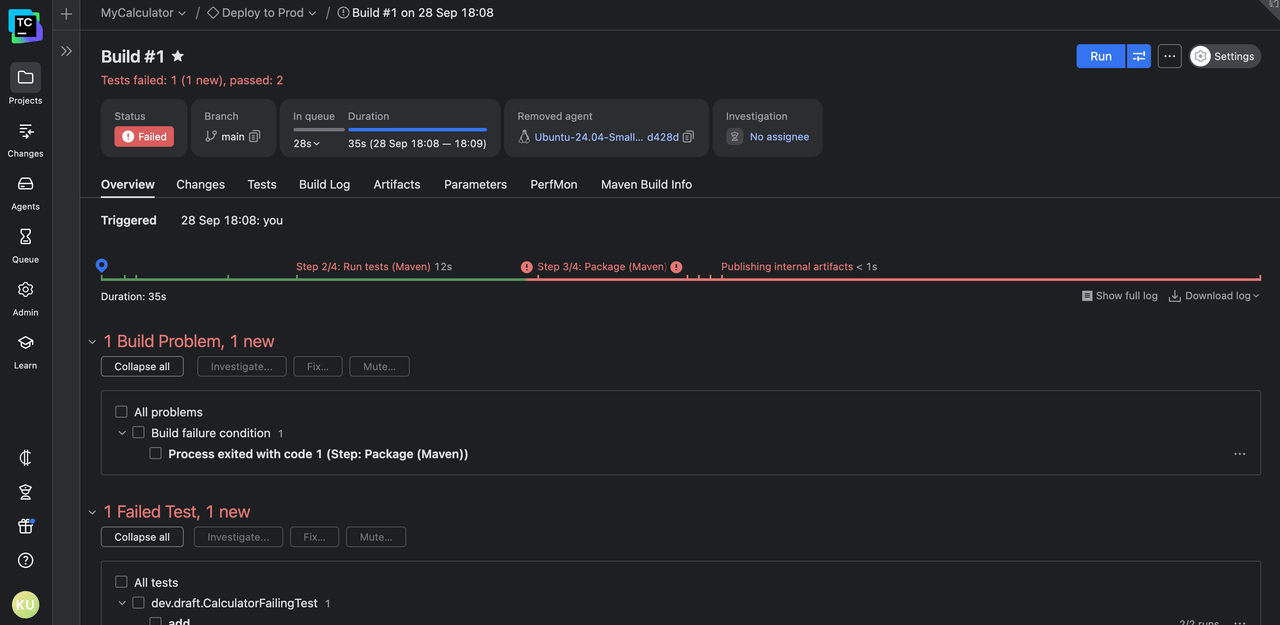
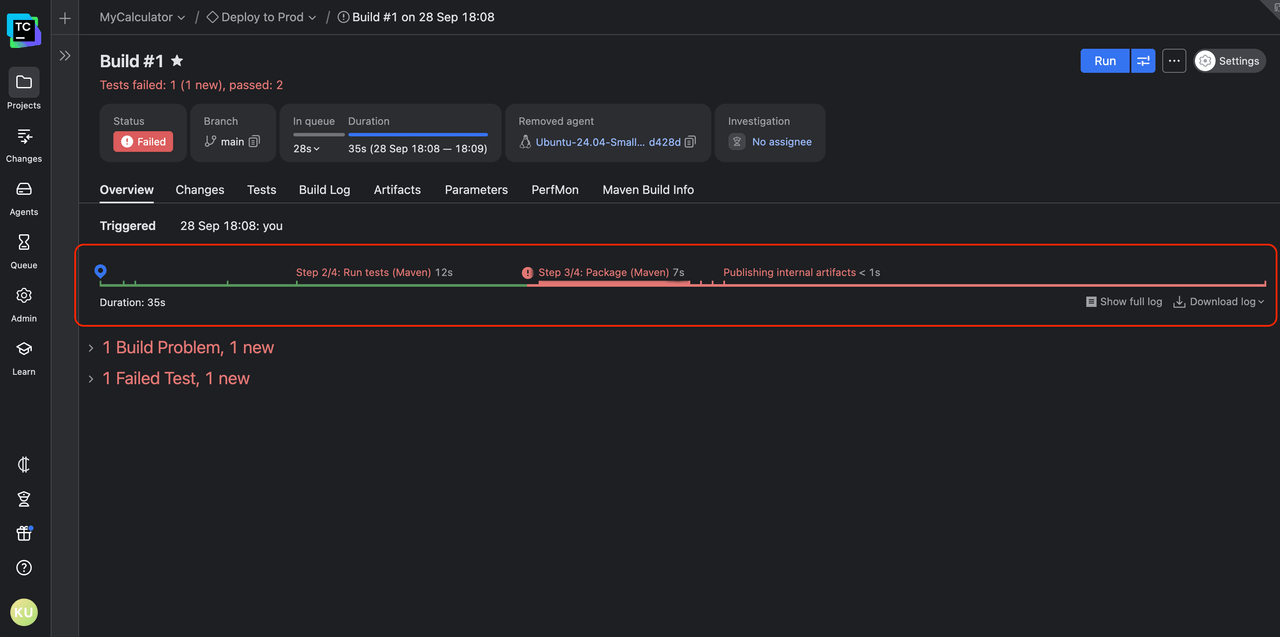
At a glance, you get a visual overview of the entire pipeline: each step, its status, and how long it took. This makes it easy to see whether a build failed fast or slowed down during a specific stage. Instead of you having to run a stopwatch in your head, TeamCity does the timing analysis for you.
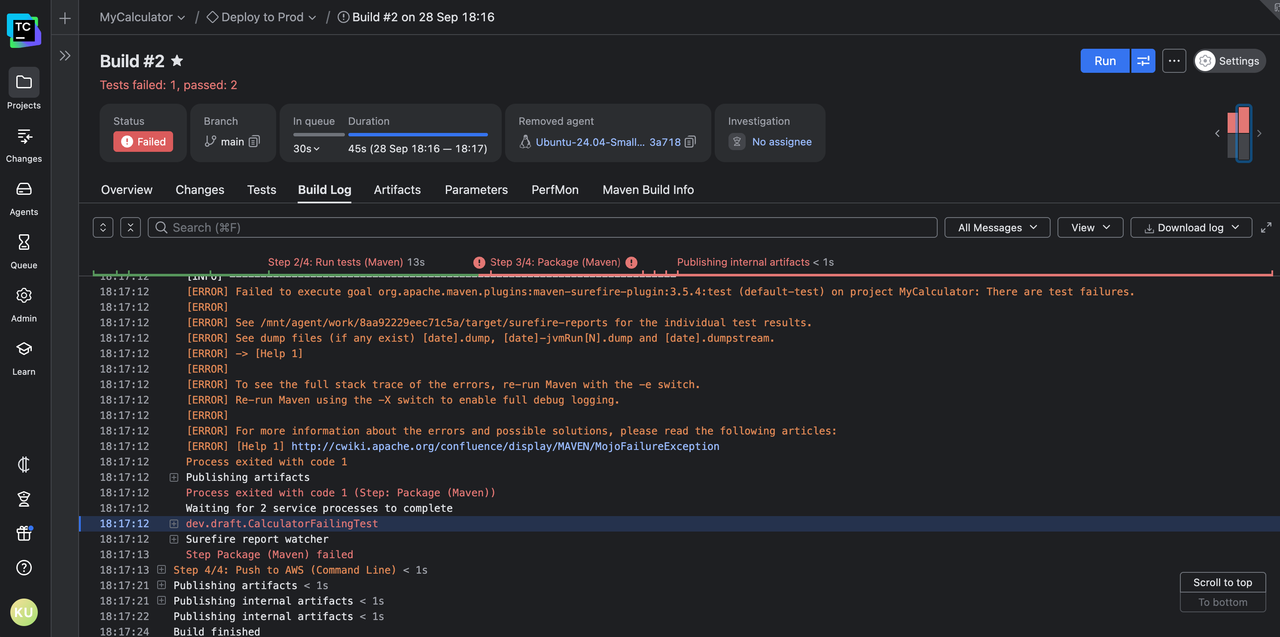
Also, errors are highlighted in context, so they stand out immediately. No scrolling through lines of green “success” messages just to find the single red flag buried at the bottom.
The failed step jumps out, both on the build timeline and the results page. Click on the timeline to quickly scroll to the error output line:
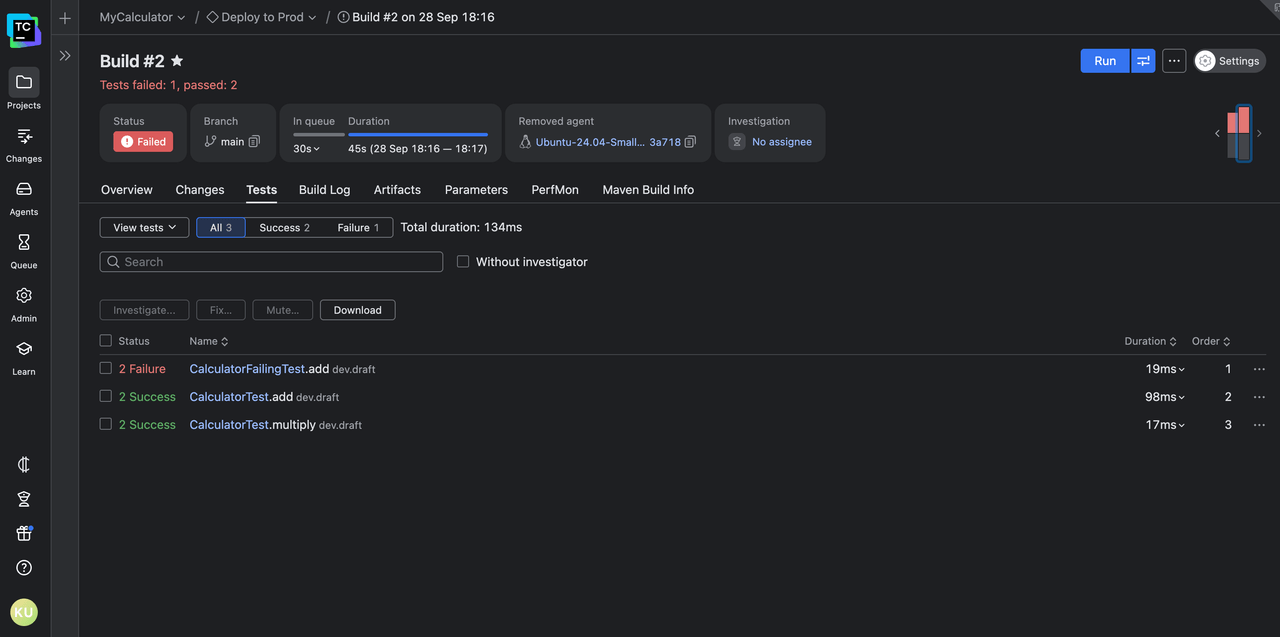
The Tests tab gives you detailed insight into how your tests performed across build steps:
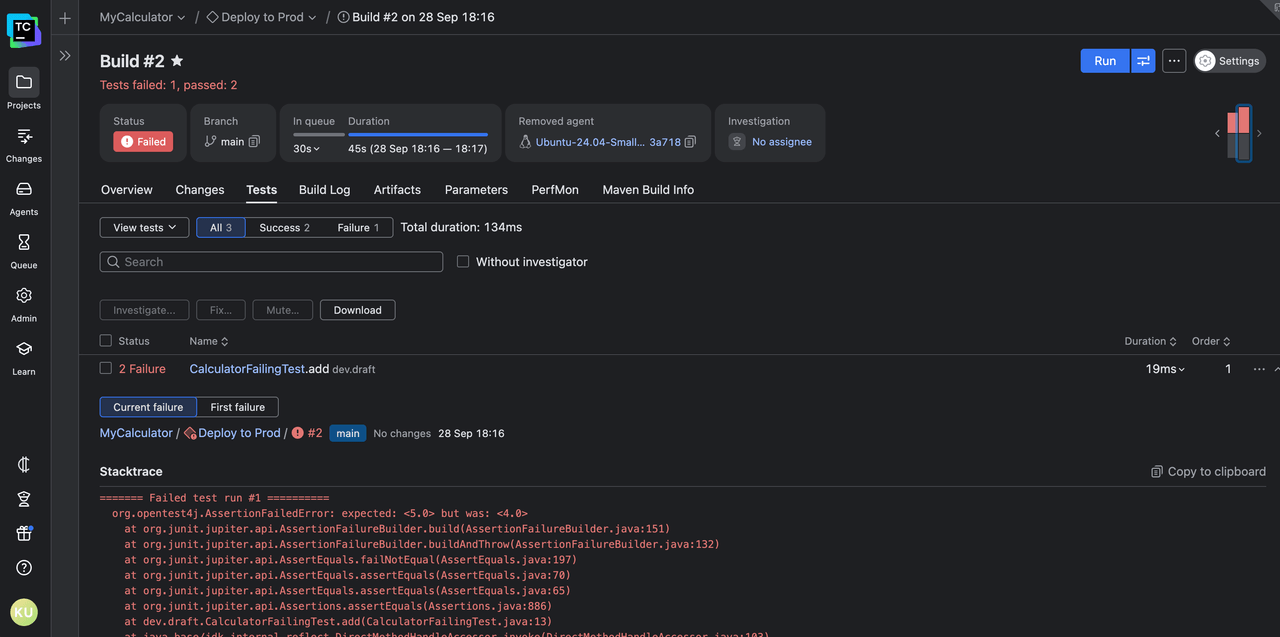
You can click on a failed test to see its output in the current run and the run where it failed for the first time:
And because builds rarely fail just once, TeamCity also gives you historical statistics for your builds. You can see trends across multiple runs, like how often your builds have failed across days or how often your tests have failed with each build.
What types of insights are considered “actionable”?
Not every log line deserves your attention – what you really need are insights that point directly to the next steps.
TeamCity’s build statistics help you surface exactly those kinds of actionable signals.
For example, if a build suddenly takes twice as long, TeamCity can help you pinpoint the slow step. You can set up charts for each step that show trends over time so you know whether it’s a new dependency, a misconfigured cache, or an overloaded test suite. Instead of guessing, you see the bottleneck right away.
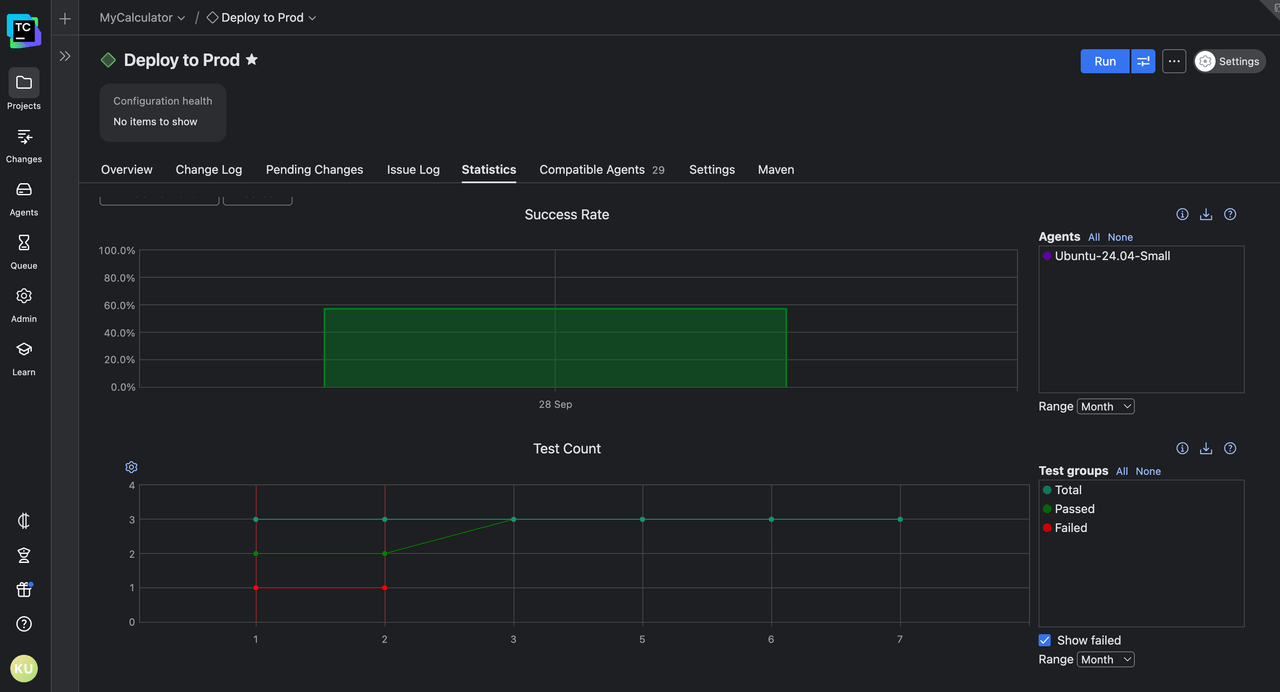
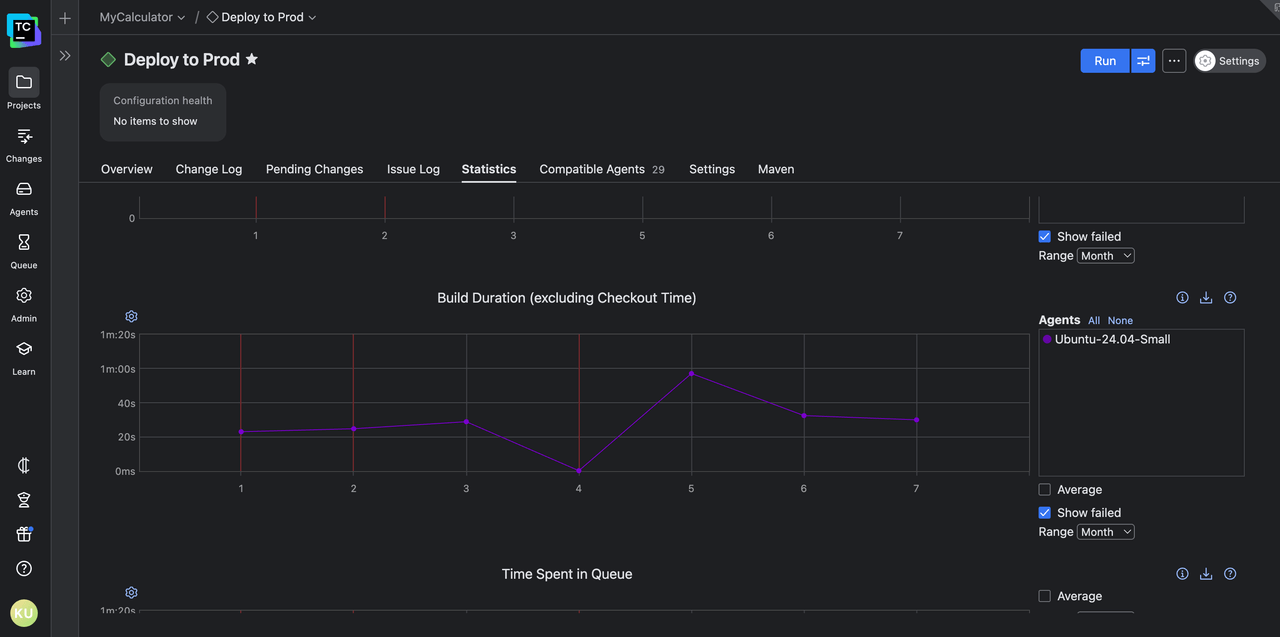
The following pipeline has had about seven builds so far, some of which failed as well. The build duration history looks like this:
As you can see, after build #4 failed, build #5 succeeded, but it took way longer than usual to complete. The issue was somehow resolved in the next two build runs, #6 and #7.
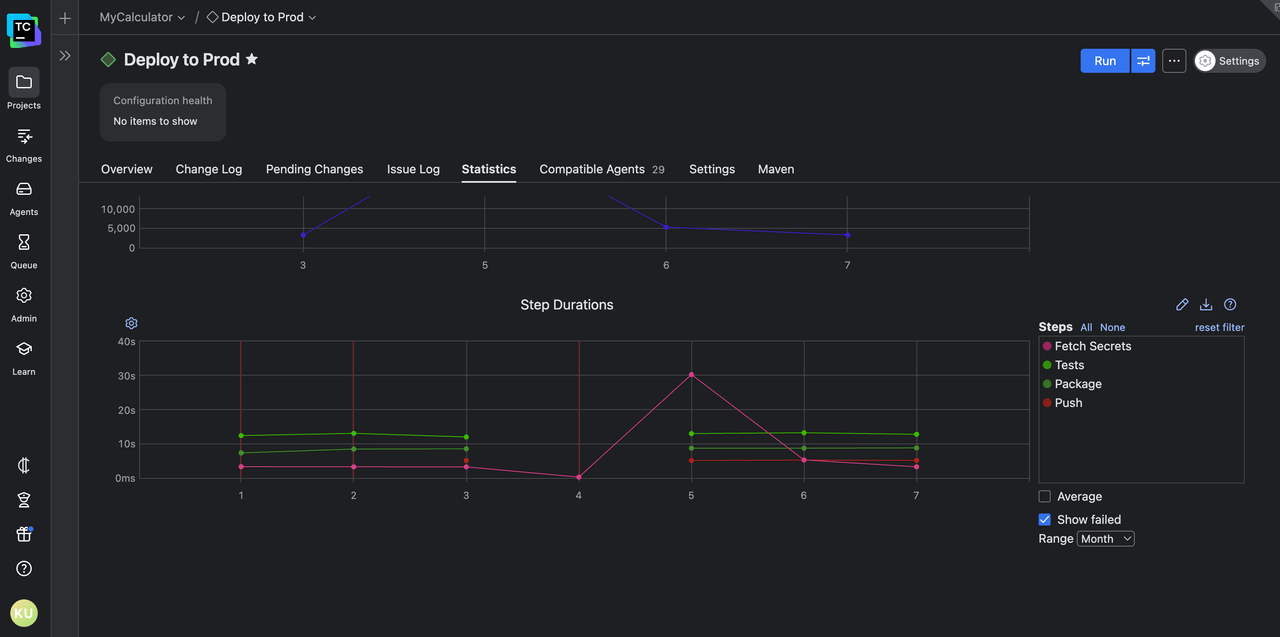
This seems unusual at first. However, when you look at the stepwise build duration history for the build configuration, you find this:
It’s clear that on build #5, the Fetch Secrets step took thirty seconds, which is way off from its usual two-to-five-second runtime. Since fetching secrets usually involves making network requests to a remote secrets manager, this could indicate an issue with your third-party secrets manager or with the network setup.
And you were able to narrow down the cause to the scope of a single step by looking at only two graphs.TeamCity also helps with other build-wide trends, like artifact size, block-level/class-level/line-level/method-level code coverage, time spent in the queue, and more.
You can see the full list of available statistics here. If you want to add a custom statistic for your pipeline, you can use service messages and easily create charts and graphs out of them.
What are the benefits?
So why does this matter for developers and teams working under pressure?
Faster root cause analysis: The most obvious benefit is speed. TeamCity’s structured approach means you spend less time hunting and more time fixing. In high-velocity environments where every minute of downtime delays releases, this faster feedback loop makes a tangible difference.
Understanding build performance: A failed test is one problem, but a slow build can be just as damaging. TeamCity’s step-by-step duration breakdown lets you spot build performance bottlenecks at a glance. Maybe a secrets fetch is dragging, or a test suite’s runtime has doubled. By surfacing this information, TeamCity gives you a starting point for optimization. You don’t just know that a build is slow; you know why it’s slow, and where to focus your efforts.
Detecting patterns and preventing repeats: Another benefit is pattern recognition. Builds rarely fail for the first time out of nowhere. Often, you’ll see the same flaky test appear intermittently across runs or the same misconfigured environment variable pop up in different branches. Traditional logs leave you to connect those dots manually, but TeamCity makes those patterns visible through historical comparisons.
Supporting proactive improvement: All these insights shift the developer mindset from reactive to proactive. Maybe you notice a steady increase in build duration, or memory consumption keeps varying without reason. TeamCity gives you the data to intervene before those issues become blockers.
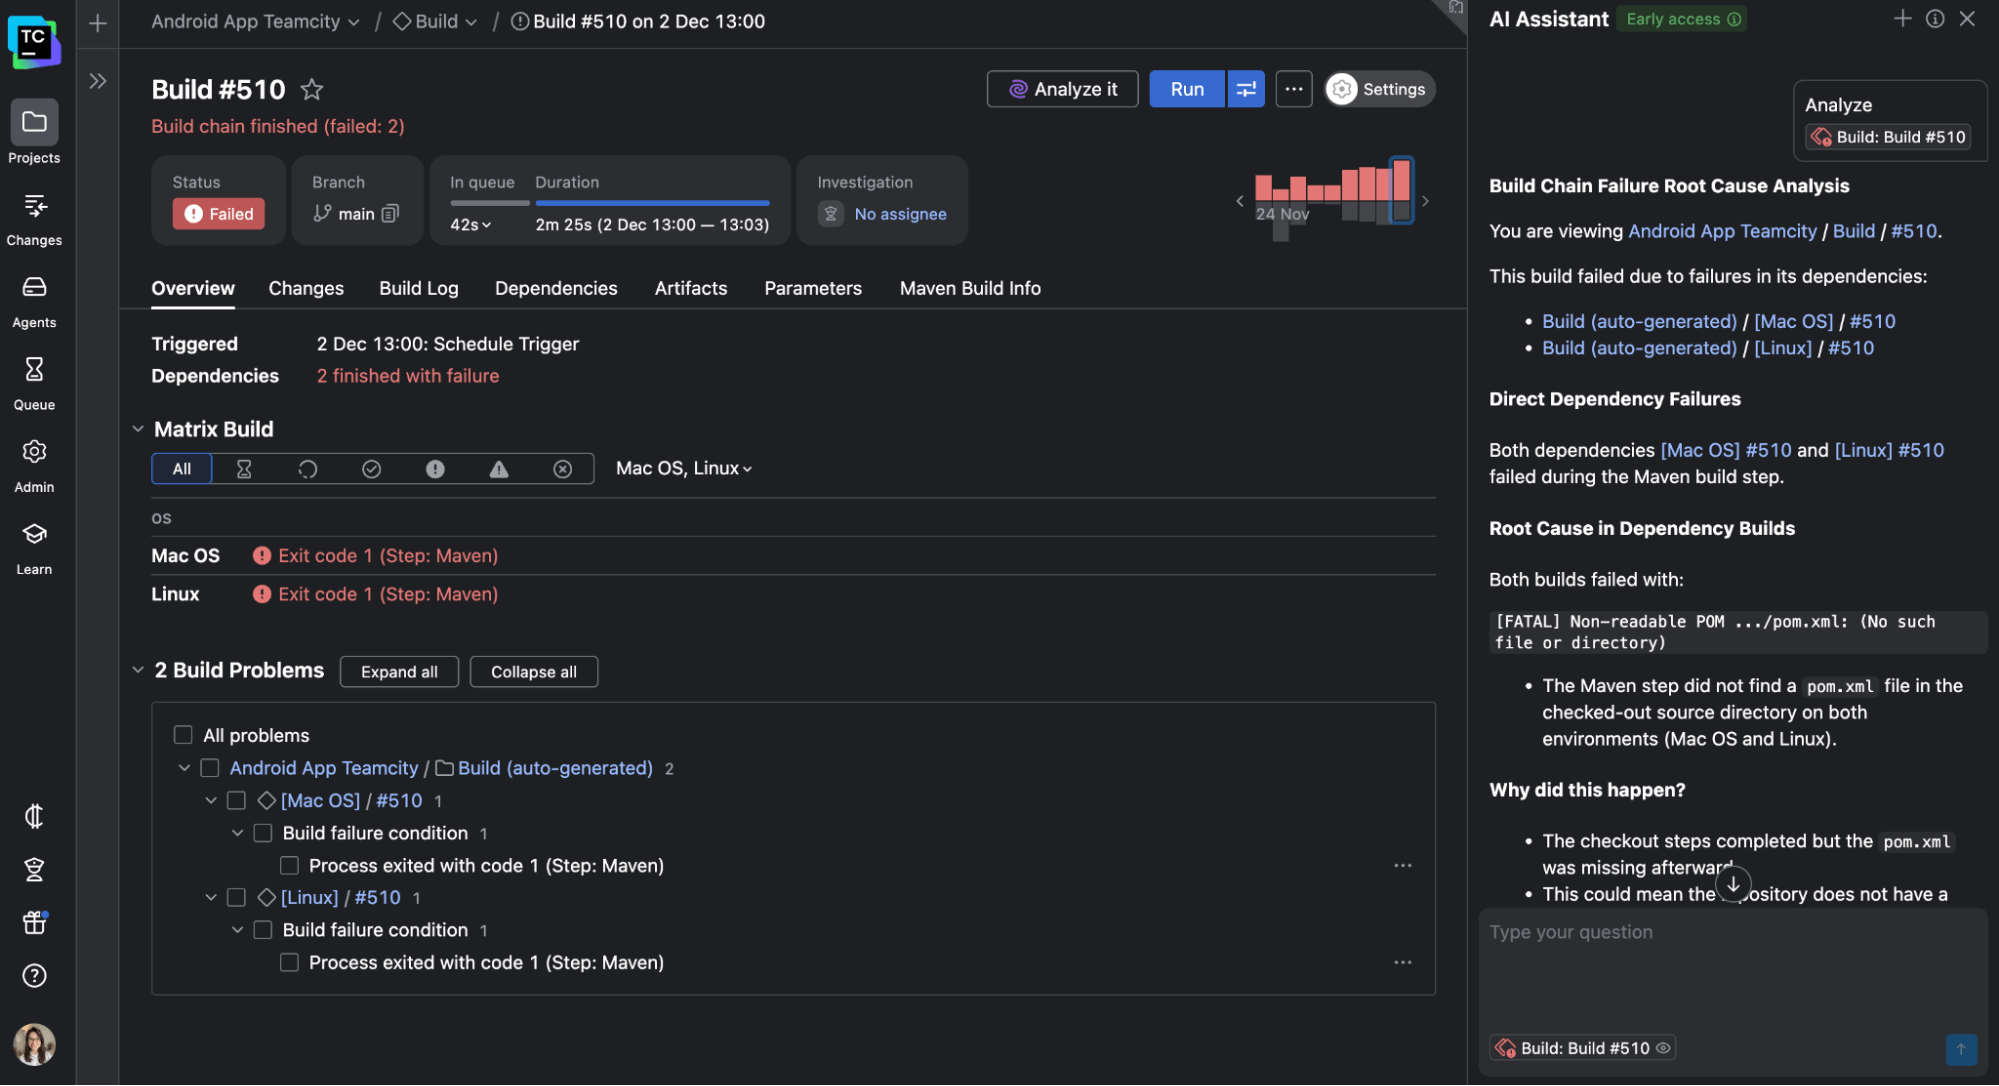
Laying the groundwork for AI-powered insights: TeamCity’s structured data and historical awareness lay the foundation for what’s coming next. For instance, the upcoming AI Build Analyzer will analyze builds from multiple angles to suggest likely root causes and possible fixes. You won’t just read logs anymore but collaborate with an intelligent system to solve problems even faster.
Conclusion
Build logs will always be an important part of CI/CD debugging workflows, but they aren’t enough on their own. Raw text logs leave developers to do the heavy lifting of interpretation, slowing down feedback loops and burying critical issues in noise.
What developers need are insights: structured, visual, and actionable signals that point directly to the next step.
That’s what TeamCity delivers out of the box. From hierarchical logs and visual pipeline overviews to historical trends and pattern detection, TeamCity turns builds into a source of continuous learning rather than just reactive debugging.
The result is faster root-cause analysis, improved build performance, and a smoother path from code commit to deployment. And with innovations like the new AI Build Analyzer, the future of build intelligence looks even brighter.