I’ve been a frontend dev for a few years now, and there’s a pattern I kept seeing across almost every small team I worked with.
New feature ships. Everyone’s happy. Then three days later something completely unrelated breaks and nobody caught it.
Not because the QA testers didn’t know what to test. They did. They had the test cases written, they understood the flows, they knew exactly what needed a smoke test after every deploy.
The problem was always the same: automating that required Playwright or Selenium, and that was “a dev thing”. And the devs were busy shipping the next feature. So the smoke tests stayed manual, got skipped when things got hectic, and eventually everyone just hoped nothing broke between sprints.
I watched this happen enough times that I started building something about it.
What I built
Flow Testing is a drag-and-drop builder that lets anyone; QA testers, PMs, whoever does the clicking create and run real Playwright tests without writing code. You connect nodes visually (navigate, click, fill, assert) and it runs against real browsers under the hood.
What’s working today:
Visual canvas with nodes for navigate, click, fill, assert
Runs on actual Playwright (Chromium, Firefox, Webkit)
Trace viewer with screenshots and network logs when something fails
API mocking for edge cases
AI Agents (Planner, Generator & Healer) still improving
Why I’m posting this
The product has a paid plan but I’m more interested in finding people who will actually use it and tell me what’s broken, what’s missing, or what doesn’t make sense.
If that’s you, free month on me. Just reach out.
https://flowtesting.io
Thanks to AI, I’ve spent more time architecting and building apps, which means I spend a lot of time looking at frontier models and agonizing over token use. I’ve also been battling a very modern affliction: token consumption anxiety.
It feels modern AI-powered app architecture is asking us slaps an LLM at the front door. You want to dynamically pick the best model for a specific task? Great, the industry standard is to call an expensive, heavy model just to decide if the prompt should go to Claude, Gemini, or a smaller open-source model. We are burning latency and spending tokens at near absurd levels.
I got tired of this cycle. I wanted a model picker with exactly zero models in the request path. So, I fired up Antigravity, let the AI (a trio of Gemini, Codex, and Claude) do the coding while I directed the architecture, and built a tool to solve my own headache.
The result is RightModel. It’s a tool that evaluates your task and recommends the ideal model—but the way it gets there is entirely different. Let’s walk through the architecture.
Handling the request
When you submit a task to RightModel, there are zero LLM calls in the default path. The system evaluates your parameters, computes the ideal model against a pre-existing ruleset, and returns the response instantly.
Here’s an example JSON snippet:
{"task_type":"code_generation","recommended_model":"claude-3-5-sonnet","reason":"High complexity context matched; tier 1 code model selected."}
Everything interesting happens before the request, not during it.
The “intelligence” at runtime
The core of the app is the ruleset. It contains task-type classification rules, model-tier mapping, and tie-breakers.
While I used AI to help author these rules initially, the final artifact is human-reviewable and human-owned. I’m not relying on an LLM to make a black-box runtime decision; I’m executing code.
Solving the staleness problem
The LLM landscape moves fast, so a static ruleset needs to keep up to date. To keep RightModel accurate without making live API calls during a user request, the app pulls fresh pricing data from OpenRouter via a scheduled workflow trigger via Google Cloud Scheduler. This scheduling can be done with another service, depending on the app architecture.
Notice what gets regenerated: the pricing data, not the rule logic. The logic remains a curated, human-authored layer. I also caution the user about this staleness directly with a footer stating exactly when the data was last refreshed, for transparency.
AI as an escalation path
Sometimes, requests don’t fit cleanly into a ruleset. A task might trigger an “ambiguous” or “low confidence” flag.
When this happens, RightModel doesn’t perform a silent fallback or an automatic, expensive upgrade. Instead, the user sees an explicit “Deep Analysis” button. This LLM call is powered by Gemini 2.5 Flash, but I plan to tweak this based on user feedback and technology updates.
Enter: Precomputed AI
Building this app made me realize this architecture isn’t isolated to picking models. A happy accident, really, and I’ve been calling this pattern Precomputed AI.
At its core, Precomputed AI shifts LLM reasoning out of the real-time request path and into an asynchronous build pipeline. It requires three specific properties, all of which power RightModel:
A versioned artifact (the ruleset)
A regeneration cadence (the pricing cron and visible staleness)
A declared escalation path (the Deep Analysis button)
What do you think?
If you’re shipping LLM-powered tools right now, I challenge you to ask yourself: which parts of your reasoning actually need to be live?
You can read more at the Precomputed AI website, and try out the RightModel app. I’d particularly value feedback from people creating AI-powered apps and solutions.
There’s a quiet shift happening in how AI tools interact with users, and most developers haven’t noticed yet, because just one week after the MCP Apps specs were published by Anthropic, OpenAI launched a huge marketing campaign around OpenClaw and they got all the attention, at least for a while.
For the past two years, every AI assistant has been stuck behind the same interface: a text box. You ask a question, you get text back. Maybe some markdown. Maybe a code block. Maybe an image.
Claude, GPT, Copilot, Gemini, every local model render into the same narrow pipe. MCP Apps change that.
What MCP Apps actually is
MCP Apps is a protocol extension that lets MCP tool results include interactive UIs. Actual interactive components running inside the AI host’s sandbox.
The mechanics are straightforward:
Your MCP tool returns a structuredContent payload alongside the normal text content
The host loads a ui:// resource (an HTML page you provide) into a sandboxed iframe
The host forwards the tool result to your iframe via postMessage using a JSON-RPC 2.0 protocol (ui/* methods)
Your renderer mounts the UI inside the iframe
The UI can call tools back, send messages to the conversation, request display mode changes, and resize itself
The text content still serves LLM reasoning and hosts without rendering support. The UI is a progressive enhancement. Let’s be honest: natural language is not always the most convenient or fastest way to express a desire. A click or a tap on a button can be much faster.
The spec behind it
The MCP Apps protocol (spec version 2026-01-26) is an official extension to MCP maintained by Anthropic. It defines a JSON-RPC 2.0 message layer over postMessage between a sandboxed iframe and its host. The spec covers:
Handshake: ui/initialize request/response with protocol version negotiation, app capabilities, and host capabilities
Sizing: ui/notifications/size-changed (reactive, from app to host), ui/notifications/preferred-size (declarative hints)
Security: CSP via _meta.ui.csp on resource content items, Permission Policy for camera/microphone/geolocation/clipboard
The spec is deliberately renderer-agnostic. It defines how the host and the iframe talk to each other. What you put inside the iframe is entirely your choice. The host doesn’t parse your component tree or validate your DOM structure. It sends you JSON-RPC messages and expects JSON-RPC messages back.
This is a deliberate design decision and the reason multiple rendering approaches can coexist. The Anthropic ext-apps SDK, a prefab renderer, a raw React app, a Svelte component — all valid. The protocol doesn’t care.
Current host implementations:
Host
Status
Notes
VS Code Copilot Chat
Shipping
Full spec support, CSP via <meta> tag, acquireVsCodeApi() transport
Claude Desktop
Shipping
Full spec support, CSP via HTTP headers on sandboxed origin ({hash}.claudemcpcontent.com). Can send results before init completes
ChatGPT
Shipping
Full spec support, CSP via HTTP headers on sandboxed origin ({slug}.oaiusercontent.com)
Three independent hosts shipping the same protocol make apparent that this is not a proposal, but infrastructure.
Why this matters
Here’s the thing I think people are going to underestimate: this turns every MCP server into a full-stack application.
An MCP server is already a backend that exposes typed tools over stdio or HTTP. It already has access to databases, APIs, file systems. The only thing missing was a frontend.
Now it has on that lives inside the AI conversation, gets tool arguments and results pushed to it automatically, can call tools back on its own MCP server via the host, inherits the host’s theme for free, and works across VS Code, Claude Desktop, ChatGPT, and anything else that implements the spec.
That last point is the critical one. Write once, render everywhere. The protocol is the same across hosts. The sandboxing model is the same. The postMessage bridge is the same.
Two different things driven by the same idea
MCP Apps is going to do to AI tooling what PWAs were supposed to do to mobile apps. PWAs were competing against native apps that users already loved. MCP Apps are filling a vacuum. There is no existing standard for rendering interactive UIs inside AI conversations. The alternative is pasting JSON into the chat. MCP Apps are going to be “AI Native Apps”.
The bar is low. And the protocol is good enough.
What it looks like in practice
Here’s a complete MCP tool that returns an interactive patient list with search, sorting, and click-to-view detail:
import{display,autoTable,Column,H1}from'@maxhealth.tech/prefab'asyncfunctionlistPatients(args){constpatients=awaitdb.query('SELECT * FROM patients')returndisplay(Column({gap:6},[H1('Patients'),autoTable(patients),]),{title:'Patient List'})}
display() wraps the component tree into the MCP wire format. The host renders it. The table is interactive — search, sort, row selection — without writing any frontend code.
But you don’t even need to compose components. The auto-renderers infer the right UI from your data shape:
import{display}from'@maxhealth.tech/prefab/mcp'import{autoTable,autoChart,autoForm,autoMetrics,autoDetail}from'@maxhealth.tech/prefab'// Array of objects -> searchable, sortable tablereturndisplay(autoTable(patients))// Array with numeric fields -> line/bar chart with axes and tooltipsreturndisplay(autoChart(salesData,{xAxis:'month',title:'Revenue'}))// Schema fields -> validated form that submits back to an MCP toolreturndisplay(autoForm([{name:'name',label:'Name',required:true},{name:'email',label:'Email',type:'email'},{name:'role',label:'Role',type:'select',options:['admin','user']},],'save_user'))// Key-value object -> formatted detail cardreturndisplay(autoDetail({name:'Alice',status:'active',lastSeen:'2026-04-30'}))// Object with numeric values -> metric cards with labelsreturndisplay(autoMetrics({patients:1284,appointments:47,waitTime:'12min'}))
Each auto-renderer picks columns, axes, labels, and formatting based on what it finds in the data. You pass an array or object, you get a production-quality UI back. When you outgrow them, you drop down to the component API and build exactly what you want.
And when you want to tweak the look without writing full custom components, every element accepts utility classes:
The built-in CSS ships ~200 Tailwind-compatible utility classes (padding, margin, flex, grid, gap, typography, colors, borders, shadows, max-height, overflow). No Tailwind dependency, no build step, no purge config. They’re there in the 15KB stylesheet that the CDN serves alongside the renderer.
Three levels of control: auto-renderers for zero-config, utility classes for visual tweaks, full component API for complete custom UIs.
The HTML renderer is only 80kB in size and imported by a single script tag:
ui/initialize handshake. ui/notifications/tool-result for pushing data. ui/notifications/size-changed for responsive layout. ui/open-link for navigation. ui/message for sending messages back into the conversation. All JSON-RPC 2.0 over postMessage.
Anyone can build a renderer against this protocol. React, Svelte, vanilla JS, raw DOM manipulation. The host sends JSON-RPC messages to an iframe and expects JSON-RPC messages back. Your rendering stack is your business.
This is why I think MCP Apps will win where similar attempts failed. It’s a host protocol that allows any rendering approach, and that makes adoption straightforward on both sides.
What’s missing
It’s early. The spec is dated 2026-01-26. Here’s what’s still rough:
CSP implementation varies by host. All hosts read _meta.ui.csp from the content item returned by readResource, but the enforcement mechanism differs. VS Code injects a <meta> tag. Claude Desktop and ChatGPT enforce via HTTP headers on a sandboxed origin. The spec standardizes the declaration format, but you should test your CSP config against each host you target.
No standard component format. The protocol defines the transport, the payload is up to you. Every renderer invents its own component schema. (We use a $prefab JSON wire format, but nothing stops someone from using entirely different components.)
Permission Policy support varies. Camera, microphone, geolocation, clipboard-write access via iframe allow attribute. Hosts report what they support in hostCapabilities.sandbox.permissions, but not all hosts honor all permissions yet.
Buffering and timing are tricky. Claude Desktop can send tool-result before the ui/initialize response arrives. If your renderer doesn’t buffer, you lose the first result. This took us several hours to debug.
These are solvable problems. The architecture is sound.
The prediction
Within 12 months, we will see a market emerging around MCP Apps.
MCP Apps hosts will compete on rendering quality, theme support, and permission handling. MCP servers will compete on UI polish. And the protocol will quietly become the standard that holds it all together. MCP Hosts potentially replace the need for an internet browser.
When a job fails on an HPC cluster, your first instinct might be to rerun it and hope for a different outcome. That rarely works. The real answers are almost always sitting quietly in your job logs.
Understanding how to read those logs effectively can save hours of guesswork and help you fix issues faster and more confidently.
Start With the Basics: Exit Codes
Every job finishes with an exit code. This is the simplest signal of what happened.
0 means success
Non-zero values indicate failure
In Slurm, you will often see something like:
ExitCode=1:0
The first number is the job’s exit status, and the second is the signal. If the signal is non-zero, it usually points to something more abrupt, like a kill or crash.
Check Standard Output and Error Files
Slurm writes logs to files like:
slurm-<jobid>.out
Or custom paths defined in your job script:
#SBATCH --output=job.out #SBATCH --error=job.err
These files are your primary source of truth.
stdout shows normal program output
stderr shows warnings, errors, and crashes
Always read stderr first when debugging.
Look for the First Error, Not the Last
A common mistake is focusing on the last line of the log. In reality, the root cause often appears much earlier.
For example:
File not found: input.dat Segmentation fault (core dumped)
The segmentation fault is just a consequence. The missing file is the real issue.
Memory Issues: Subtle but Common
Memory problems show up in different ways depending on how the system enforces limits.
Typical signs include:
Out Of Memory
Killed
oom-kill event
In Slurm, you might also see:
slurmstepd: error: Detected 1 oom-kill event(s)
If this happens, your job likely exceeded its allocated memory. Increase --mem or optimize memory usage.
Node-Level Failures vs Application Errors
Not every failure is your fault.
Application Errors
Segmentation faults
Python tracebacks
Missing libraries
These point to issues in your code or environment.
System or Node Issues
Block device required
I/O error
Node unreachable messages
These suggest problems with the compute node, filesystem, or scheduler.
If multiple jobs fail on the same node, it’s a strong signal of a node issue.
Environment and Dependency Problems
A job might fail simply because something isn’t loaded.
Look for:
command not found module: not found libXYZ.so: cannot open shared object file
These errors usually mean:
Missing modules
Incorrect environment setup
Wrong software versions
Double-check your module loads and environment variables.
MPI and Multi-Node Clues
For parallel jobs, logs can get noisy. Focus on patterns:
Rank-specific failures
Communication errors
Timeouts
Examples include:
MPI_ABORT was invoked NCCL error connection timed out
These often point to network issues, misconfiguration, or mismatched libraries.
Timing and Resource Clues
Sometimes the issue isn’t a crash, but inefficiency or limits.
Look for:
Jobs stopping exactly at walltime
Slow startup or long idle times
Uneven resource usage
Slurm accounting tools like sacct and seff can complement logs and give a clearer picture.
Build a Debugging Habit
Instead of reacting randomly to failures, follow a consistent approach:
Check exit code
Read stderr from top to bottom
Identify the first real error
Correlate with resource usage and job settings
Verify environment and dependencies
Over time, patterns become familiar, and debugging gets faster.
Final Thoughts
Logs are not just noise. They are structured clues about what went wrong and why.
The more time you spend understanding them, the less time you waste guessing. In HPC environments, that difference matters.
Strategy docs that live in Notion or in a slide deck rarely affect day-to-day decisions, because nobody reads them at the moment a decision happens. LLM agents have the same problem in a worse form: they reinvent generic best practice every session.
STRATEGY.md as code is the pattern of writing strategy as a file the agent must load before acting. Persona, USP, brand voice, goals, operation mode, and explicit constraints become inputs to the LLM’s reasoning, not slides for a quarterly review.
The pattern generalizes. INCIDENT_RESPONSE.md for SREs, INVESTMENT_THESIS.md for funds, THREAT_MODEL.md for security teams — anywhere the local rules differ from the generic best practice an LLM was trained on, a contract file closes that gap.
I have a Notion page from 2024 titled “FY24 Marketing Strategy”. It is 18 pages. Three people on the team can find it. Two have read it. One read it once, then forgot it existed. Last quarter we made a budget reallocation decision that contradicted page 7 of that document, and it took six weeks for someone to notice.
This is the normal state of strategy documents. They are written to be approved, not to be consulted. The act of writing them is what the organization wants; the act of reading them is what nobody has time for. The Notion page exists so that, in a future meeting, somebody can say “as discussed in our strategy doc”. It does not exist so that, on a Tuesday afternoon when you are deciding whether to bid on a competitor’s brand term, you reread page 7.
LLM agents inherit this problem and make it worse. Every new chat session starts from zero context. The agent has read the entire public internet but knows nothing about your business. Ask Claude or ChatGPT a question about your ad account, your codebase, or your investment thesis, and it will helpfully return whatever the average answer to that kind of question looks like. “For a B2B SaaS account, you should consider…” Yes. For a B2B SaaS account. Not for mine.
The fix is not “prompt better”. The fix is to write the business-specific constraints down in a file the agent loads at the start of every session, and to design the agent’s tools so that constraints in that file are evaluated against the actions it proposes. Strategy as a contract, not a deck. That is what STRATEGY.md as code means in practice.
What goes in the file
The shape that has held up for me, after writing this kind of file for an ad-ops product (mureo) and watching agents use it across a few hundred sessions, is six sections. Each one is a different kind of constraint on what the LLM is allowed to recommend.
Persona answers “who are we selling to”. The agent reads this and stops generating ad copy aimed at the wrong audience. Without a persona, an LLM defaults to the median small business; with one, it speaks to a specific buyer.
USP answers “what is the differentiator”. The agent reads this and stops recommending tactics that flatten the differentiator into commodity competition. If your USP is “the only one with X”, the agent should not be suggesting price-led headlines.
Brand voice answers “how do we sound”. This one is the easiest to underestimate. An LLM with no brand voice constraint produces text that sounds like an LLM. With three sentences of “no exclamation marks, no superlatives, no metaphors about journeys”, the output stops sounding generic.
Goals answer “what numbers matter and by when”. A goal is Target | Deadline | Current | Priority. The agent reads this and prioritizes the metric you actually care about, not the metric most legible on a dashboard.
Operation mode answers “what is the current posture”. I use seven values internally: ONBOARDING_LEARNING, TURNAROUND_RESCUE, SCALE_EXPANSION, EFFICIENCY_STABILIZE, COMPETITOR_DEFENSE, CREATIVE_TESTING, LTV_QUALITY_FOCUS. The exact set is less interesting than the fact that there is a set, with rules about which actions each mode permits. Mode is what flips an agent from “find new keywords to test” to “do not change anything, the algorithm is still learning”.
Constraints answer “what is forbidden, and why”. This is where the document earns its keep. Generic best practice plus your specific exceptions. The constraints section in our demo STRATEGY.md for a fitness-app account, for example, contains three rules:
1. No competitor-name bidding on either platform.
   Past attempt cost JPY 600K/quarter and produced 8 subscriptions
   at JPY 75K CPS — 16x worse than baseline.
2. Conversion campaigns optimize for "Subscribed" (paid signup),
   never for "Started trial". Trial-volume optimization trains the
   ad platforms toward shallow signups whose downstream trial-to-paid
   rate falls below the 12% quality floor.
3. Meta Lookalike stack capped at 3 active variants, and the
   variants must be 1%, 2%, 5% (or smaller). Past stacking of LAL 7%
   and 10% caused audience overlap, frequency above 8x, and CTR
   collapse within 14 days.
A vanilla LLM has no idea about any of those rules. They are the residue of past mistakes. Each rule has a number and a reason attached, because rules without reasons get ignored the moment they look inconvenient. With this file loaded, the agent has access to the same accumulated organizational scar tissue that a senior team member would carry in their head — and unlike that team member, the agent loads it on every single decision.
What “as code” actually changes
A document is read by humans, sometimes. A contract file is loaded by an agent, always. The difference is mechanical: the file goes through a tool call into the LLM’s context window before any reasoning happens.
In mureo’s case, v0.8.0 (released 2026-05-02) shipped five MCP tools that expose STRATEGY.md and STATE.json to the agent — mureo_strategy_get, mureo_strategy_set, mureo_state_get, mureo_state_action_log_append, mureo_state_upsert_campaign. The names are boring on purpose. What matters is the side effect: any host that speaks MCP — Claude Desktop chat, Cowork, the web UI, any of them — can now read the strategy file without needing direct filesystem access. Read and write. The agent can also propose updates to the strategy when the human says “we just changed our quarterly target”, and the file moves with the conversation.
The reason this matters more than “the agent reads a markdown file” might suggest: most LLM hosts outside Claude Code do not have Read and Write filesystem tools. If your strategy lives in a local file, the agent in the chat window literally cannot see it. Exposing the file through an MCP tool is the bridge. The contract becomes part of the agent’s input regardless of which client it is talking to.
The other thing that moves once the file is a contract: the agent’s recommendations stop being LLM-generic. Concretely, here is what /daily-check produces today against a synthetic D2C cosmetics scenario where Meta CPA has spiked because of a broken Pixel:
The single biggest story: Meta CPA is 5.2x Google CPA — well past the STRATEGY.md “50% sibling-channel divergence ⇒ diagnose before more spend” tripwire — and three prior manual cuts have worsened the curve.
Google Ads (last 30d): blended CPA ¥2,054. Healthy.
Meta Ads (last 30d): blended CPA ¥10,714 against a ≤¥4,500 target.
Recommend: run /rescue (pixel / Conversions API audit) on Meta. Hold all Meta bid/budget moves until divergence is diagnosed.
Read that closely. The agent quoted a constraint by name — “50% sibling-channel divergence ⇒ diagnose before more spend” — that exists nowhere outside of this account’s STRATEGY.md. A vanilla LLM looking at the same numbers would tell you Meta CPA is high and suggest pausing underperformers. That is exactly what the human manager in the demo did, three times over twenty-five days, and it made things worse, because pausing a campaign whose tracking is broken does not fix the tracking.
The contract was the thing standing between the LLM and the same mistake.
A second example, less dramatic, more typical
The seasonality-trap demo is the loud kind of failure. The strategy-drift demo is the quiet kind, and honestly the more important.
A subscription fitness app. STRATEGY.md says no competitor bidding, optimize for Subscribed not Trial, cap Meta Lookalike at three variants. A new growth manager joins on Day 30 and, over the next month, violates each rule. They launch a “Competitor Names” campaign. They flip the Meta optimization target from Subscribed to Started Trial. They add LAL 4%, 7%, 10% on top of the existing 1%, 2%, 5%.
None of the three actions appears in the dashboard as red. The competitor campaign generates apparent volume. The optimization swap inflates the result count because trials are easier than subscriptions. The bigger Lookalike stack reaches more people. Each violation is paired with a better-looking surface metric. The action_log in STATE.json shows zero new entries since Day 30. That silence is itself the diagnostic signal, because the strategy says all actions must be logged.
mureo’s STRATEGY-vs-STATE compliance audit walks the constraints, reads the campaign list, and produces a violation report with start dates and JPY-impact estimates. Not because the agent is clever. Because the rules and the state are both in files the agent can load, and “is rule N violated?” is a check the agent can perform mechanically. The cleverness is upstream — in the decision to write the rules down with reasons attached, instead of relying on tribal knowledge that the new manager never absorbed.
I find this scenario more useful for explaining the pattern than the seasonality one. Loud failures get caught eventually; the manager will eventually realize their cuts are not working. Quiet drift compounds for months because the surface metrics keep looking fine. A contract file is the only thing that catches it.
Where else the pattern fits
Marketing is not special here. Anywhere an LLM agent operates and the local rules differ from the generic best practice it was trained on, the contract pattern works.
For SREs running incident response, an INCIDENT_RESPONSE.md codifies severity classification, escalation chains, the postmortem template, and the explicit anti-patterns (“do not page the on-call DBA for read replica lag below 30 seconds — it self-resolves”). An on-call agent reading that file at the start of a page makes calibrated decisions instead of fashionable ones.
For an investment fund, an INVESTMENT_THESIS.md codifies the thesis itself, position sizing rules, sell triggers, and the kind of trade the fund refuses to make regardless of expected value. An agent doing pre-meeting prep with that file in context surfaces concerns that match the fund’s actual operating principles, not LinkedIn’s.
For a security team, a THREAT_MODEL.md lists assets in priority order, threats per asset, and the mitigations already in place. An agent triaging a CVE alert can compare it against the model and decide whether the vuln matters for this threat surface, not whether it is generally bad.
The shape under all three is the same: a file the agent loads, written in a format the agent can parse, containing the local rules that overrule generic best practice. The format does not have to be markdown. It has to be loadable, parseable, and short enough that loading it does not blow the context window.
The hardest part is not the format. It is convincing yourself to write the rules down, with reasons attached, instead of trusting them to live in three senior people’s heads.
What does not work
Honest limitations, because the pattern is not magic.
The contract is exactly as good as the human who wrote it. A vague STRATEGY.md produces vague reasoning. “Be data-driven” is not a constraint. “Do not change bids on a campaign whose 7-day conversion volume is below 30 unless the action_log shows two prior weeks of stable spend” is a constraint. The first one cannot be checked; the second one can.
Tacit knowledge still escapes. A senior ad ops person knows the brand without writing it down. They know not to bid on certain compound terms because of a regulatory issue from 2019 that nobody bothered to document. The agent does not know any of that. Writing those things down is the work, and most of the work happens after the first version of the file ships, when the agent makes a recommendation that violates an unwritten rule and the human has to either correct the agent or update the file. The file gets better; the unwritten rules shrink.
A grounded agent is not automatically a careful agent. The agent can quote the constraint and still recommend a bad action — confident-sounding writing is the LLM’s default. The contract reduces a class of mistakes (generic recommendations that ignore local rules); it does not eliminate the meta-class of “LLMs are sometimes confidently wrong”. Approval gates and rollback paths still matter; the contract is the input layer, not the safety layer.
The file has to be maintained. A STRATEGY.md that lasts a year without edits is either a stable business or a neglected file. Most are the second one. The fix is to make the agent propose edits and the human approve them — mureo_strategy_set exists for that — but the discipline of actually doing it through quarterly review still has to come from a human who cares.
A small thing, if you want to try the pattern
Pick the smallest constraint your team has paid for in past mistakes. One sentence. Write it down with a number attached and a one-line reason. Put it in a file your LLM-using tooling can read at the start of a session. See if the next decision the agent surfaces is meaningfully different.
If it is, you have the start of a contract. Add a constraint per week as new edges of “the agent gave a generic answer that does not fit our context” become visible. Within a quarter you will have something a senior teammate could read and say “yes, that is how we actually operate”. At which point you have something the LLM can also read.
mureo is one implementation of this pattern, focused on ad ops. The repo is at github.com/logly/mureo; the strategy doc format is in docs/strategy-context.md, the demo scenarios that exercise it live in mureo/demo/scenarios/. I would be more interested in seeing the pattern picked up outside marketing than in seeing more marketing-specific implementations of it. If you build an INCIDENT_RESPONSE.md or INVESTMENT_THESIS.md flavor of the same idea, I am at @yoshinaga on X — show me what you ended up with.
Choosing between PyTorch and TensorFlow isn’t about finding the “better” framework – it’s about finding the right fit for your project. Both power cutting-edge AI systems, but they excel in different domains. PyTorch dominates research and experimentation, while TensorFlow leads in production deployment at scale.
The frameworks have evolved significantly since their early days, each building tools and capabilities to support research and production. Despite these improvements, fundamental differences remain in their philosophies, ecosystems, and ideal use cases, which will naturally influence which framework will best fit your project.
This guide examines where each framework shines, compares them across key dimensions, and helps you choose the right tool for your natural language processing, computer vision, and reinforcement learning projects.
What sets PyTorch and TensorFlow apart?
PyTorch and TensorFlow took different approaches from day one. Google launched TensorFlow in 2015, focusing on production deployment and enterprise scalability. Meta released PyTorch in 2016, prioritizing research flexibility and Pythonic development. These roots still shape each framework today.
The key difference between the two lies in computational graphs. PyTorch uses dynamic graphs that execute operations immediately, making debugging natural – you use standard Python tools and inspect tensors at any point. TensorFlow originally required static graphs defined before execution, though version 2.x now defaults to eager execution while retaining optional graph compilation for performance.
Market data shows TensorFlow holds a 37% market share, while PyTorch commands 25%. But the research tells a different story: PyTorch powers 85% of deep learning papers presented at top AI conferences.
PyTorch: Strengths and weaknesses
PyTorch’s Pythonic API treats models like regular Python code, making development feel intuitive from the start. The framework’s dynamic computational graphs execute operations immediately rather than requiring upfront model definition, fundamentally changing how you approach debugging and experimentation.
This design philosophy has made PyTorch the dominant choice in research, where flexibility matters more than deployment infrastructure. However, this research-first design means production deployment tools remain less mature than TensorFlow’s enterprise infrastructure.
PyTorch strengths
Intuitive, Pythonic API: Models use standard Python syntax with minimal framework-specific concepts, reducing the learning curve dramatically compared to other frameworks.
Dynamic graphs enable natural debugging: Set breakpoints in training loops, inspect tensor values mid-execution, and modify architectures on the fly using tools you already know.
Priority access to the latest techniques: Because of its research dominance, when cutting-edge architectures or methods emerge, they’re implemented in PyTorch before anywhere else.
Strong ecosystem: Libraries like PyTorch Lightning handle training loops and best practices automatically, letting you focus on model architecture.
PyTorch weaknesses
Production deployment tools are less mature: Deployment options lag behind TensorFlow’s battle-tested infrastructure, so you need to do more setup work for production systems.
Mobile and edge deployment is limited: PyTorch Mobile is functional but less polished than TensorFlow Lite for smartphones and IoT devices.
Dynamic nature complicates optimization: The flexibility that aids development can make optimization for production performance harder without additional tools like TorchScript.
Smaller enterprise adoption: Fewer production patterns and case studies compared to TensorFlow’s extensive enterprise documentation.
TensorFlow: Strengths and weaknesses
TensorFlow’s production ecosystem provides you with a comprehensive infrastructure for deploying models at scale. Google built the framework specifically for enterprise environments where reliability, performance, and deployment flexibility matter most.
This production-first approach created mature tooling for serving, mobile optimization, and MLOps that PyTorch is still catching up to. The trade-off comes in development experience – TensorFlow’s API can feel more complex and less intuitive than PyTorch’s streamlined approach.
TensorFlow strengths
Mature production deployment tools: Battle-tested infrastructure with TensorFlow Serving for high-throughput serving, TensorFlow Lite for mobile, and TensorFlow.js for browsers.
Superior mobile and edge optimization: TensorFlow Lite delivers industry-standard performance and comprehensive device support for smartphones and edge devices.
Strong enterprise adoption: Proven production patterns used by thousands of companies, with extensive documentation for scaling systems serving millions of predictions.
Comprehensive MLOps tooling: TensorFlow Extended (TFX) gives you end-to-end pipelines for production ML workflows, from data validation through model monitoring.
TPU support for large-scale training: Access to Google’s specialized Tensor Processing Units for training at massive scale with performance advantages over GPU infrastructure.
TensorFlow weaknesses
Steeper learning curve: More complexity when implementing custom models or debugging issues, even with Keras integration simplifying high-level operations.
More verbose code for custom work: Novel architectures or training procedures require significantly more code compared to PyTorch’s streamlined approach.
Larger, less cohesive API: Broader API surface with multiple ways to accomplish the same task creates confusion and longer learning curves.
Debugging can be challenging: Graph-related issues may require you to understand TensorFlow’s internal execution model despite eager execution improvements.
Slower adoption of research techniques: New methods from research papers typically take longer to appear in TensorFlow compared to PyTorch.
If you’re new to TensorFlow and want a hands-on starting point, check out How to Train Your First TensorFlow Model in PyCharm, where you’ll build and train a simple model step by step using Keras and visualize the results.
PyTorch vs. TensorFlow: Head-to-head comparison
Choosing between PyTorch and TensorFlow isn’t always straightforward, and there are many factors to consider.
The table below provides a high-level head-to-head comparison of PyTorch and TensorFlow so you can quickly assess which framework generally fits your needs. We’ll later consider project-specific scenarios and provide a detailed decision matrix to guide your choice.
Dimension
PyTorch
TensorFlow
Learning curve
Easier: Pythonic and intuitive
Steeper: more complex API despite Keras
Debugging
Excellent: standard Python tools work naturally
Good: improved with eager execution
Production deployment
Improving: TorchServe and TorchScript available
Excellent: mature ecosystem (Serving, Lite, JS)
Research/experimentation
Dominant: 85% of deep‑learning research papers
Present: but trailing PyTorch in adoption
Community ecosystem
Research-focused: Hugging Face, PyTorch Lightning
Enterprise-focused: TFX, strong cloud integration
Performance at scale
Strong: DDP for distributed training
Strong: graph optimization, TPU support
Industry adoption
Growing: used by 15,800+ companies
Established: used by more than 23,000 companies
PyTorch vs. TensorFlow for different use cases and applications
Your framework choice depends heavily on what you’re building. Here’s how PyTorch and TensorFlow stack up for major machine learning domains.
Natural language processing
PyTorch dominates NLP with no signs of slowing. The Hugging Face Transformers library – the de facto standard for working with language models – started as a PyTorch-only framework and later added TensorFlow support as a secondary option. When you’re fine-tuning transformers, implementing custom attention mechanisms, or experimenting with novel architectures, PyTorch’s flexibility accelerates your iteration.
Verdict: PyTorch leads NLP decisively. Choose TensorFlow only if you have specific mobile deployment requirements that override all other considerations.
Computer vision
Computer vision presents a more balanced landscape for your projects. PyTorch benefits from research momentum – when you’re developing novel detection algorithms or experimenting with architectures, you’ll find state-of-the-art implementations appear in PyTorch first. TensorFlow excels for building production CV systems, especially for mobile object detection or on-device image classification, where TensorFlow Lite’s optimization matters most.
For a hands-on example, watch this video on how to build a TensorFlow object detection app to see how to take a pre-trained model and turn it into a real-time object detection app running on a robot in PyCharm:
Verdict: Use case dependent. Choose PyTorch for research and novel architectures, TensorFlow when your deployment priorities favor mobile and edge devices.
Reinforcement learning
PyTorch holds a slight edge in reinforcement learning, driven by the research community’s preference for it. When you’re implementing custom RL algorithms, modifying reward functions dynamically, or debugging agent behavior, PyTorch’s flexibility serves you better. TensorFlow offers solid capabilities through TF-Agents for production RL systems at scale.
Verdict: Choose PyTorch for RL research and experimentation or TensorFlow for building large-scale production-grade RL systems like recommendation engines.
Tooling and developer experience in PyCharm
PyCharm provides comprehensive support for both frameworks, streamlining your development workflow regardless of which you choose.
Debugging: Set breakpoints in training loops, inspect tensor values, and step through model forward passes using the integrated debugger that works naturally with PyTorch’s dynamic graphs and TensorFlow’s eager execution.
Jupyter notebook support: Prototype in notebooks, inspect data transformations visually, then move to scripts for production training with seamless integration.
Package management: Handle complex dependency trees and CUDA requirements using virtual environment management to prevent conflicts between frameworks.
Remote interpreters: Connect to remote GPU servers, develop locally while training remotely, and sync code automatically to take advantage of powerful hardware without leaving your IDE.
TensorBoard integration: Track training metrics, visualize model graphs, and compare experiments within PyCharm using native TensorFlow support or torch.utils.tensorboard for PyTorch.
Code completion: Get framework-specific suggestions for layer definitions, optimizer configurations, and data pipeline operations that reduce errors and accelerate development.
Performance, scalability, and deployment
Training performance barely differs between frameworks for most workloads – both handle GPU training efficiently with comparable speeds. TensorFlow gains an edge when you need TPU support for large-scale training, offering more mature integration with Google’s specialized hardware. For multi-GPU scaling, both deliver strong performance with PyTorch’s DDP and TensorFlow’s MirroredStrategy.
Deployment scenarios differentiate the frameworks more clearly. TensorFlow Serving handles production model serving at scale with built-in versioning and A/B testing that PyTorch’s TorchServe can’t yet match in maturity. When deploying to mobile devices or edge hardware, TensorFlow Lite provides industry-standard optimization through quantization and pruning. For browser deployment, TensorFlow.js offers more integrated, optimized inference compared to serving PyTorch models via ONNX Runtime.
Memory management affects development experience – PyTorch’s caching allocator handles GPU memory efficiently with dynamic batch sizes, causing fewer surprises when experimenting with different model configurations.
Community, ecosystem, and library support
PyTorch’s research dominance created a vibrant, innovation-focused community that accelerates development. The PyTorch Conference 2024 saw triple the registrations versus 2023, and when cutting-edge techniques emerge, they appear in PyTorch first. The Hugging Face ecosystem amplifies this advantage – more than 220,000 PyTorch-compatible models versus around 15,000 for TensorFlow makes a tangible difference in development speed.
TensorFlow’s community skews toward production engineering, providing comprehensive enterprise-grade documentation and proven deployment patterns. Google’s backing ensures strong cloud platform integrations, particularly with Google Cloud, offering managed services that reduce operational complexity. The Model Garden provides production-ready implementations optimized for deployment rather than research experimentation.
Learning resources reflect these different audiences – PyTorch tutorials emphasize research workflows and novel implementations, while TensorFlow documentation prioritizes production deployment patterns and enterprise-scale systems.
Choosing the right framework for your project
Many successful teams use both frameworks strategically – researching and experimenting in PyTorch, then deploying in TensorFlow. The frameworks aren’t mutually exclusive. You can use ONNX to enable model conversion between them when needed.
When making a choice, it helps to prioritize factors most relevant to your project: Mobile deployment requirements may override other considerations, research-heavy work might make PyTorch essential, and enterprise support with MLOps integration could tip the scales toward TensorFlow.
Use the table below to match your project requirements with the framework strengths.
We ran the same coding tasks with and without prebundled tooling, across multiple models and languages. Here’s what changed.
Eval-driven development
IDE-native search reduced latency, cost, and budget overruns.
The comparison below uses paired task-level deltas. Aggregate medians and totals are shown for orientation. Budget overruns are tasks that exceeded the USD 0.50 per-task cap.
8.33% Median latency reduced 83.11s → 79.03s
16.44% P95 latency reduced 268.71s → 213.17s
5.60% Total cost reduced USD 44.17 → USD 41.67
33.28% Budget overruns reduced 6.67% → 4.44%
Why We Built This
When coding agents search code, they default to shell tools. grep and find work, but they’re blind to project structure, symbol boundaries, and language semantics. The agent burns tokens sifting through noisy output and making follow-up calls to narrow things down.
So we tried something obvious: what if the agent could use the IDE’s own search instead?
We built a prebundled skill that pairs a search prompt with a unified MCP tool. One tool, four modes: file search, text search, regex, and symbol lookup. A universal router dispatches calls to the right backend.
MCP Tools
Functions the agent calls via an MCP server during task execution. IDE-native tools can tap into indices, ASTs, and project models that shell tools cannot see.
Skills
Packaged agent behaviors: a prompt plus orchestration logic. A skill can work on its own, use tools, or ship bundled with the tools it needs.
Nothing ships by default until the eval says it should. We tested four different configurations of this tooling before picking one.
Methodology
The eval pipeline spins up an MCP server alongside the IDE so the agent has access to the configured tools and skills. We run identical coding tasks with and without tooling, then compare with paired delta analysis.
We track four things: quality, latency, cost, and budget discipline. Quality asks whether all tests passed. Latency tracks median and P95 task time. Cost converts token consumption into dollars. Budget discipline tracks how often a single task exceeds the USD 0.50 budget cap.
We report improvement deltas only when they pass our significance threshold: p < 0.05, paired test with 95% confidence intervals. Metrics without a significant change are either omitted from the charts or called out explicitly. We tried four configuration variants, selected the one with the best latency and cost tradeoff, then re-ran it on different models and languages to check that the results held.
Eval frame
Same tasks, same grading, one controlled difference.
Quality All-tests-passed rate, checked before performance claims.
Latency Median and P95 task duration, compared with paired deltas.
Cost Token use converted to dollars across the task set.
Budget discipline Share of tasks exceeding the USD 0.50 single-task cap.
Results
The selected configuration was a prebundled search skill plus a unified IDE-native tool and universal router. Compared with the no-tooling baseline, it reduced latency and cost without producing a statistically significant quality change.
Baseline vs. tooling
Absolute metrics moved in the right direction.
Median latency
Baseline83.11s
With tooling79.03s
P95 latency
Baseline268.71s
With tooling213.17s
Total cost
BaselineUSD 44.17
With toolingUSD 41.67
Budget overruns
Baseline6.67%
With tooling4.44%
Budget overruns
33.28%
P95 latency
16.44%
Median latency
8.33%
Total cost
5.60%
No statistically significant change in quality. All shown deltas passed the significance threshold.
Trace snapshots
The difference is visible in the agent’s path through the project.
These are shortened traces from cases that improved in both time and cost. The baseline spends more steps discovering context; the prebundled setup gets to the relevant files faster.
Service comments and replies
prompt Update service and controller layers for comments and replies.
before: no prebundled IDE search agent> list files -> search x2 -> list files x2 agent> jar inspect x5 -> javap -> jar inspect -> javap x5 agent> curl download -> decompile -> search -> find files x2 agent> read 9 files -> edit file x8 -> respond time: 472s
We tested four tool configurations before choosing the final shape. Lower latency and lower total cost are better, so the lower-left corner of the plot is the target.
Configuration search
The selected option had the best latency while preserving cost reduction.
Median latency, 78s to 84s Total cost, USD 39.50 to USD 45.00
We re-ran the experiment with GPT 5.4 on Java and Kotlin codebases. The pattern holds: latency and cost both drop. Kotlin saw the biggest cost improvement, with total cost falling 13.48%.
Cross-model check
The effect held beyond the original run.
Codex 5.2
Median latency8.33%
Total cost5.60%
P95 latency16.44%
GPT 5.4, Java
Median latency3.75%
Total cost4.07%
P95 latency13.00%
GPT 5.4, Kotlin
Median latency6.92%
Total cost13.48%
P95 latencynot significant
Missing bars mean that metric was not statistically significant for that model and language.
How Models Adopt Tooling
Codex sends 91% of its search calls through the new IDE-native tool. Claude is a different story: Opus uses it for about half its searches, and Haiku only 28%, preferring grep and find instead.
This makes sense. Claude already has strong built-in code search, so it leans on what it knows. Codex doesn’t, so it grabs the better tool when one is available. The takeaway: prebundled tooling fills gaps. Where the model already has good search, it adds less. Where search is weak, it makes a real difference.
Tool adoption
Models do not use new tools at the same rate.
Codex
91 8 1
Claude Opus
53 28 19
Claude Haiku
28 33 39
IDE Search grep find
What’s Next
The eval pipeline works. Now we’re using it.
We’re running the same experiment on smaller models next. Our hunch is that they’ll benefit even more, since they have less built-in search capability to fall back on.
The current results are strongest on Java and Kotlin. We’re expanding to Python, .NET, and TypeScript with bigger sample sizes.
Meanwhile, the winning configuration is being prepared for the integrated IntelliJ IDEA MCP Server, so agent sessions can use IDE-native tooling when the server is enabled.
The next step is to turn this feature on by default in upcoming AI Assistant plugin updates.
Want to try it before the default rollout?
Set these registry keys to true: llm.chat.agent.codex.mcp.idea, llm.chat.agent.skills.settings.enabled, and llm.agents.contrib.bundled.skills.sync.enabled.
In AI Assistant, choose Codex for the best results.
Ask the agent to find something across the current project.
Put a capable coding model inside a developer’s primary workspace, and the IDE stops being a place where you write code. It becomes a place where you direct an agent, watch how it reasons, manage what it pays attention to, and decide when its output is worth shipping. That was the defining theme of the inaugural JetBrains x Codex Hackathon: across roughly 40 submissions over a single weekend, teams explored what it actually means to build with AI natively inside the IDE – not bolted on top of it. The six finalists came up with some of the most compelling answers.
🥇 First Place: hyperreasoning – Aditya Mangalampalli
Most coding agents call the model once and hope for the best. As Aditya puts it: “LLMs spend a lot of time thinking in circles.” Hyperreasoning replaces the single shot with something closer to a search: the system drafts several possible approaches to a task, then a learned controller decides which to expand, which to cut, and which to verify against tests. Compiler errors and failing tests feed back into how the controller weighs its options.
Inside the IDE, a tool window renders the search live, so you can watch which paths the controller explored before settling on one. The argument the project makes is that a smaller local model wrapped in this kind of verified search loop can hold its own against much larger frontier models at meaningfully lower cost — with the IDE serving as the place where reasoning becomes visible and directable, rather than a black box that returns code.
🥈 Second Place: Scopecreep – Bhavik Sheoran, Kenneth Ross, Roman Javadyan, Joon Im
Hardware bring-up is a tool-juggling exercise: schematic viewer in one window, vendor apps for the oscilloscope and power supply in others, a terminal talking to the device, a spreadsheet collecting results. Scopecreep collapses that into a single JetBrains tool window. Hand it a circuit schematic and an agent works through testing the board – picking signals worth measuring, capturing the readings, and producing a report.
The design choice worth noticing: when the agent decides a probe needs to be placed, the session pauses and shows the engineer exactly where to put it. The engineer places the probe physically and clicks Resume. It’s the right call for real instruments on a real bench – autonomous, where a computer can be trusted, human-in-the-loop, where the work touches the physical world.
🥉 Third Place: mesh-code – Ayush Ojha, Coco Cao, Kush Ise, AL DRAM
Switch machines mid-task, and your coding agent starts over. mesh-code fixes that by giving agents shared memory of an in-progress project – what’s been tried, what’s been decided, what’s still pending – so a session that begins on one laptop can continue from another, with whichever agent happens to be available. Codex is one of the agents that can plug in.
Latent Signal – Periscope
Long agent sessions accumulate dead weight: tool outputs nobody needs anymore, dead ends, context that was useful ten turns ago and isn’t now. Periscope, built on Wes McKinney’s open-source agentsview, is a JetBrains plugin that shows what’s actually filling up an agent’s working memory turn by turn – and recommends what to do about it, whether that’s continuing, rewinding to a better branching point, compacting, forking, or handing off entirely. It works with Codex and most other coding agents, and everything stays local.
SecureLoop – Abhiram Sribhashyam, Rahul Marri, Peyton Li
Security incident response is still mostly copy-paste: stack trace into a chat window, repo context explained by hand, a fix written and committed in the hope it’s safe. SecureLoop turns that into a controlled loop inside JetBrains. When something breaks in production, the agent gathers the relevant code, the project’s security rules, and the state of its dependencies, then asks Codex for a structured diagnosis and a proposed fix. That fix runs through automated checks before any pull request opens.
The PR opens automatically. The merge does not. SecureLoop surfaces everything that informed the decision – the diff, the policy it bumped into, the test that proved the patch – inside the IDE for the developer to approve or reject. As the team put it: “Codex fully makes the PR ready for you, and it remains human-in-the-loop where you have to approve or deny.”
The team’s bigger thesis is a security-policy.md file that lives in the repo alongside README.md, spelling out a project’s specific rules for handling secrets, errors, and risky patterns. Coding agents read it before suggesting changes, so the question stops being “what’s a good fix?” and becomes “what’s an acceptable fix under this codebase’s rules?”
Pinpoint – Het Patel
Frontend feedback delivered through a chat window is unavoidably vague. “Move that element” or “change that color” leaves the agent guessing which element you actually mean. Pinpoint takes that piece of the ambiguity off the table: developers drop pins directly on a live page, attach a comment to each, and send the whole batch to the agent with precise on-page context attached. The agent now knows exactly which element you meant – even if it still has to figure out what change you want.
The project ships in two pieces: one for annotating web pages in a browser, and a desktop companion for marking up anything visible on screen – useful when the interface in question isn’t a web page.
What the finalists show
Looking across these six projects, a clear pattern emerges. Codex embedded in the IDE isn’t just a faster way to write code – it’s a reasoning layer you can watch think, a structured output engine you can direct, a participant in workflows that span hardware instruments, production alerts, shared session state, and context windows. And the IDE becomes the place where all of that comes together: visible, controllable, and version-controlled.
That’s the possibility these teams spent a weekend proving out, and it’s only the beginning.
Hi everyone! April brought exciting community news with the announcement of the Golden Kodee finalists, along with Kotlin and tooling releases, multiplatform progress, and fresh backend resources. I also came across the new Kotlin Professional Certificate on LinkedIn Learning, which is a great way to build your skills. And if you want something more playful, I found a fun way to practice coroutines. Here are the stories that stood out to me most.
Kodee-Approved Spotlight
KotlinConf 2026 is almost here
KotlinConf 2026 is just around the corner, and the excitement is definitely building. On May 20–22, more than 2,000 Kotlin developers from around the world will gather in Munich to share ideas, learn from each other, and connect. If you cannot make it in person, you can still join online – the conference will be livestreamed on the Kotlin YouTube channel. I’ll be there in Munich, but I definitely recommend tuning in to catch the key announcements and talks as they happen.
Join KotlinConf
Golden Kodee finalists
The Golden Kodee finalists have been announced! The top three nominees in each category will be invited to KotlinConf in Munich, where one winner in each category will receive a Golden Kodee award. It is a great way to celebrate people who share knowledge, organize events, inspire others, and help grow the Kotlin community.
Meet the finalists
Kotlin release updates
April brought two Kotlin release updates. Kotlin 2.4.0-Beta2 offers an early look at what’s coming next across the language, the standard library, the JVM, Kotlin/Native, and the compiler. Kotlin 2.3.21 focuses on performance improvements and bug fixes for the 2.3 release.
See what’s new in Kotlin 2.4.0-Beta2
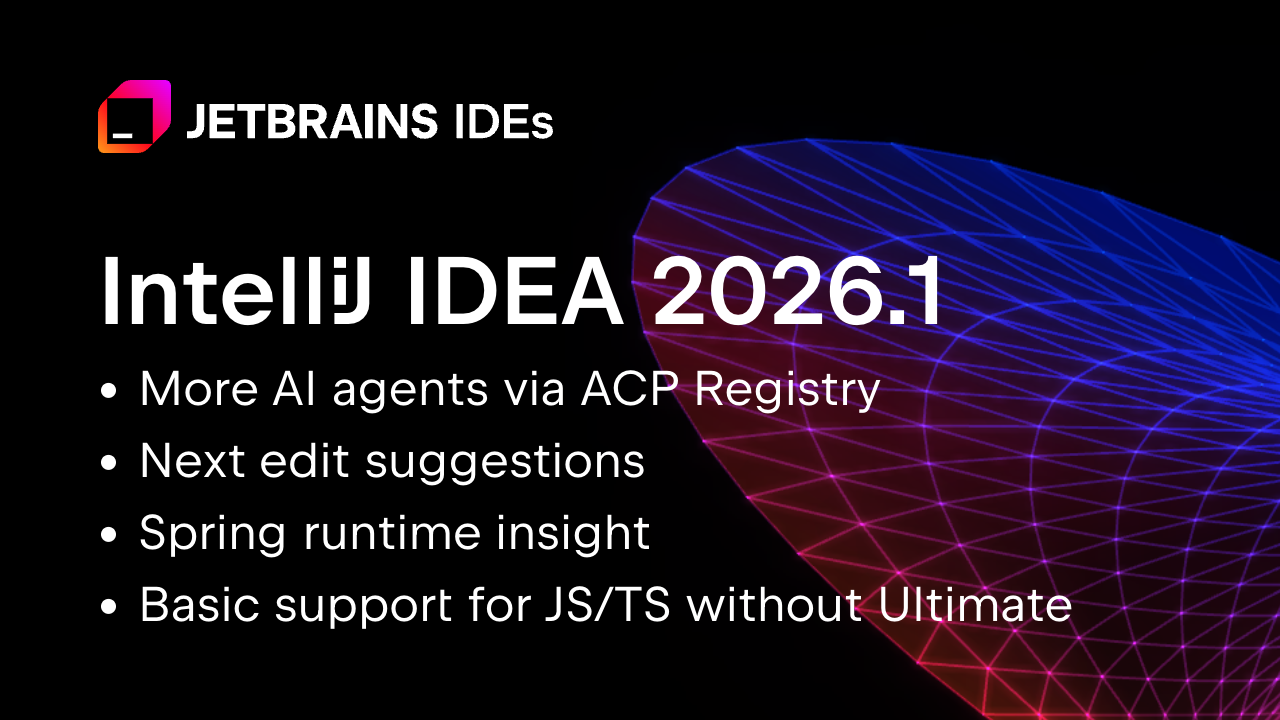
IntelliJ IDEA 2026.1
IntelliJ IDEA 2026.1 brings improvements that many Kotlin developers will notice in their daily work. From general performance enhancements to better language and framework support, this release is a strong ecosystem update and an important part of the Kotlin developer experience.
Explore the release
Helping Decision-Makers Say Yes to Kotlin Multiplatform (KMP)
Adopting Kotlin Multiplatform is easier when the business value is clear. I found this guest post from Touchlab useful because it explains how KMP can improve delivery speed, reduce risk, and support long-term product strategy.
Read the post
KotlinConf’26 Speakers: In Conversation With Lena Reinhard
Ahead of KotlinConf’26, I found this interview with Lena Reinhard interesting because it explores what it means to build a career in tech today, especially when old promises no longer feel certain. It covers leadership, uncertainty, the productivity debate in the age of AI, and the human side of our industry.
Read the interview
Kotlin Professional Certificate by JetBrains on LinkedIn Learning
Looking to build your Kotlin skills? The Kotlin Professional Certificate by JetBrains is now available on LinkedIn Learning. In less than 12 hours, you can go through four courses, pass the final exam, and earn a certificate you can share on your LinkedIn profile.
Start learning
Koog updates for the JVM ecosystem
Koog had a busy month, and I found these two updates useful for JVM developers. First, Koog now offers an idiomatic Java API, making it easier for Java teams to build agent workflows. Second, Koog integrates with Spring AI, helping Kotlin and Spring-based projects use Koog in a familiar setup.
Explore Koog’s Java API
Kotlin + WebAssembly: `wasi:http` sample
I like this sample because it shows how to run a minimal HTTP server with Kotlin and WebAssembly using `wasi:http`. It highlights practical progress in Kotlin’s WebAssembly story and future backend possibilities.
See the sample
Amper 0.10.0
Amper keeps evolving quickly, and this update brings several useful improvements. Version 0.10.0 introduces automatic JDK provisioning, a Maven-to-Amper converter, support for custom Kotlin compiler plugins, and an improved IDE experience.
See what’s new in Amper 0.10.0
Spring Data JPA with Kotlin
I found this practical post worthwhile because it shows how Spring Data JPA works with Kotlin across entities, repositories, custom queries, and DTOs. It is useful for teams already using Spring.
Read the post
Spring guide: Uploading Files
This guide is helpful if you want to compare Kotlin and Java side by side. It makes it easier to see how Kotlin fits into existing backend workflows.
View the guide
Coroutines Guesser Game
Created by kt.academy, Coroutines Races Guesser Game offers an interactive approach to learning coroutine behavior by predicting what happens and when. It is a fun way to test your intuition.
Play the game
Where you can learn more
Workshops – KotlinConf 2026, May 20–22, Munich
Introducing the Skill Manager and Skill Repository
Give AI Something Worth Amplifying: Three Priorities for Technical Leaders
Using ACP + Deep Agents to Demystify Modern Software Engineering
Prototype LLM calls on the JVM using Kotlin Notebook and LangChain4j in IntelliJ IDEA
Next-Level Observability with OpenTelemetry
Exposed now supports array types out of the box for PostgreSQL
If you’ve been connected to the internet for a while, you’ve surely heard of AI Agent Skills. They teach your agent to do this and that. You might have even used or written a couple of them yourself.
If you aren’t yet familiar with them, the idea is simple: Instead of prompting instructions for a specific task each time, you define them once and reuse them later. A Skill is an AI equivalent of a knowledge base article: a plain text document that lives in a discoverable location and describes steps, a set of conventions, or domain-specific knowledge.
Most Skills you see in the wild are for simple things like enforcing code style or commit message conventions. But they can be much more powerful than that. In this article, we’ll combine AI Skills, good old developer tools, and a bit of creative thinking to address a notoriously challenging task: making AI deterministically find the root cause of flaky tests.
The problem
Quoting the TeamCity CI/CD guide:
Flaky tests are defined as tests that return both passes and failures despite no changes to the code or the test itself.
Flakiness undermines the whole point of tests: When a test fails, you can’t tell whether something is actually broken. You can’t fully rely on the test results, and at the same time, you can’t ignore them. This wastes both human and infrastructure resources.
And as if the underlying bugs weren’t difficult enough on their own, flaky tests often have this property of failing once in several thousand runs, making them extremely hard to reproduce and debug.
Example project
For the example project, let’s take the webshop demo from this article: Your Programs Are Not Single-Threaded. It is a Spring Boot project, in which one of the services has a TOCTOU (time-of-check to time-of-use) problem: It checks a condition and then acts on it, but another thread can change the state in between. In this particular case, it may sometimes cause duplicate invoice numbers and also makes the corresponding test flaky.
The test creates two orders concurrently and checks that the resulting invoices get numbers INV-00001 and INV-00002. Because of a bug in InvoiceService, it can either pass or fail randomly.
Note: If you’re using IntelliJ IDEA, you can test whether a test is actually flaky by using the Run until failure option in the test runner. Leave the suspect spinning for some time and see if it eventually fails.
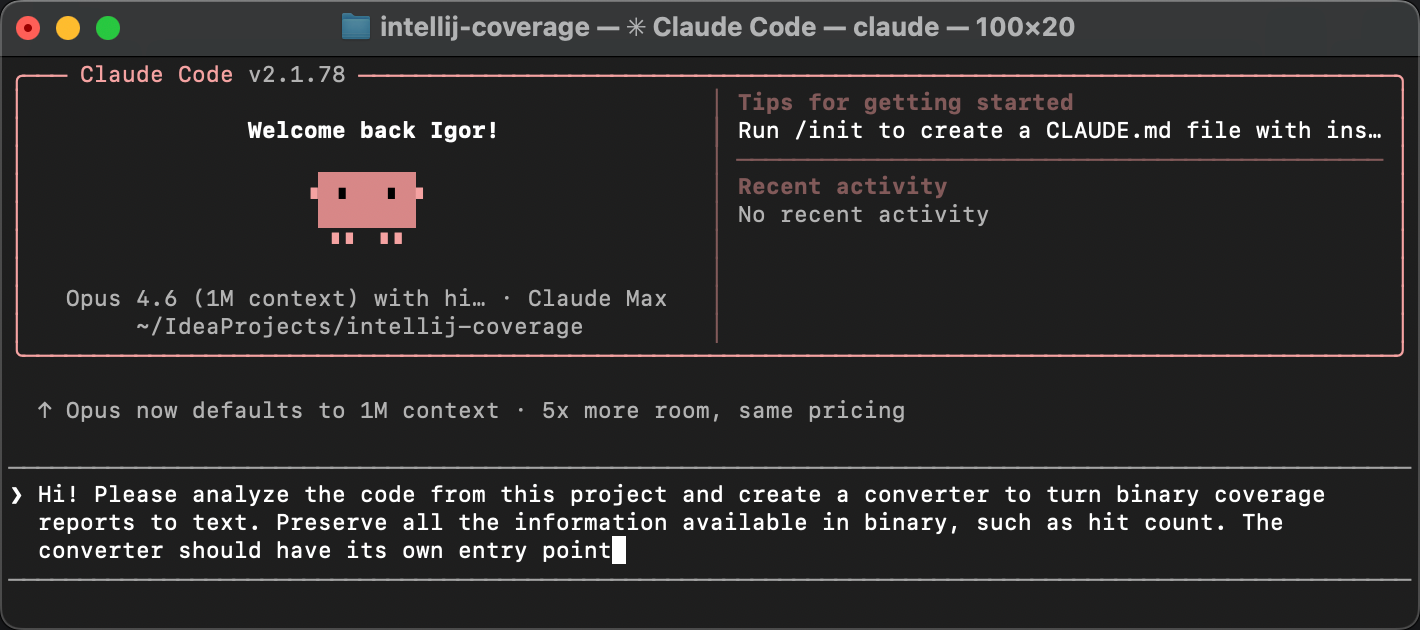
If we knew nothing about the underlying bug, and only had the test, is there a tool that could help us find the root cause? Or can we make one ourselves? Furthermore, could we delegate both building and using the tool to AI?
The intuition
Let’s come up with some intuition for this class of problem.
To produce two kinds of results, the execution must follow different code paths. The difference might be minimal, possibly just one extra method call or one if branch taken instead of another. But it has to be there; otherwise, the result would be consistent. So, if we could record the code path for a passing run and a failing run and then compare them, the diff should at least point us in the right direction. And ideally, by following the call tree, we could find the place where execution splits. This line must be exactly where the flakiness originates.
Does this reasoning make sense? Let’s put it to the test.
Build the tools
What tool can we use for recording code paths? While not designed specifically for tracing, a test coverage tool can give us the information we’re after.
There are a couple of Java coverage tools to choose from, such as JaCoCo and IntelliJ IDEA’s coverage tool. We’ll go with IntelliJ IDEA’s, because it includes a hit counting feature that is very useful. We may need this extra granularity because the flakiness might stem not only from what is executed, but also how many times.
Run coverage from the command line
IntelliJ IDEA’s coverage tool has a familiar UI, but we need a way to launch it programmatically. Fortunately, coverage can also be collected from the command line by attaching the coverage agent to the JVM via Maven Surefire:
The -Didea.coverage.calculate.hits=true flag tells the agent to record invocation counts per line rather than just a boolean hit/not-hit mask. After the test finishes, the results are written to a binary .ic file.
So far so good, but we need the report in a human (and AI)-readable format.
Add text output
Luckily, the IntelliJ coverage agent is open-source. Let’s clone the project and ask AI to add a text reporter that converts binary reports to plain text.
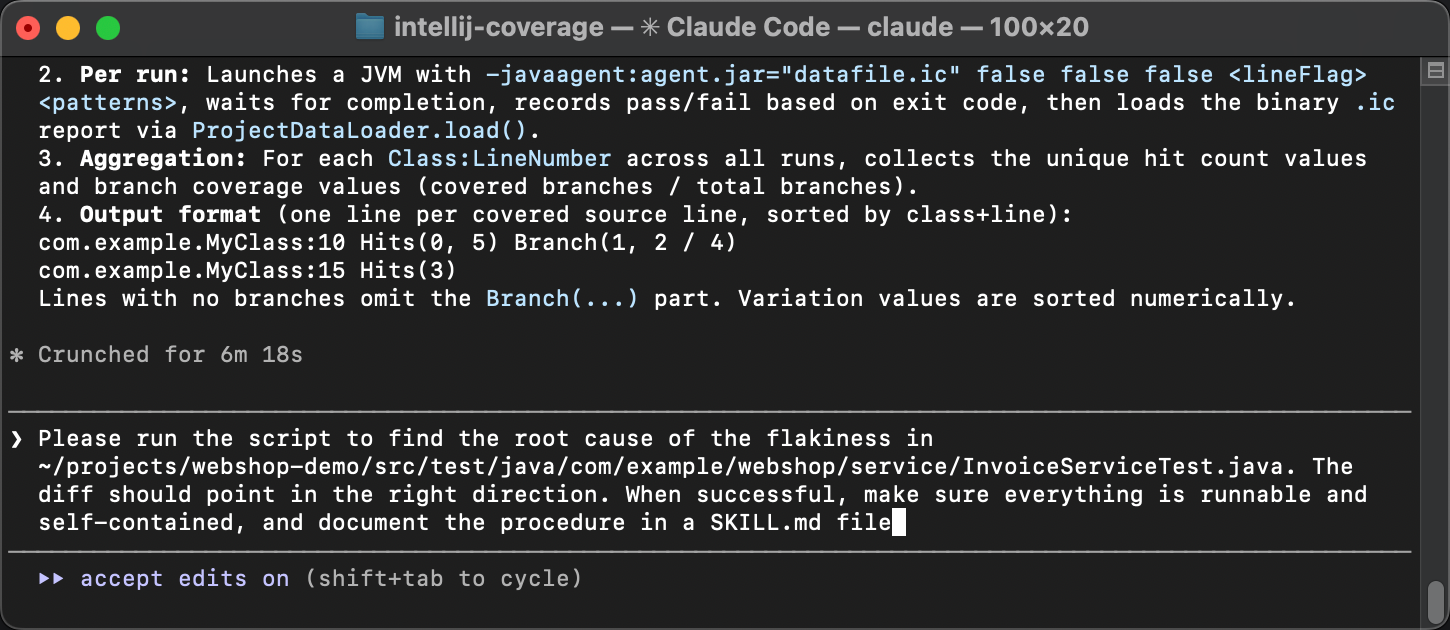
The agent creates a new class called TextCoverageStatistics. After we build the project and run the reporter against our .ic file, we get something like this:
The first part of the report gives a high-level overview: How many lines, branches, and methods were covered across the entire project. Below that, there’s a per-class breakdown showing the same metrics for each class individually.
Then it is followed by per-line hit counts for each class:
For every line that the coverage agent instrumented, we see how many times it was executed and whether any branches were taken. The actual report is longer, but you get the idea. Now we have a text representation of which lines were executed, and exactly how many times.
This is the raw material we need for the diff. So far, so good!
Diff the reports
Supposedly, the obtained reports contain the necessary information, and a very determined developer could peruse them and find the bug. But we’re not here for mundane tasks like that, right?
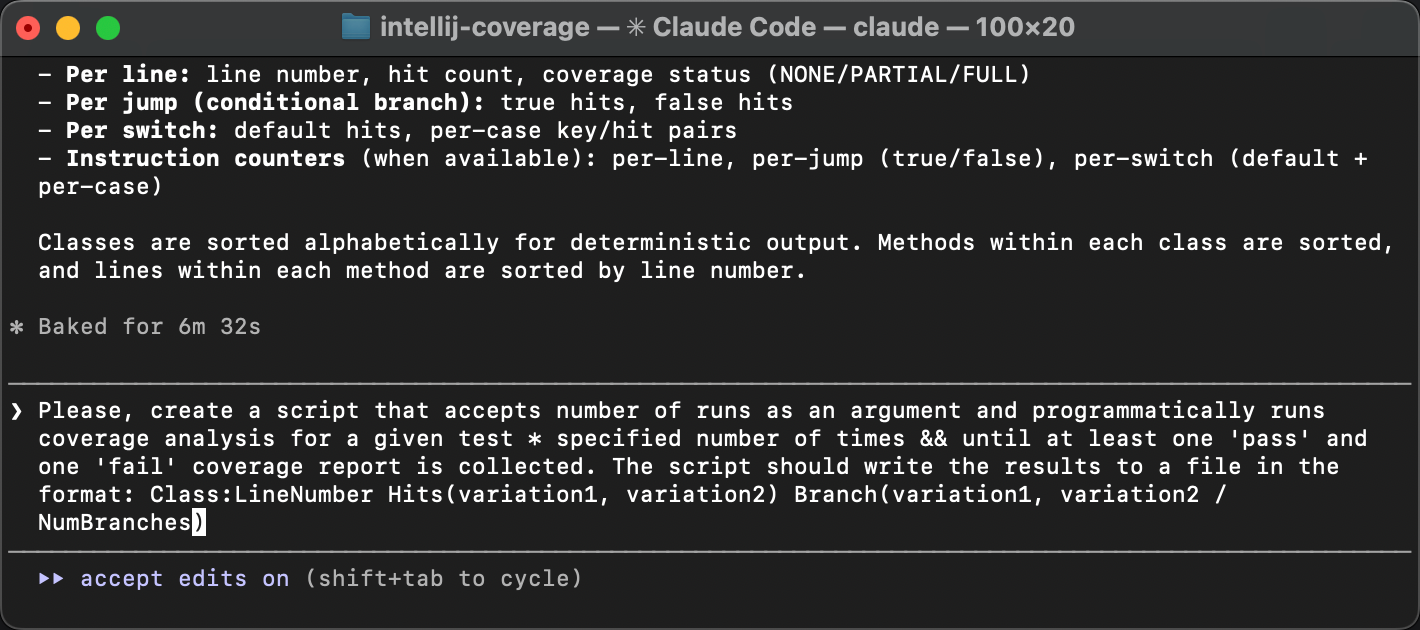
Let’s upgrade the tool so that it gets multiple report variations and presents the diff. The most controllable way would be to do one “brick” at a time, but I think we’re safe to delegate the entire thing to AI here, including the automation:
The resulting script runs the test in a loop until both of the following happen:
We get at least one passing and one failing run.
The specified number of runs have passed.
Both conditions are important because test failures can be very rare, and the specified number of runs might not be enough. At the same time, there can be finer grained variations within pass and fail runs, so we might want to catch those too.
After the reports are collected, the script summarizes the lines that have variations between the runs. Here’s what it looks like:
All variations have the same pattern: the difference is not which lines were executed, but how many times. As we expected, the hit counting feature of IntelliJ IDEA’s coverage agent proved useful!
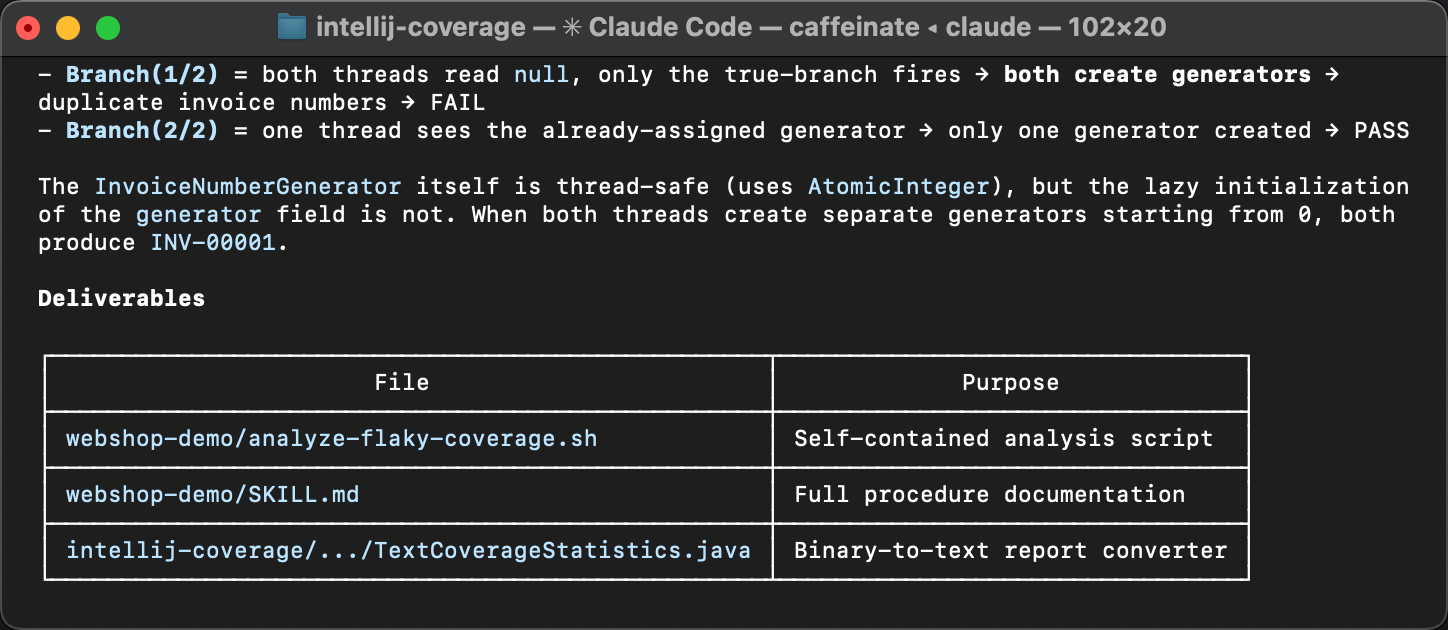
The varying lines point at a lazy initialization block in InvoiceService and its downstream effects in InvoiceNumberGenerator and Invoice. The variation in hit counts means that the initialization sometimes runs more than once, which shouldn’t happen. That’s exactly where the flakiness comes from.
If you missed the article that describes the problem, here’s why double initialization causes this bug. The createGenerator() method queries the database for the last used invoice number and creates a counter starting from that value. When two threads both enter the if (generator == null) block before either finishes, each reads the same number from the database and creates its own generator starting from the same value. The result is duplicate invoice numbers.
The coverage diff has pointed us at the very same TOCTOU race discussed in more detail in the previous article. But, what is novel in our current approach is that it doesn’t solely rely on human expertise and is easily accessible for AI.
Turning it into a Skill
Now, I’d say that AI-assisted modifications to open-source tools that help you solve the task at hand, all within minutes, are amazing on their own. But let’s keep our eyes on the bigger picture.
Here’s what we’ve done so far: We started with an intuition: Flaky tests take different code paths, and coverage analysis can reveal where they diverge. Then we turned that intuition into a concrete, repeatable procedure. Does this warrant a knowledge base article, or an AI Agent Skill, perhaps? Yes!
In the same agent session, let’s ask the agent to:
Make sure all the scripts are self-contained and runnable.
Document the entire procedure in a SKILL.md file, step by step, so that another agent can follow it without any prior context.
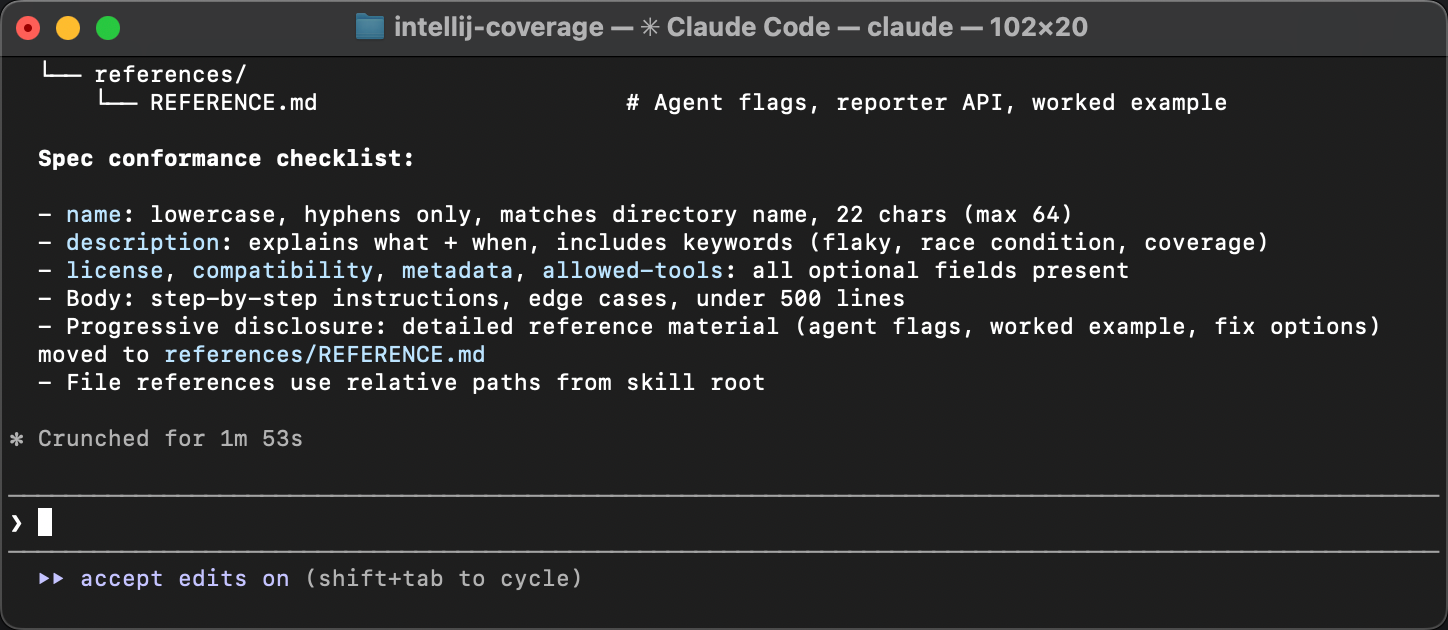
The agent packages everything and writes a guide that describes when to apply the Skill, what tools are needed, and what steps to follow.
The only follow-up during review was to align the Skill with the specification. The original Skill written by the agent lacks meta in frontmatter. Agents are good at sorting out Skills that omit minor details, but meta is important for discoverability. Without it, a Skill might not be picked up by an agent in the first place.
Testing the Skill
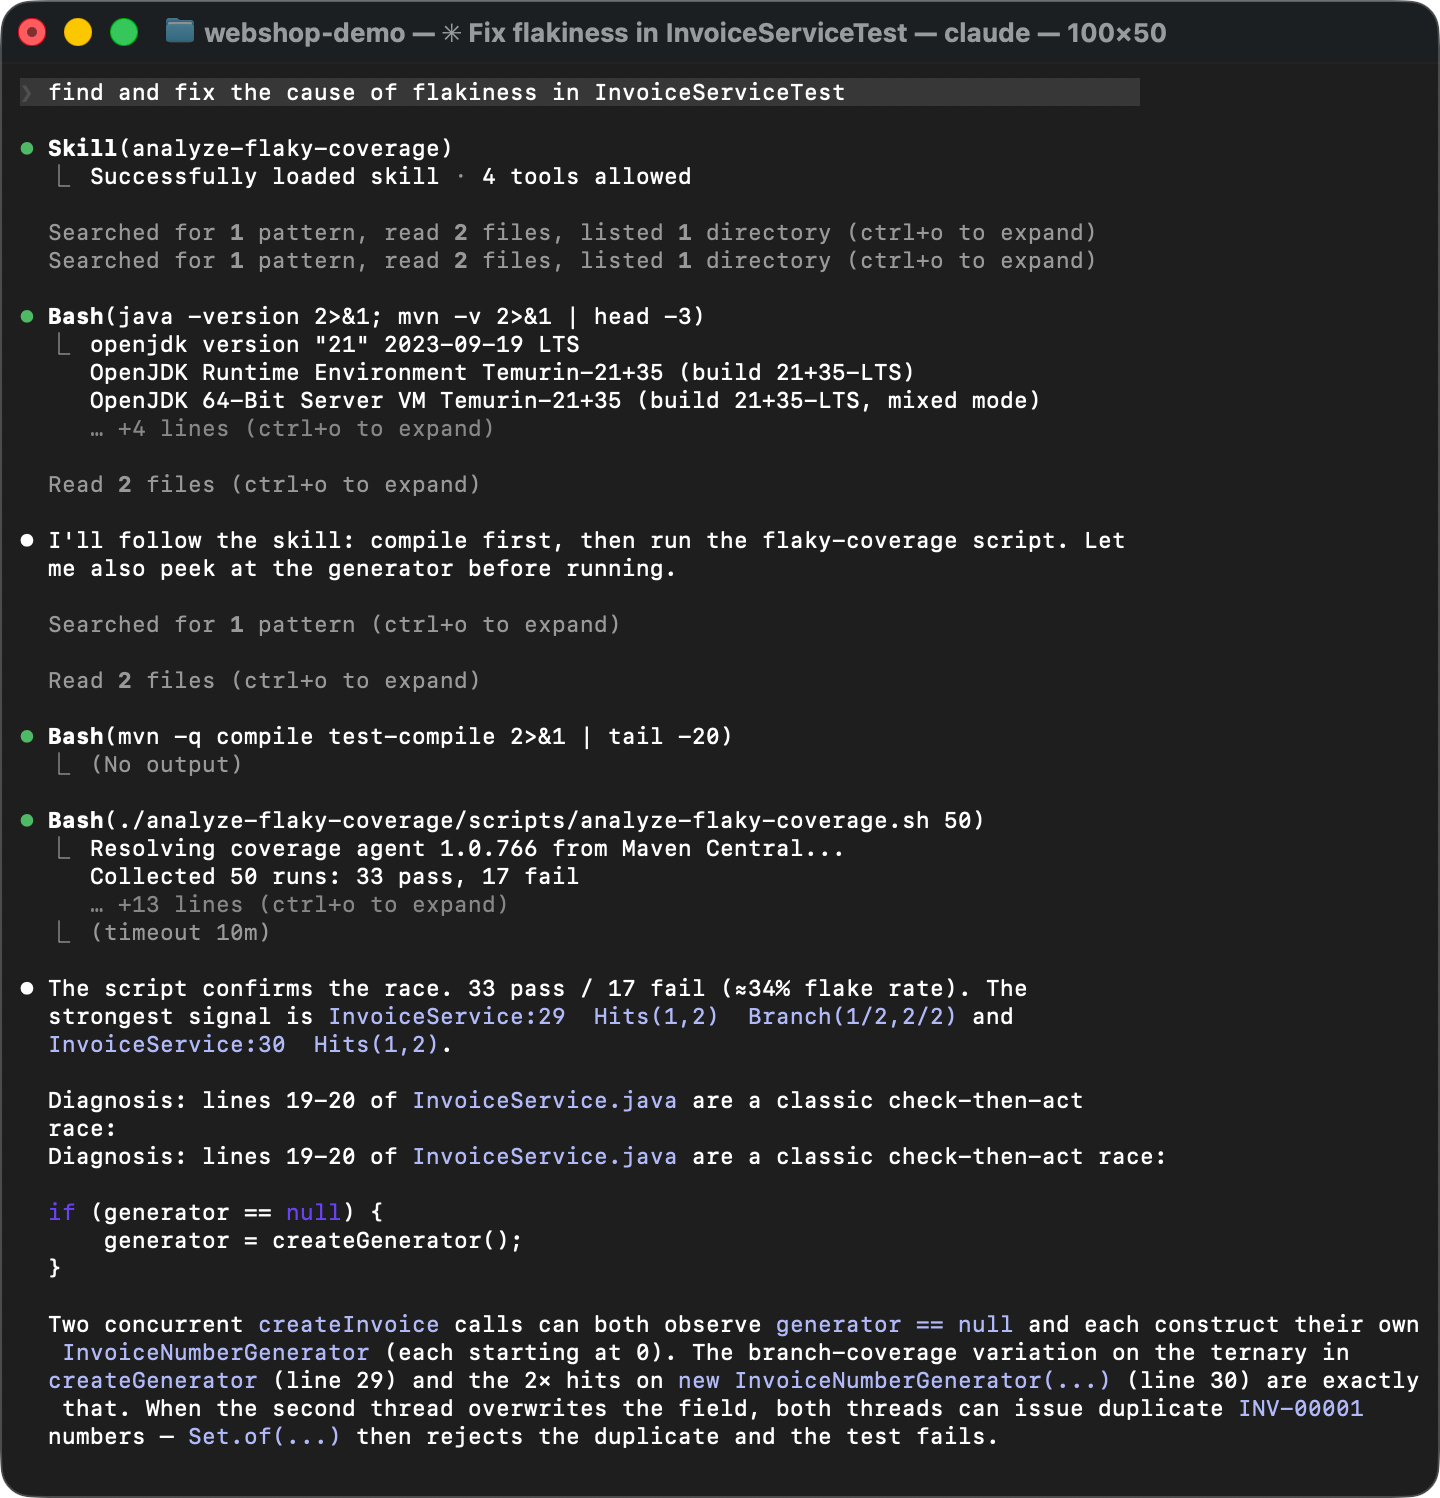
To verify that the Skill actually works, let’s start a fresh agent session. No warm-up, no hints. Instead, let’s deliberately phrase it in a very general way, something like “find and fix the cause of flakiness in InvoiceServiceTest“.
The agent matches the Skill description from SKILL.md with the problem description, discovers the instructions, and executes them: It runs the coverage script, reads the diff, and identifies the race condition. Instead of guesswork, it follows the established steps and arrives at the same conclusion every time. That’s about as deterministic as generative AI can get!
Summary
The changes that we’ve made to the coverage agent are already published with the new version 1.0.774. And the Skill is available here.
In this article, we started with an intuition about flaky tests, built custom tooling around an open-source coverage agent, used it to find a race condition, and packaged the entire procedure into a reusable AI Skill. You can use this Skill for finding flaky tests in your own projects, but I hope this post conveys the bigger idea.
AI Skills allow you to teach agents to solve virtually anything, as long as you can stack text interfaces together. Many hard programming problems can be broken down into simpler ones and solved using familiar tools. And with AI orchestrating all this, we can even make the process enjoyable. As was the case long before AI, curiosity is the only real prerequisite.
Have you been inspired to solve a tough problem in your own work? Would you like to share the Skills you wrote or find most useful? Let us know in the comments!