Your Prototype Is Not Being Honest With Your Users (And Here’s How To Fix It)

This article is a sponsored by ProtoPie

There’s a moment in almost every usability session where a participant pauses at the login screen, types something, and glances up: checking whether they’re “doing it right.” That pause is a clear sign. They’ve already clocked that this isn’t a real app, and every data point collected after that moment is filtered through that awareness.

In financial product testing, the problem is sharper. Finance users are trained to notice when something feels off: a balance that doesn’t add up, a field that accepts anything. When a banking prototype skips real authentication, participants don’t just disengage; they stop mid-session to flag it. The team walks away with findings that reflect how users behave in a demonstration, not in a real product.

The fix is narrower than you’d think. Identify the moment where participant trust is established and make that interaction real. In a banking app, that moment is the login.

This tutorial builds it: credentials that validate, a live error state, and a biometric animation that feels native — no code required.

What We’re Building: A Login That Behaves Like A Shipped Product

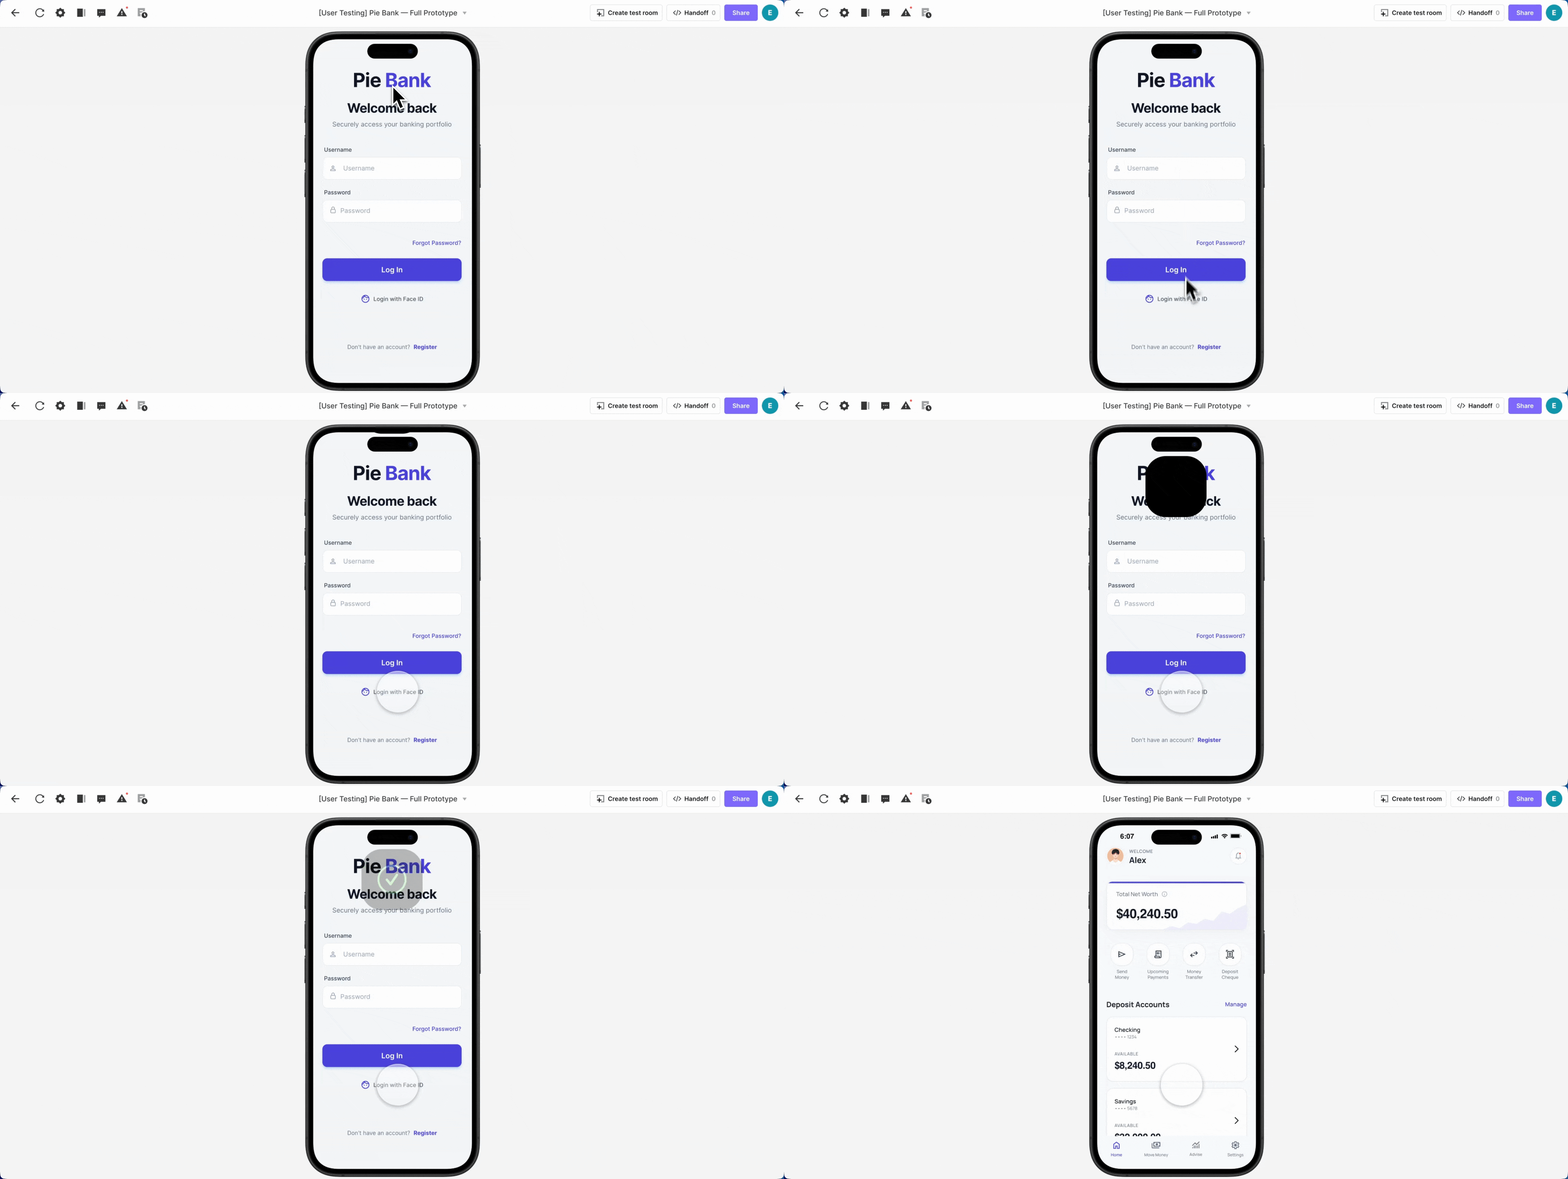
The login flow, built around Pie Bank, a mobile banking prototype, includes functional text inputs, a masked password field, credential validation, a live error state, and a Face ID animation timed to feel indistinguishable from iOS.

What you’ll need:

  • A login UI from Figma (or any supported design tool)
  • ProtoPie Studio — free to start, everything in this tutorial works on the free plan
  • A Lottie file for the Face ID animation (this one is what we used)
  • The finished Pie Bank prototype file — download it to follow alongside, or use it as a reference after you build

Step 1: Import From Figma Choose Scene, Not Flattened

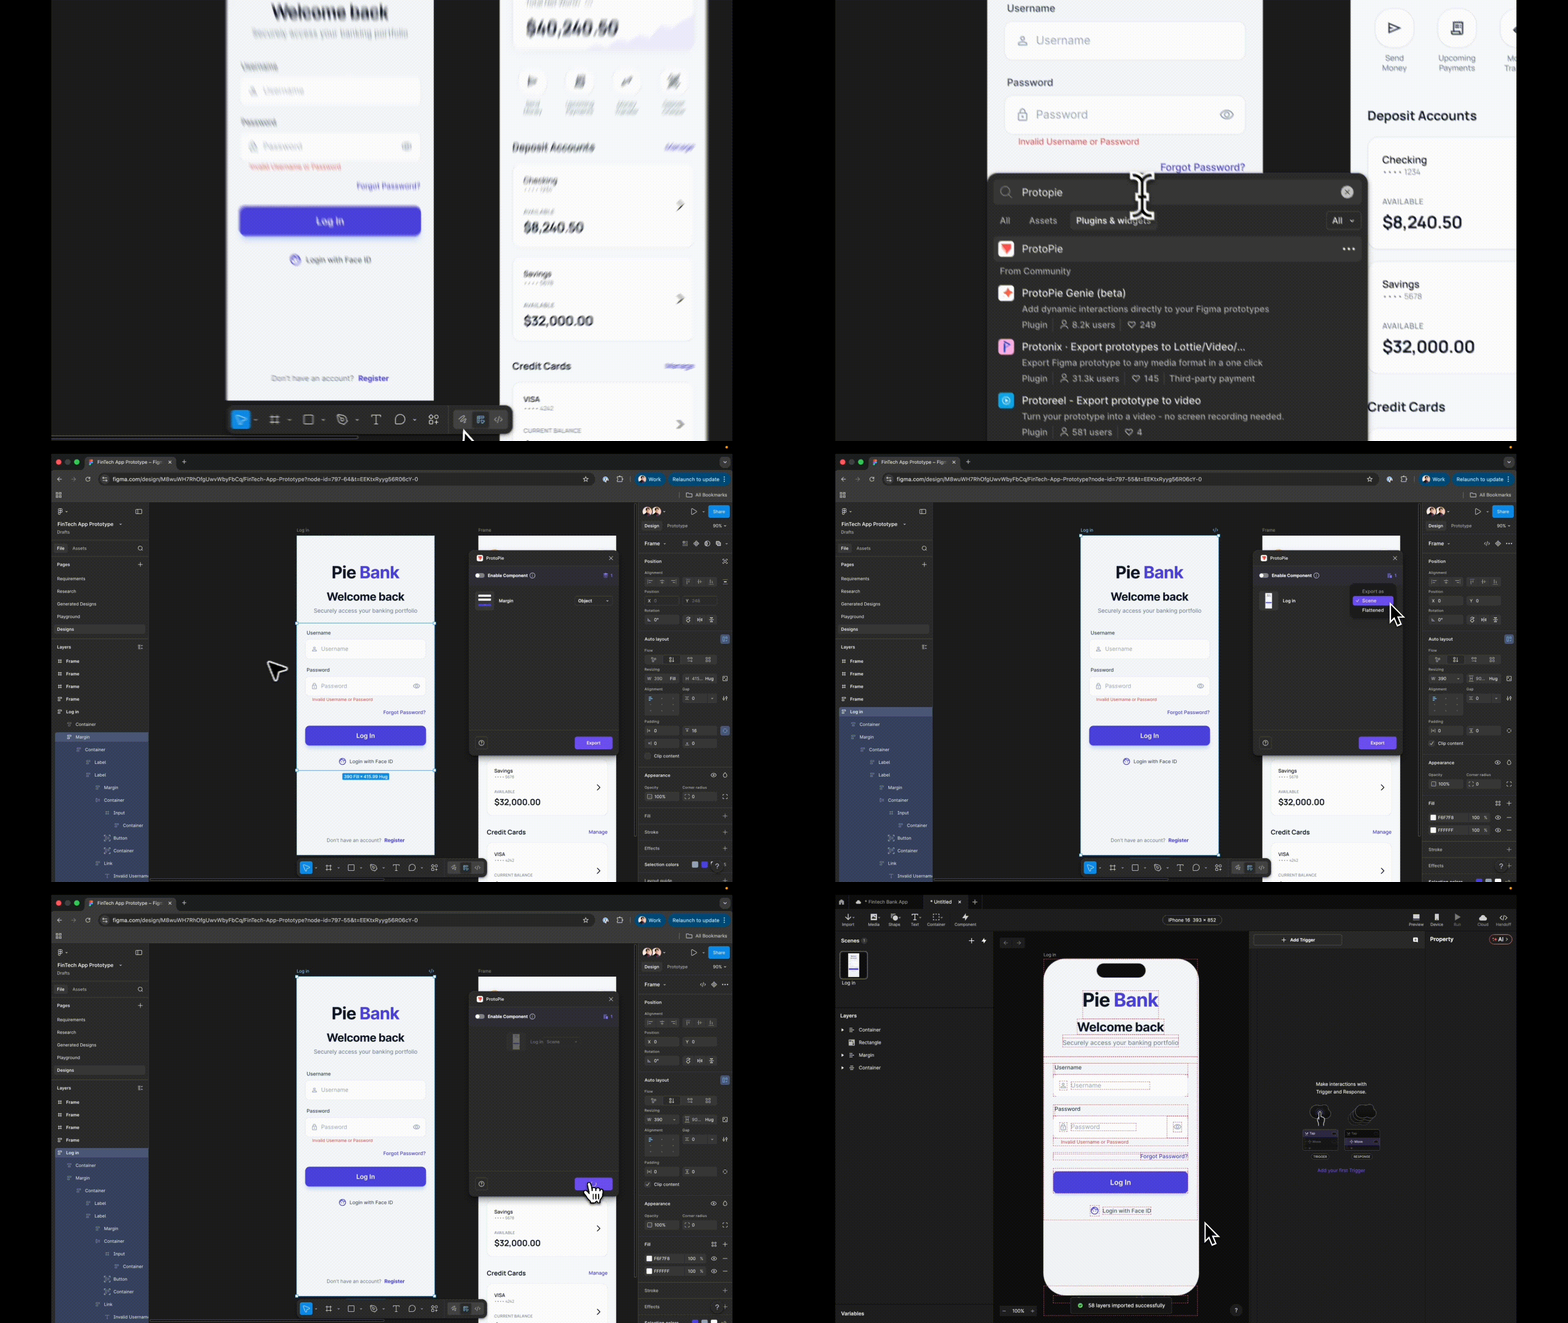
In Figma, open the ProtoPie plugin with your login frame selected and choose Scene when exporting. Flattened collapses everything into a single image; Scene preserves your layer hierarchy so every element arrives in ProtoPie as a separate, targetable layer.

Before moving on: rename every layer meaningfully. “Input Username” not “Rectangle 14”. You’ll reference these names in formulas: vague names compound into real time lost.

Step 2: Swap Static Fields For Inputs That Actually Accept Text

ProtoPie’s native Input layer accepts real keyboard entry: participants type actual text, not tap a placeholder. Go to Text  → Input, drag an Input layer onto your canvas, and nest it inside your username field group. Match it visually: placeholder text Username, background fill and font to match your design.

Hit preview. Click the field. Type. That’s the prototype starting to behave like an app rather than depicting one.

Rename this layer Input Username, duplicate it, and nest the copy inside your password field group.

Step 3: One Property Change Masks The Password

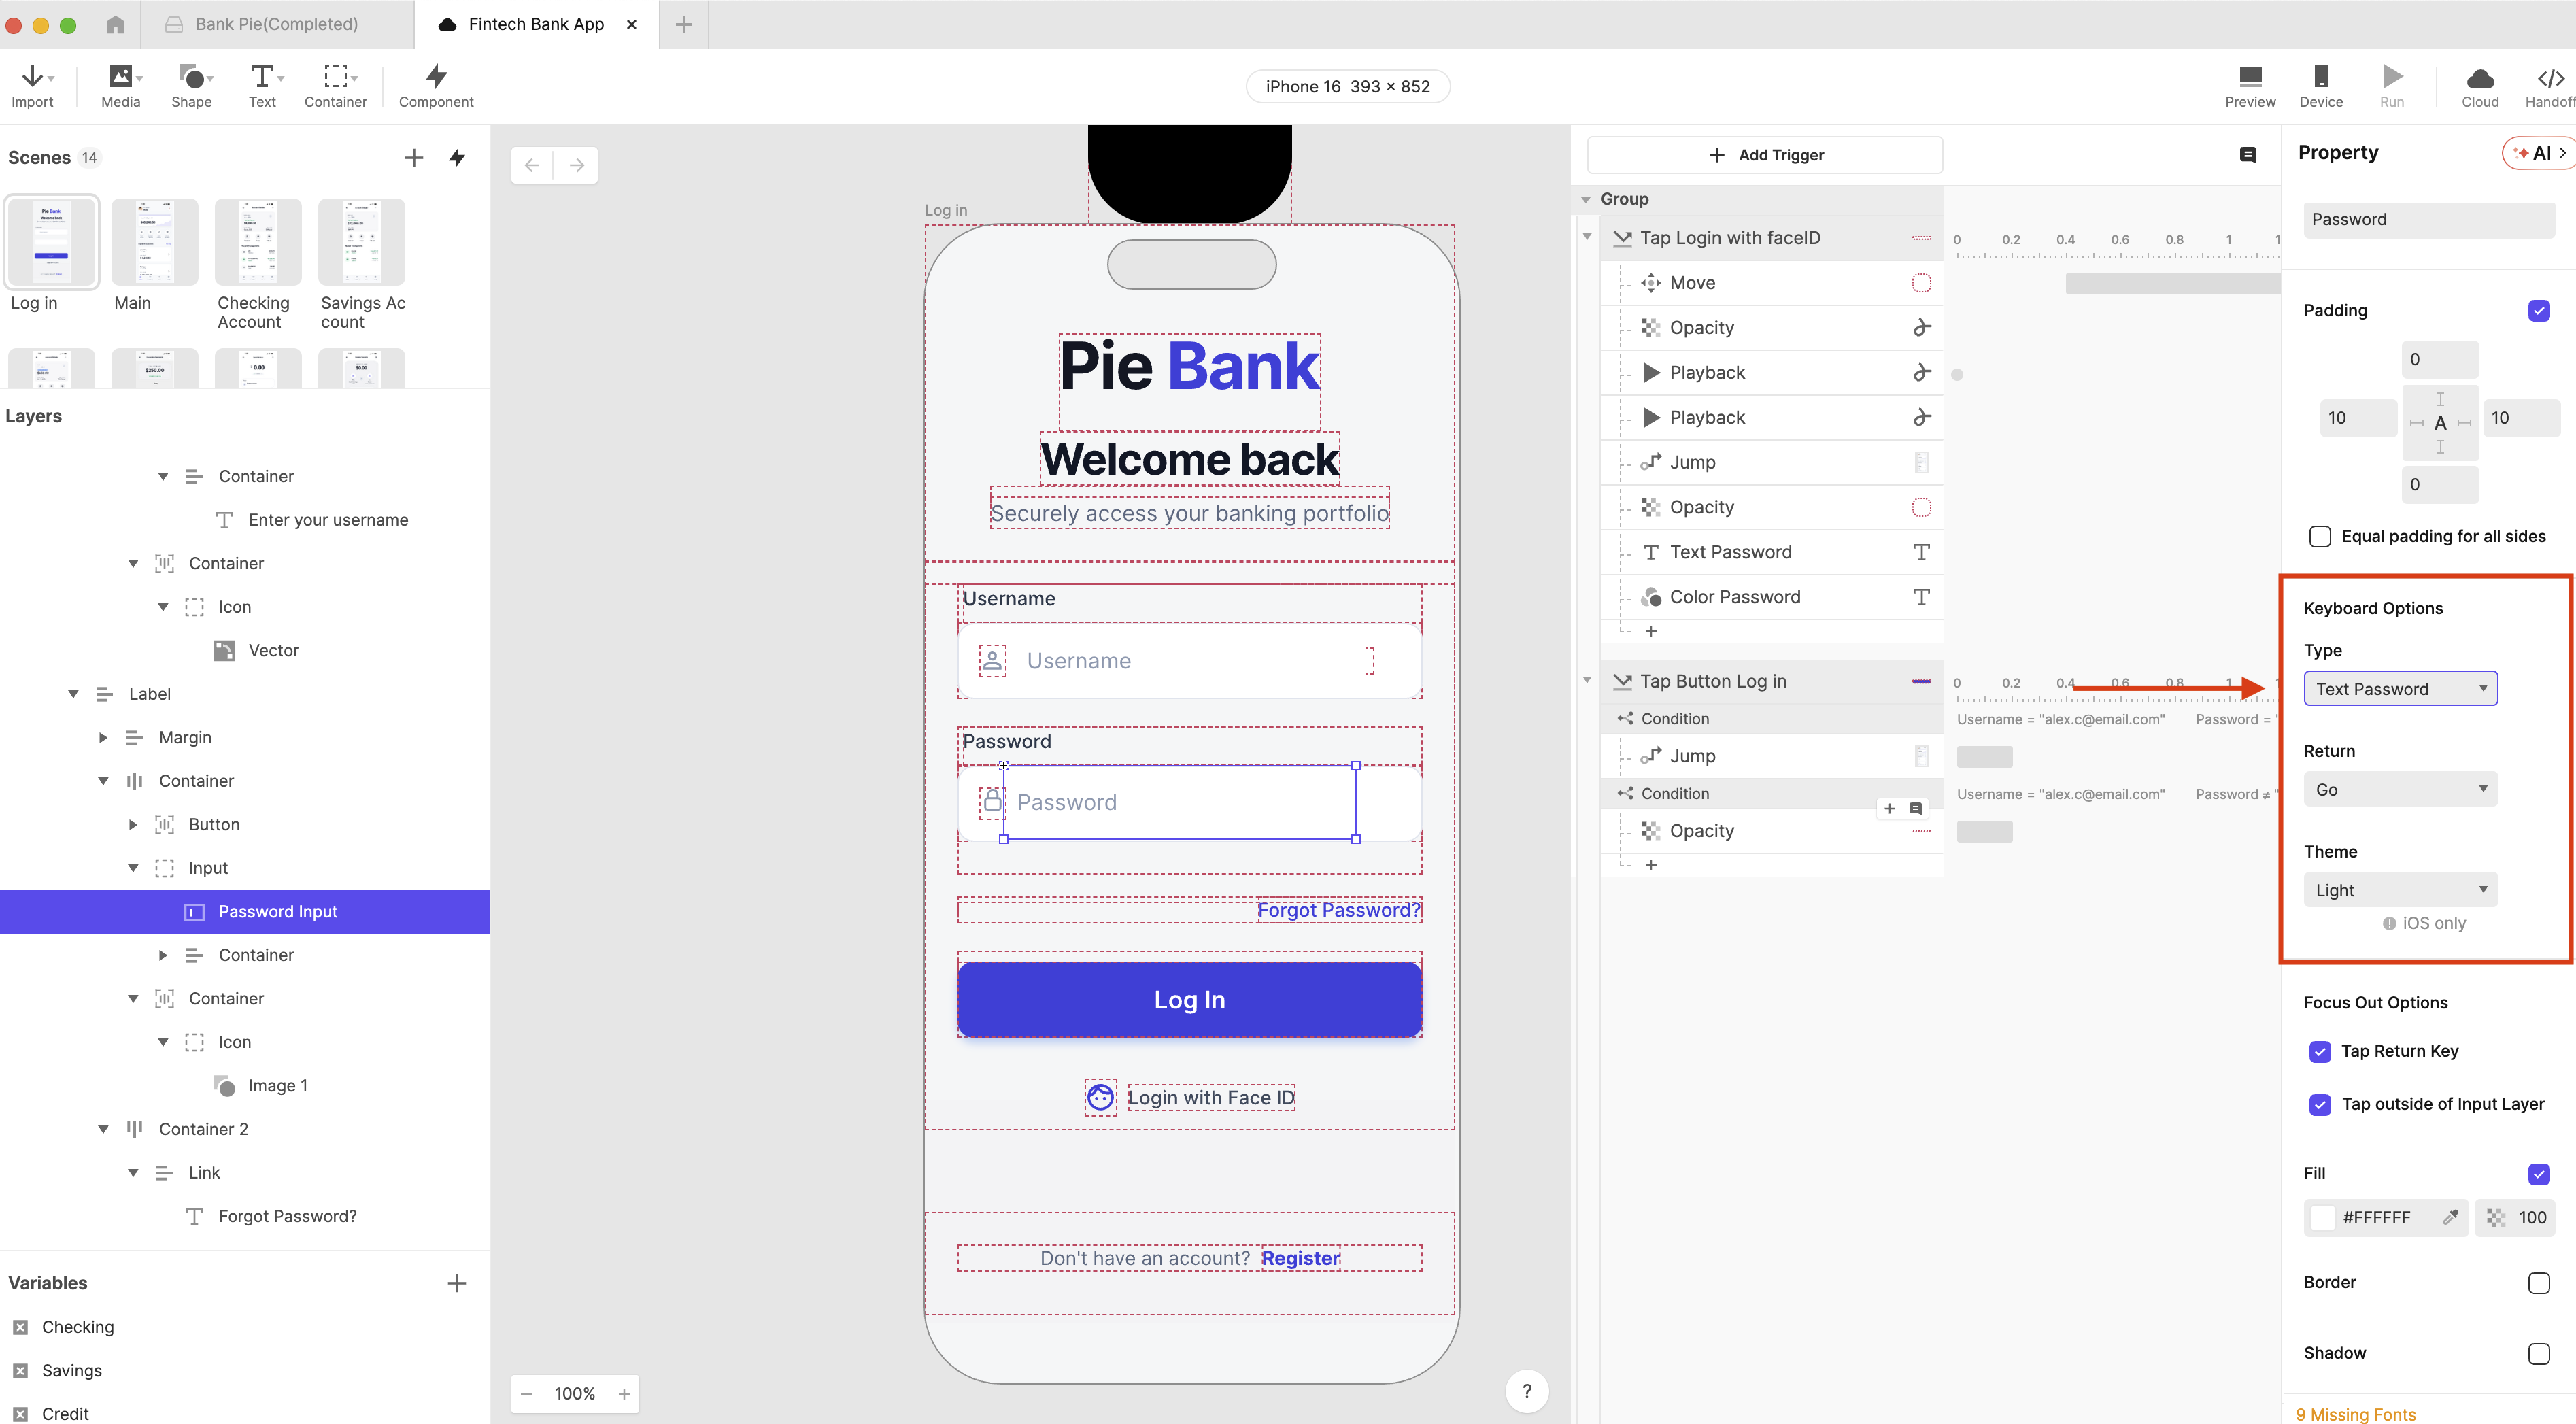
On the duplicated layer, change placeholder text to Password and set Type to Text Password. ProtoPie handles the masking: no custom logic needed.

Preview both fields: username shows text, password shows dots. It already feels real, and you haven’t written a single condition.

Step 4: Build The Destination Scene Before Wiring Navigation

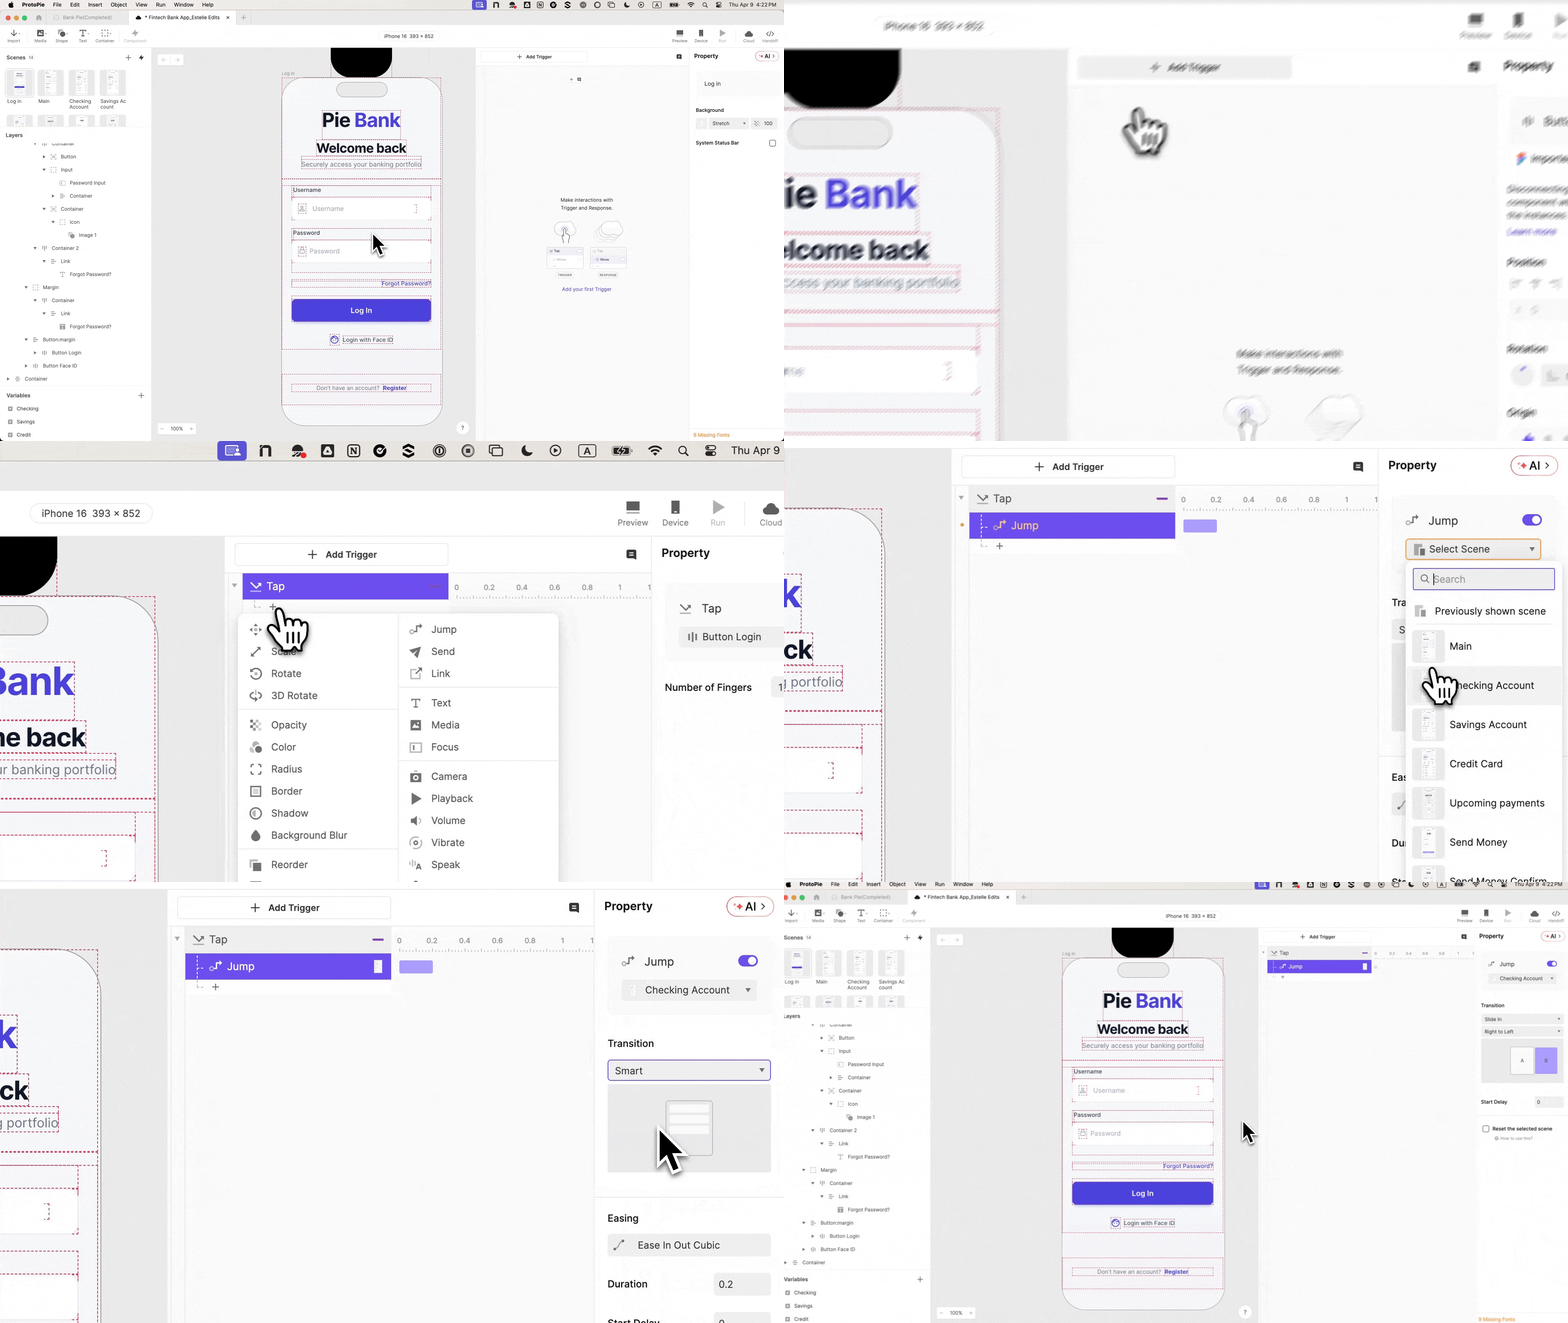
Add a new scene, even a blank one. The most common sequencing mistake in ProtoPie is trying to wire a navigation response before a destination exists. Create it first.

Step 5: Wire The Button: It Works, But It Still Lets Everyone Through

Select Log In, add a Tap trigger, set response to Jump, target your dashboard scene, transition Slide in from right to left.

Preview and tap. It navigates: but for any input, including nothing. The prototype is still lying. The next two steps are the fix.

Step 6: Add Variables So The Prototype Remembers What Was Typed

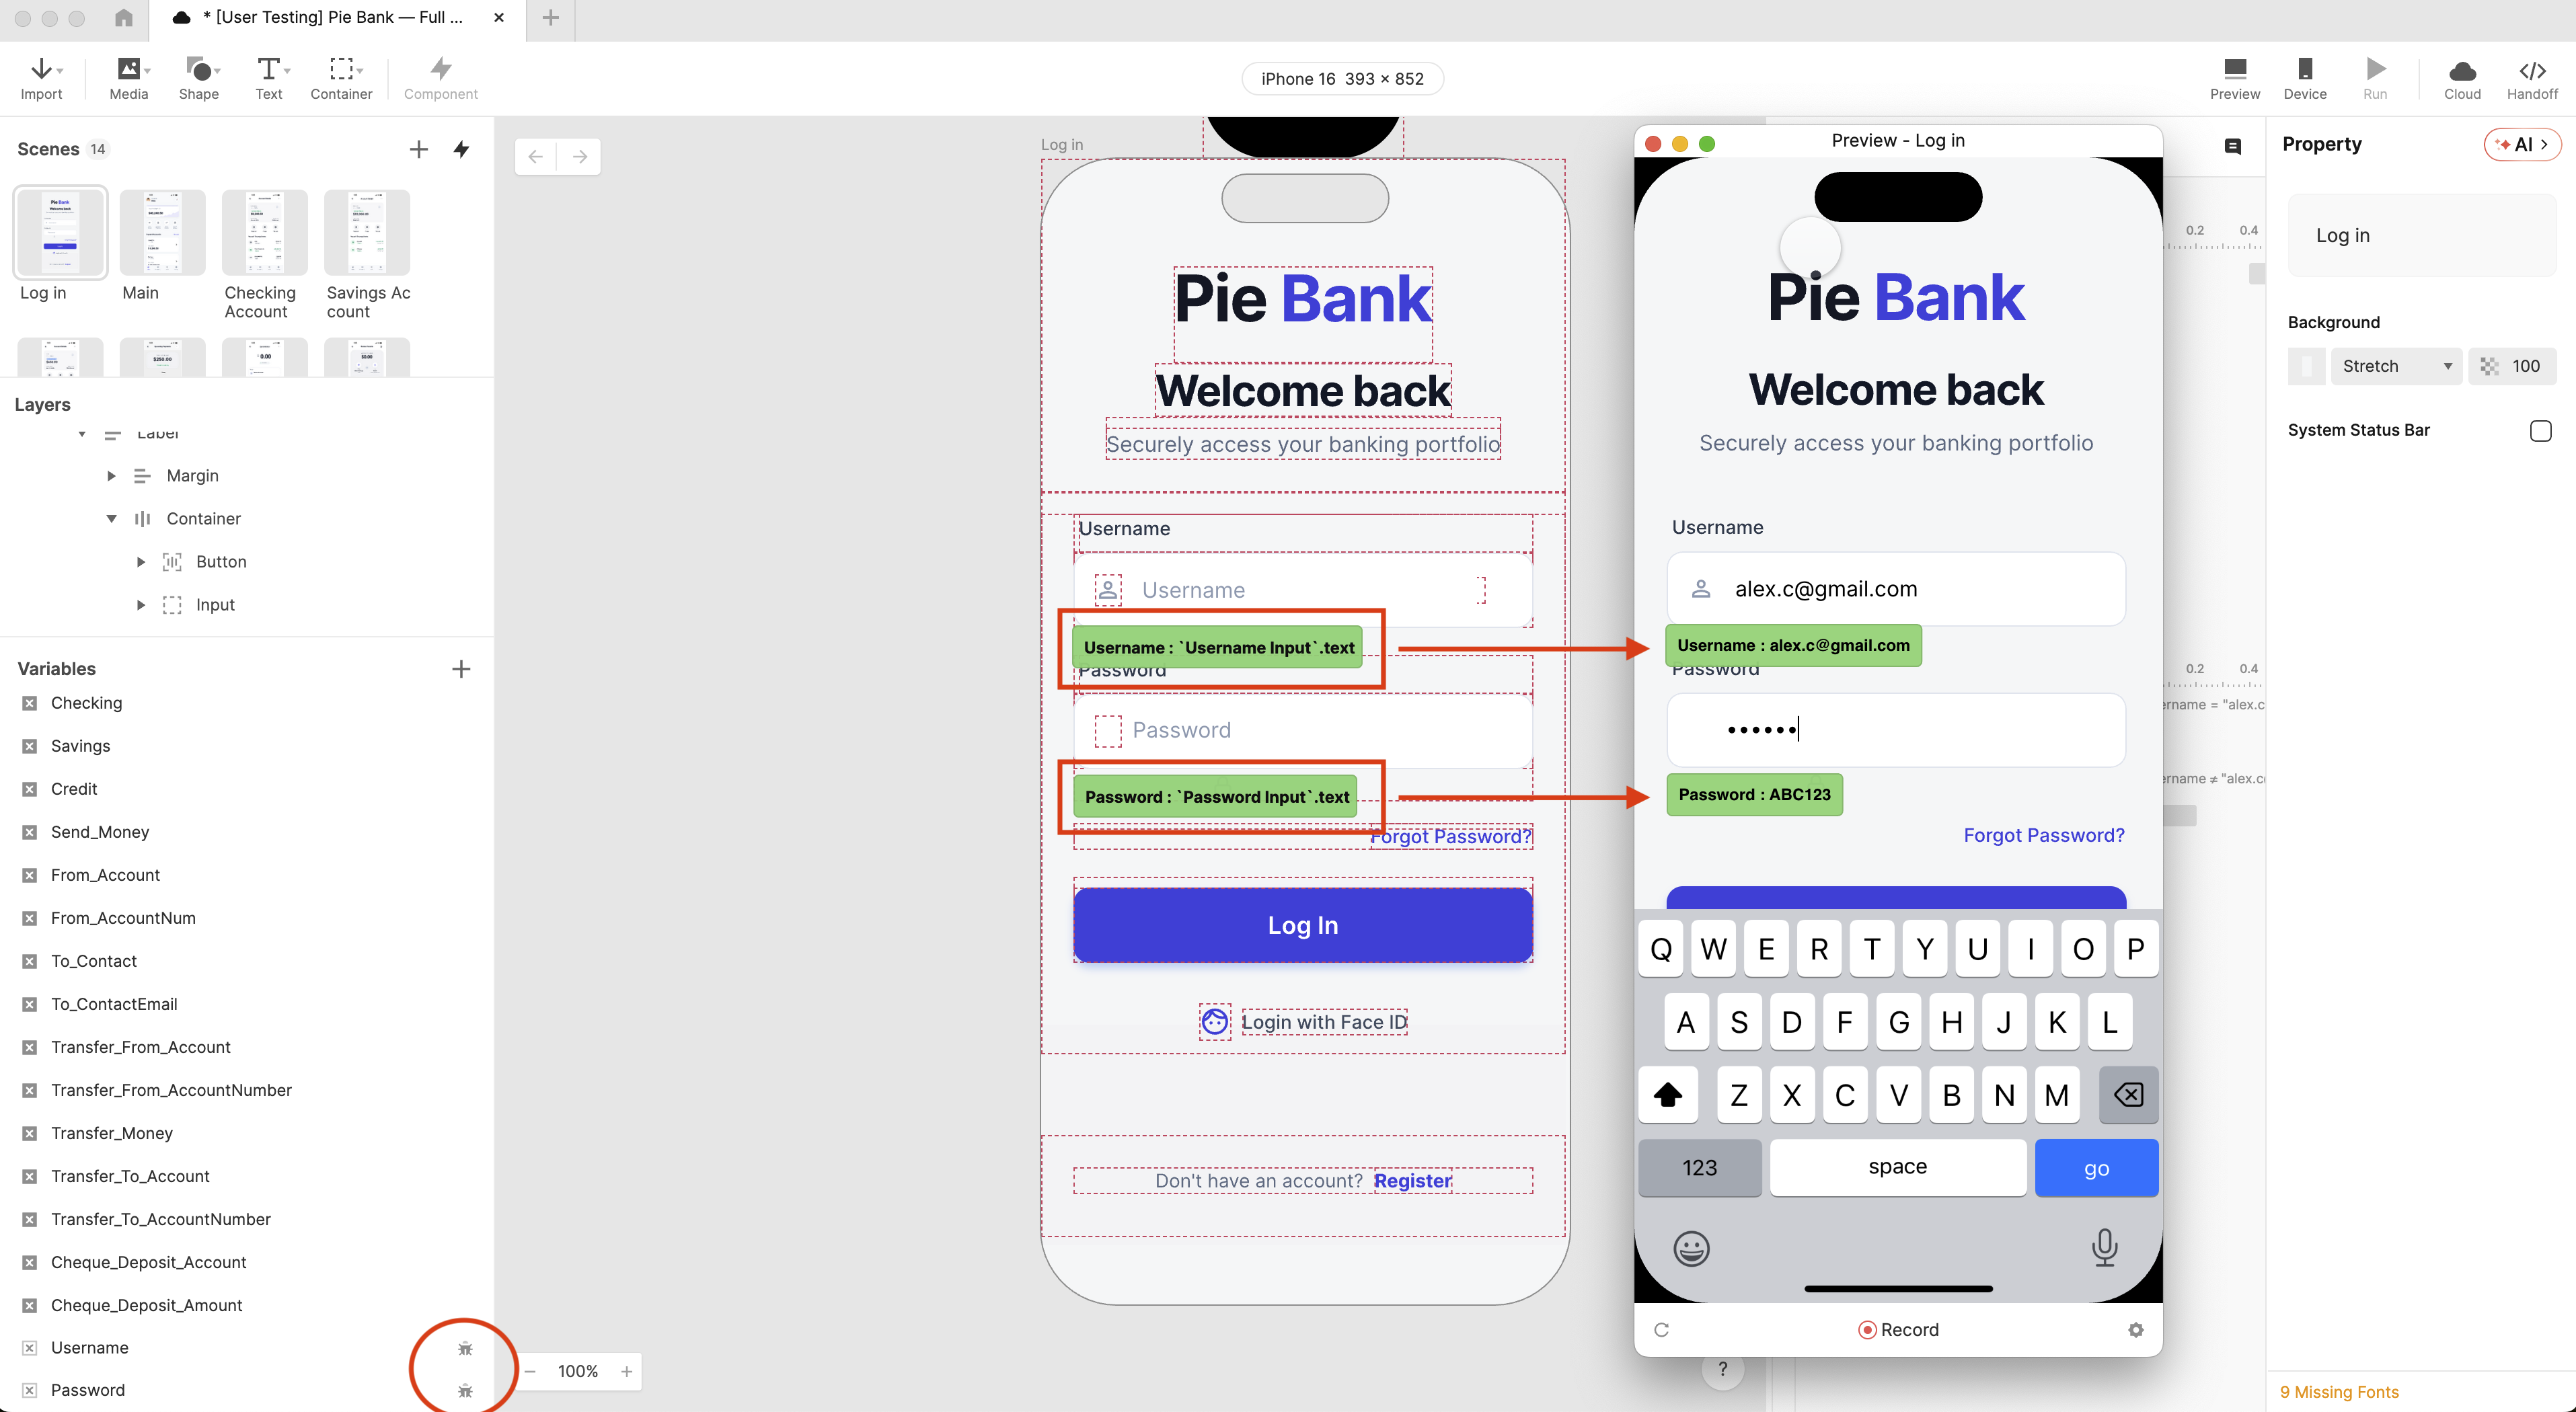
At the bottom-left of ProtoPie, add two Text type variables: username and password. Bind each to its input layer with a formula:

input("Input Username").text
input("Input Password").text

Enable the debug icons: green overlays will show live variable values as you type. When you see your keystrokes appear in real time, the binding is confirmed.

Step 7: Add A Condition So Only Valid Credentials Get Through

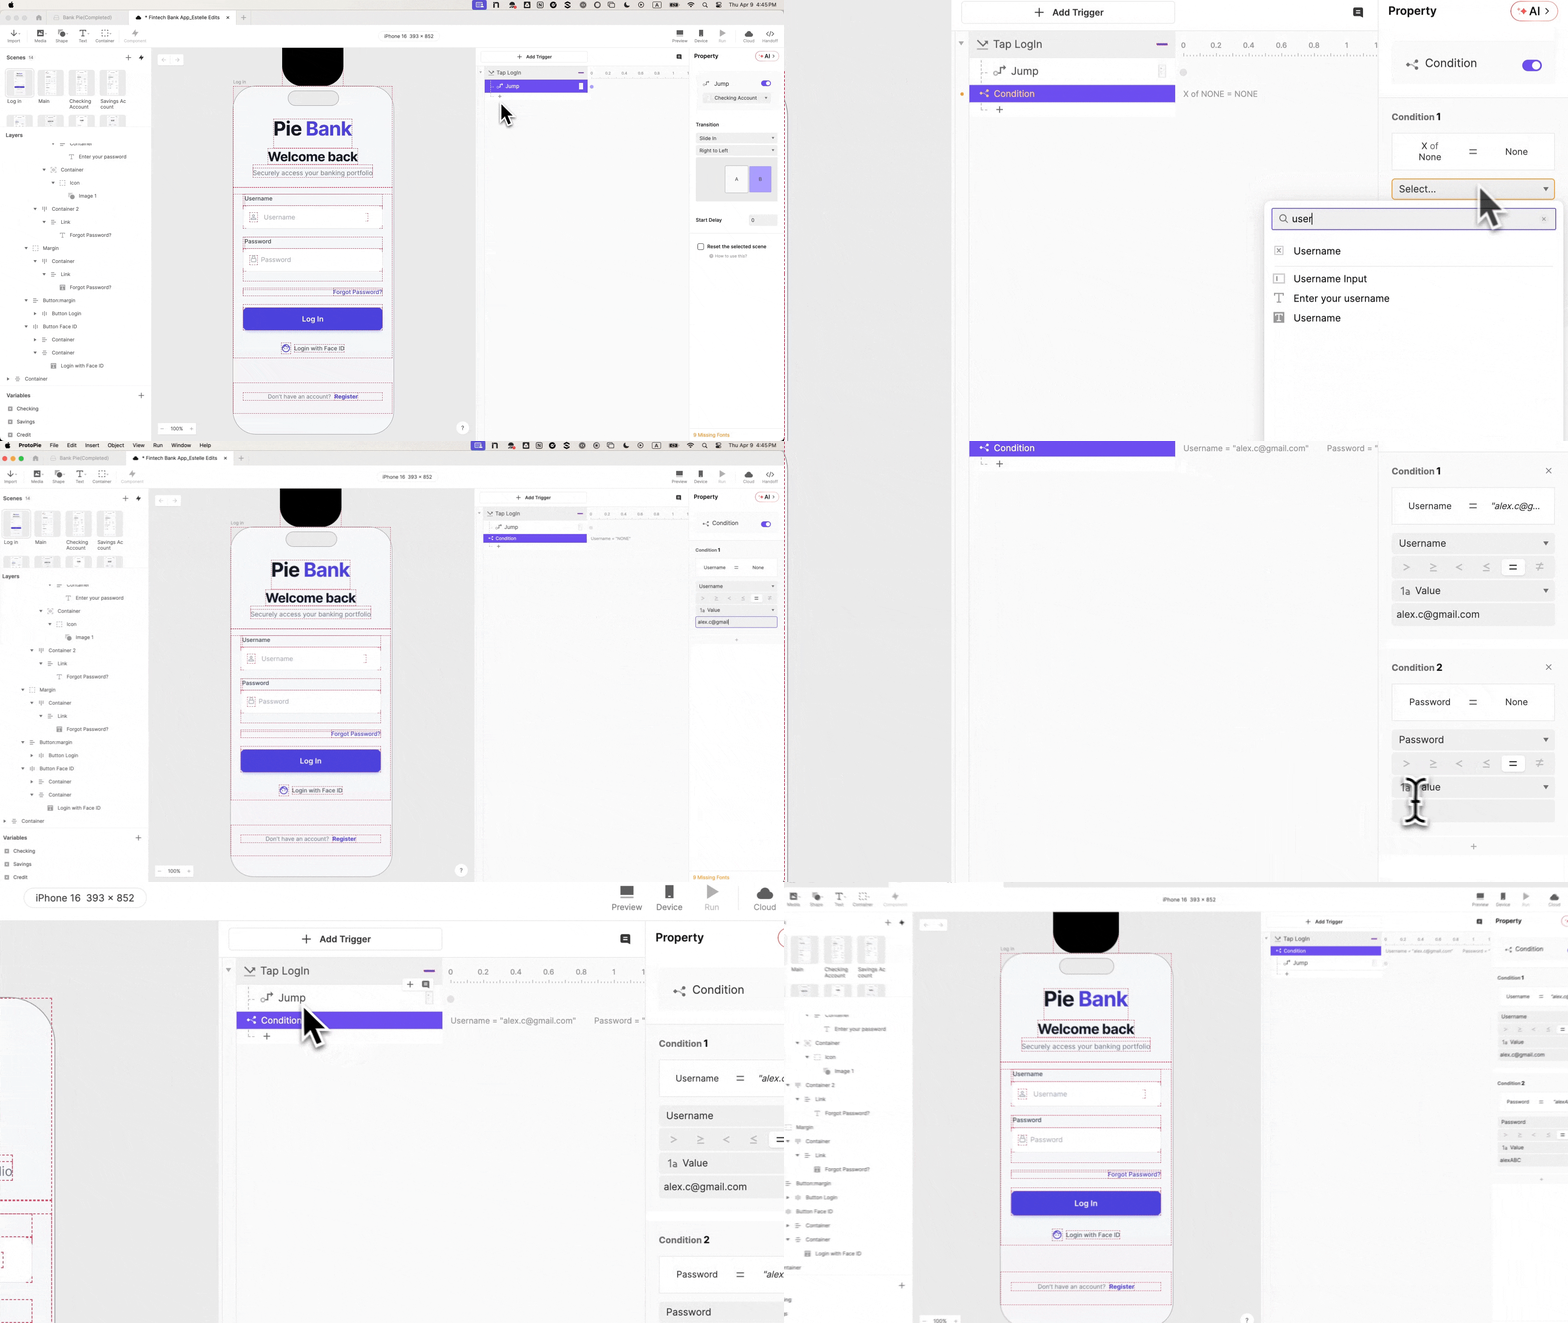
Go back to the Tap trigger on the login button. Add a Condition with two rules, both must be true:

  • username equals `alex.c@gmail.com`
  • password equals ABC123

Move the Jump response inside this condition. Wrong credentials, empty fields, wrong format: none get through. Participants now have to actually log in. That single constraint changes the texture of every test session that follows.

Step 8: Build The Error State, The Interaction Most Prototypes Skip

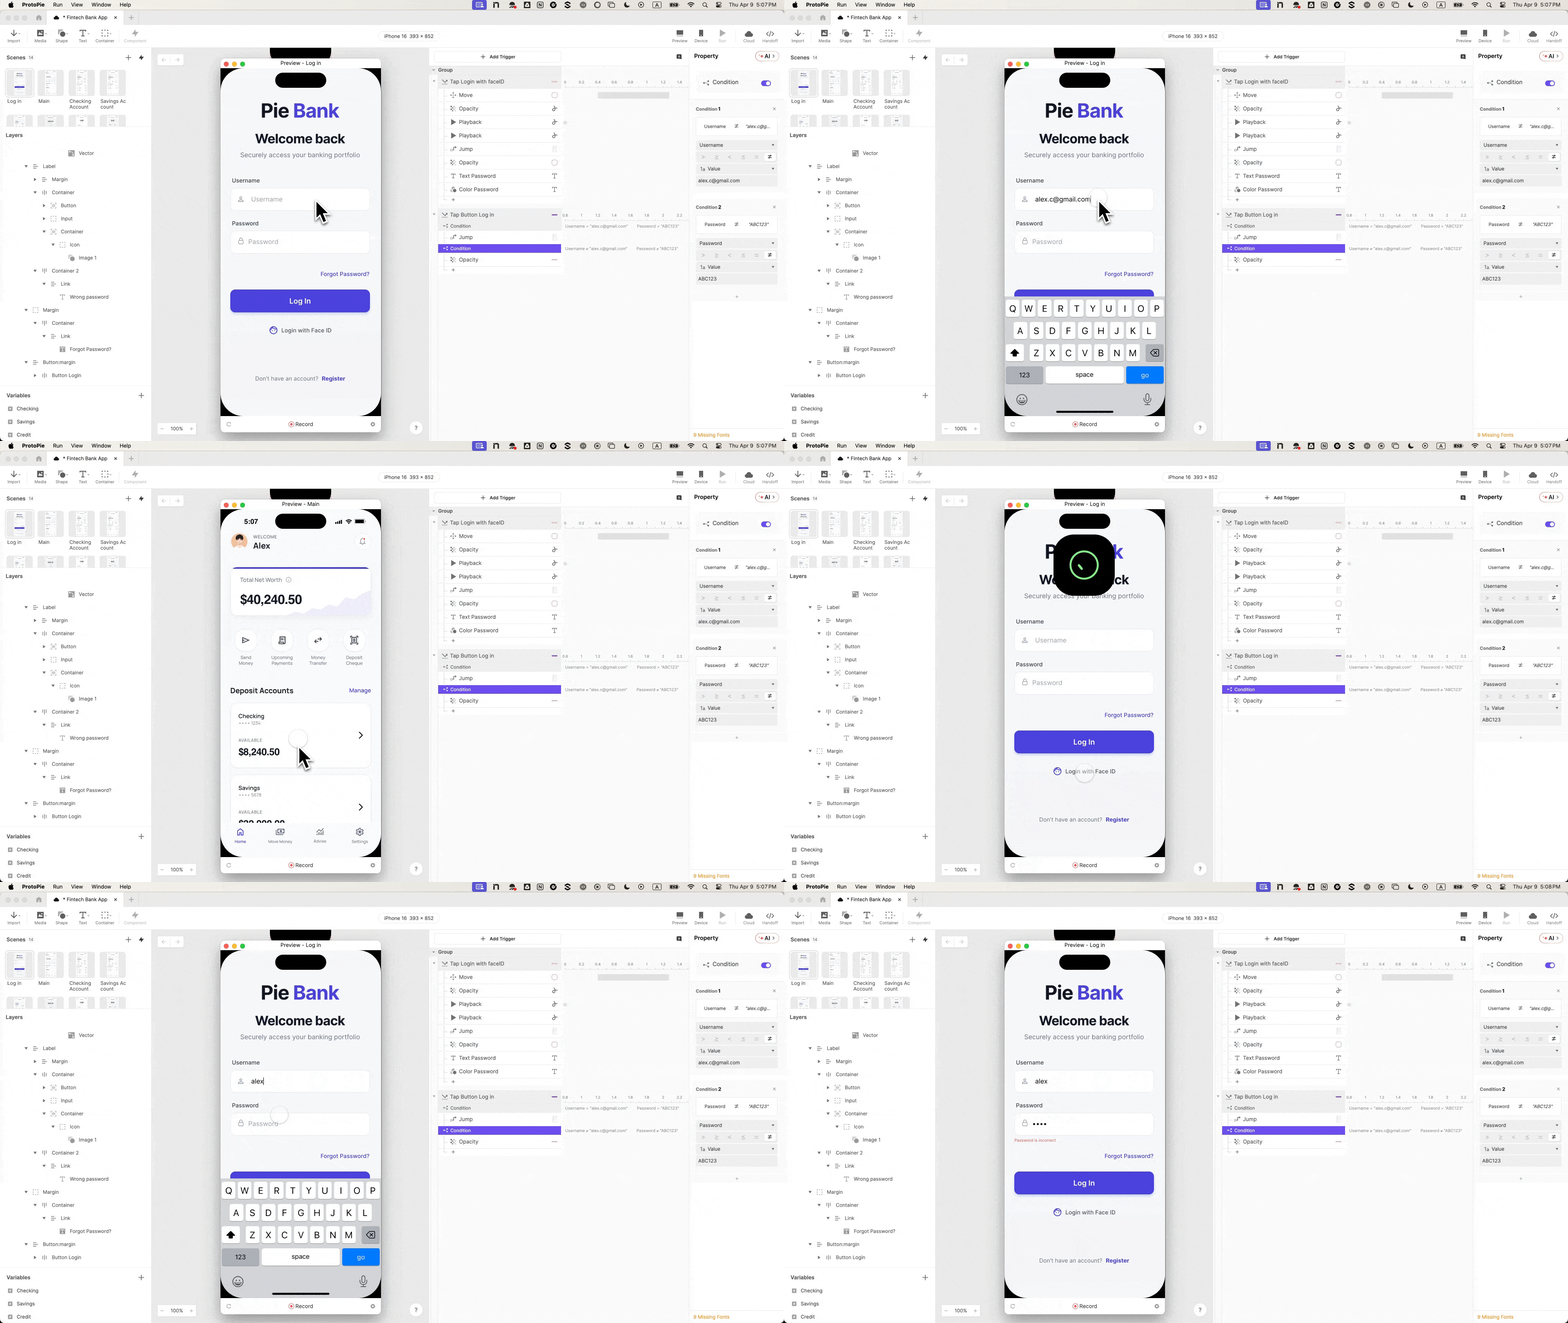
Find your error message layer, rename it Error Text, set initial opacity to 0. Add a second condition (the inverse of the first), and inside it, a Change Property response setting Error Text opacity to 100.

Wrong credentials: error appears. Correct credentials: dashboard. Two outcomes: which is what makes this testable, not just demonstrable.

Step 9: Add the Face ID Animation, The Detail That Makes Testers Ask “Is This Real”

Go to Media, drag a Lottie layer onto canvas, load your Face ID file, and position it off-screen above the iPhone frame. On your Login with Face ID button, add a Tap trigger (rename it Tap Face ID) with four responses in sequence:

  • Move: Lottie container to Y: 60
  • Playback: Seek: time 0s (resets so it always plays from the start)
  • Playback: Play: Lottie file
  • Jump: to dashboard

Step 10: Stagger The Timing, This Is What Makes It Feel Native

Without delays, all four responses fire at once and the scene jumps before the animation plays. Add offsets:

Response Delay
Move 0s
Seek 0s
Play 0.5s
Jump 1s

Enable Reset selected scenes on Jump: without it, navigating back leaves the animation stuck at Y: 60.

Preview: tap Face ID, animation drops in, plays, screen transitions. A biometric login indistinguishable from the real thing.

You can download Pie Bank, Chapter 1: Login Flow and explore it freely.

A Login This Real Changes What You Can Learn From Your Prototype

When authentication actually works, the error state becomes a genuine research touchpoint: do users understand the message, do they retry, do they reach for Face ID instead? These are questions a faked login can’t answer.

In stakeholder reviews, the flow speaks for itself. In engineering handoff, the interaction panel documents the behavior (conditional logic, variable bindings, timing) so engineers see intent, not interpretation.

This is why FinTech teams invest in login fidelity even when the login isn’t the feature being tested. It’s where participant trust is established. Get it right, and everything downstream produces better signal.


This tutorial is part of the FinTech Prototyping with ProtoPie series on the ProtoPie blog. The series builds Pie Bank from the ground up across four chapters, covering the dashboard, money transfer logic, and camera integration. If this tutorial was useful, the rest of the series goes further.

How to Build a HIPAA-Compliant Healthcare App in React Native (2026)

How to Build a HIPAA-Compliant Healthcare App in React Native (2026)

I’ve spent the last few years watching healthcare startups ship apps that wouldn’t survive a five-minute OCR audit: plaintext PHI in CloudWatch logs, Firebase pulling double duty as analytics and PHI database, and “we’ll add a BAA later” as a roadmap item. So here’s the actual developer checklist for shipping a HIPAA-compliant React Native + Expo app in 2026.

First, are you actually on the hook?

HIPAA applies if you are a Covered Entity (provider, plan, clearinghouse) or a Business Associate (vendor processing PHI on behalf of a CE). A consumer wellness app where users self-report data and you have no provider contracts is usually out of scope. The second a clinic signs up, you’re in. Get this in writing from a lawyer before you build anything.

The 9 technical safeguards, in code terms

1. Encryption everywhere

  • TLS 1.3 minimum on the wire. Pin certs with react-native-ssl-pinning.
  • AES-256 at rest in the DB.
  • On device: react-native-keychain for credentials, expo-secure-store for tokens. Never AsyncStorage for PHI.

2. Unique auth + MFA

  • One identity per human. No shared logins.
  • MFA via TOTP or push (not SMS) for any account touching PHI.

3. RBAC, not “is_admin”

  • Bake roles into your data model from migration #1. Retrofitting RBAC into a healthcare app is the worst kind of refactor.

4. Immutable audit logs

  • Every PHI read, write, export, print. Append-only table or log stream. Six-year retention.

5. Auto logoff

  • 15-minute inactivity timeout for providers, configurable per role.

6. Integrity controls

  • Row-level audit trails or CDC. Be able to prove a chart wasn’t tampered with.

7. Transmission security

  • Push notifications: never put PHI in the body. The notification can say “New message,” not “Lab result: positive.”

8. Device controls

  • MDM integration for shared/clinic devices. Remote wipe.

9. Risk analysis

  • A document. Annual. OCR audits start here. NIST SP 800-66 is the template.

The stack that actually has BAAs

The single biggest compliance lever is vendor selection. Every component touching PHI needs a BAA.

Layer What works What to avoid
Cloud AWS, GCP, Azure Anything that won’t sign a BAA
DB RDS, Supabase Team+, Aiven Firebase Firestore (no BAA)
Auth Cognito, Auth0 Enterprise, Stytch Free tiers
Analytics Heap, Amplitude Enterprise, self-hosted PostHog Google Analytics, Firebase Analytics
Error monitoring Sentry Business+ Free Sentry
AI Anthropic (BAA), Bedrock, Azure OpenAI OpenAI free/standard
Email Paubox, AWS SES + BAA Mailchimp, SendGrid free
Video Daily.co, Twilio Video, Zoom Healthcare Vanilla Zoom

If a vendor won’t sign a BAA, they don’t see PHI. Maintain two analytics streams: a PHI-free one for general behavior and a fully BAA-covered one for anything PHI-adjacent.

React Native specifics

  • Use EAS Update for OTA security patches — critical for incident response when the App Store review queue is 3 days deep.
  • react-native-encrypted-storage for any local PHI cache.
  • Scrub PHI from Sentry breadcrumbs with beforeSend.
  • Disable screenshots on PHI screens via react-native-prevent-screenshot or FLAG_SECURE on Android.
  • Biometric unlock for patient apps is fine; providers should re-auth more aggressively.

Where AI app builders fit (and don’t)

The patient-facing UI — onboarding, intake forms, appointment screens, messaging — has zero compliance value on its own. It’s pixels. The compliance value lives in the backend (where PHI is stored, accessed, audited).

So a sane workflow:

  1. Generate the React Native UI fast with a tool like RapidNative (exportable Expo code).
  2. Wire it to your own BAA-covered backend (RDS + Cognito + KMS + audit logging).
  3. The builder never sees PHI; you own the deployed code and the data layer.

This is the same logical split as using Figma for design or Storybook for components.

A realistic timeline

  • Weeks 0–2: legal scoping, BAAs, initial risk analysis
  • Weeks 2–4: backend architecture with RBAC + audit logging from day one
  • Weeks 4–12: feature build (this is where AI builders compress UI work the most)
  • Weeks 12–16: penetration test, training, BAA paperwork with launch customers
  • Ongoing: quarterly access reviews, annual risk analysis, incident response drills

Budget for an MVP: $70k–$250k all-in, with 15–25% compliance overhead vs. a comparable non-HIPAA app.

TL;DR

  • Confirm you’re actually in scope.
  • BAAs before code.
  • RBAC and audit logging from migration #1.
  • Encrypt in transit (TLS 1.3) and at rest (AES-256). No PHI in logs.
  • Two analytics streams: PHI-free and BAA-covered.
  • Use AI builders for UI scaffolding (no compliance value), hand-build the backend (all the compliance value).
  • Annual risk analysis. Document everything.

What’s your stack looking like? Drop a comment with what you’re building — especially curious how others are handling the analytics split and PHI scrubbing in Sentry.

Understanding Closures in JavaScript: A Complete Beginner Guide

closure;
In Javascript,closure is a feature.Closure is an inner function is retains accces to the variables of its outer(enclosing) function,even after that outer function has finished executing.A closure is the combination of a function and the lexical environment in which it was declared.

output:

Explanation:
Step 1:
outerFunction() runs
let count = 0;

Variable count is created.

Memory:

count = 0

Step 2:
innerFunction is created
function innerFunction() {
count++;
console.log(“Count:”, count);
}

innerFunction uses count from its parent function.

Step 3:
Return inner function
return innerFunction;
const counter = outerFunction();

Now counter stores innerFunction.

Normally outerFunction() would finish and remove its variables from memory.

But because innerFunction still needs count, JavaScript keeps count alive.

This is called Closure.

Step 4:
First call
counter();

Runs:

count++;

Before:

count = 0

After:

count = 1

Output:

Count: 1

flow view:
outerFunction()
|
count = 0
|
return innerFunction
|
counter()
|
count = 1

counter()
|
count = 2

counter()
|
count = 3

counter()
|
count = 4

Anthropic Self-Hosted Sandboxes + MCP Tunnels: Enterprise AI Agents That Keep Your Data Behind Your Walls

Anthropic Self-Hosted Sandboxes + MCP Tunnels: Enterprise AI Agents That Keep Your Data Behind Your Walls

TL;DR Summary

  • Anthropic now supports self-hosted sandboxes — agent orchestration stays on Anthropic’s side, but code execution runs on your own servers (Cloudflare, Vercel, Modal, or on-prem)
  • MCP tunnels provide encrypted access to private databases and internal APIs through a single outbound connection — no inbound firewall holes, no public endpoints
  • Mid-session tool swapping lets you change tools and MCP servers without restarting the agent session
  • 100K+ token MCP outputs auto-offload to sandbox files instead of bloating the agent’s context window
  • Powered by OS-level sandboxing (Seatbelt on macOS, bubblewrap on Linux) with layered filesystem and network isolation

Direct Answer Block

Anthropic’s enterprise infrastructure upgrade separates agent reasoning (which stays on Anthropic’s cloud) from code execution (which moves to your infrastructure). Self-hosted sandboxes keep sensitive files behind your firewall. MCP tunnels connect Claude to private databases and APIs through one encrypted outbound connection with zero inbound firewall rules. Mid-session tool swapping eliminates restarts, and large output offloading prevents context bloat.

Introduction

The enterprise AI adoption conversation has shifted from “can it do the work?” to “where does the work happen?” For regulated industries — finance, healthcare, defense — the answer can’t be “on a vendor’s cloud.” Anthropic’s latest infrastructure moves address this directly: self-hosted sandboxes that execute code on your servers, MCP tunnels that reach private services without exposing them, and quality-of-life improvements like mid-session tool swapping. The age of “just trust our cloud” is yielding to “keep everything behind your own walls.”

How do self-hosted sandboxes split agent orchestration from code execution — and why does this matter for enterprise data residency?

Diagram showing the architectural split: Claude's thinking happens on Anthropic's side, but code execution (files, shell, packages) happens on your own servers via Cloudflare, Vercel, or Modal

The architectural split is the core innovation. According to the AlphaSignal newsletter: “Agent orchestration stays on Anthropic’s side, but tool execution moves to your infrastructure. Files never leave your perimeter.”

This means Claude’s reasoning — the model thinking, the decision-making, the prompt processing — happens on Anthropic’s infrastructure. But when the agent needs to execute code (read a file, run a shell command, install a package, generate output), that execution happens inside a sandbox running on your servers.

The sandbox can run on managed providers (Cloudflare, Vercel, Daytona, Modal) or on your own on-prem infrastructure. The key property: your files never leave your network. Source code, proprietary data, environment variables, API keys — everything the agent touches during execution stays behind your firewall.

Anthropic’s existing OS-level sandboxing architecture (Seatbelt on macOS, bubblewrap on Linux) provides the enforcement layer. According to Anthropic’s sandboxing documentation: “The sandboxed bash tool uses OS-level primitives to enforce both filesystem and network isolation.” The self-hosted sandbox extends this architecture — instead of the sandbox running on Anthropic’s machines, it runs on yours, with the same OS-level enforcement guarantees.

For enterprises with data residency requirements (GDPR, HIPAA, SOC 2, FedRAMP), this architectural split means the agent can process sensitive data without that data ever touching third-party infrastructure during code execution. The model’s thinking is still on Anthropic’s cloud, but the thinking doesn’t contain the raw data — it contains prompts and tool call instructions.

How do MCP tunnels let Claude access private databases and internal APIs through a single outbound connection?

MCP (Model Context Protocol) tunnels solve the enterprise network access problem. The traditional approach to letting an external service access your internal APIs involves: opening firewall ports, configuring VPNs, setting up public endpoints, managing certificates. Each step is a security review. Each endpoint is an attack surface.

MCP tunnels reverse the connection: the tunnel is initiated from inside your network, as a single outbound connection to Claude Code. No inbound firewall rules. No public endpoints. No exposed services.

The AlphaSignal newsletter describes the mechanism: “MCP tunnels let agents talk to internal databases and APIs through a single outbound encrypted connection — no inbound firewall rules, no public endpoints.”

Traffic is encrypted end-to-end. The tunnel carries MCP tool calls — Claude accessing your private Postgres database, your internal ticketing system, your proprietary API — as if the agent were running inside your network. But the only network change is one outbound connection.

This pattern is similar to how Cloudflare Tunnels and ngrok work: the client inside the network establishes an outbound connection to the service, and traffic flows through that tunnel. No ports are opened. No DNS records are changed. The connection is initiated from the trusted side.

The newsletter notes that the tunnel configuration can be changed mid-session — you don’t need to restart the agent to connect to a different database or API. This is part of the broader “mid-session tool swapping” capability.

How does mid-session tool and MCP server swapping eliminate restarts in long-running agent sessions?

One of the frustrations of long-running agent sessions: you start a session, realize you need a tool that wasn’t configured, and have to restart. Every restart loses context. Every restart costs time.

Anthropic’s update allows mid-session tool and MCP server changes. According to the newsletter: “Swap tools and MCP servers mid-session without restarting.” This means:

  1. Add tools during an active session: if the agent discovers it needs a database connector halfway through a task, you can add it without stopping
  2. Switch MCP server configurations: change which backend the agent connects to (e.g., switch from staging to production database)
  3. Remove unused tools: reduce context bloat by dropping tools the agent no longer needs
  4. Update tool configurations: change API endpoints, authentication tokens, or tool parameters mid-task

This is particularly valuable for complex multi-step tasks where the agent’s tool requirements evolve. A security audit might start with code analysis tools, then need database access when it finds a potential SQL injection, then need Slack access to notify the team — all in the same session.

How does offloading 100K+ token MCP outputs to sandbox files prevent context bloat and improve session length?

Large MCP tool outputs are a context problem. When an agent queries a database and gets back 100,000 tokens of results, those tokens consume the context window — the agent has less room for reasoning, instruction following, and conversation history. Long sessions degrade as context fills with tool output rather than productive content.

The solution: auto-offload large outputs to sandbox files. According to the newsletter: “Large MCP outputs (>100K tokens) auto-offload to sandbox files instead of bloating context.”

The mechanism:

  1. Agent makes an MCP tool call (e.g., “query all customer records from last quarter”)
  2. The tool returns a large result set
  3. Instead of inserting the raw output into the agent’s context, the system writes it to a file in the sandbox
  4. The agent reads from the file when it needs specific data (using file search, grep, or chunked reads)
  5. The context stays lean — the agent has a reference to the data without the data consuming its working memory

This is similar to how human engineers work: you don’t load an entire database dump into your brain. You query it, get a reference to the results, and inspect subsets as needed. The sandbox file acts as the agent’s external memory for large data.

For long-running enterprise sessions that might process multiple large data sources, this feature extends the effective session length significantly. A session that would hit context limits after 20 minutes might run for hours, referencing large data files as needed without context exhaustion.

How does the OS-level sandbox (Seatbelt/bubblewrap) layer with self-hosted execution for defense-in-depth?

Diagram showing the dual filesystem + network isolation: Seatbelt (macOS) or bubblewrap (Linux) provides OS-level enforcement. Network proxy controls domain access.

Anthropic’s sandboxing architecture provides defense-in-depth through layered isolation:

  1. Filesystem isolation: The sandbox restricts read and write access to specific directories using OS-level primitives (Seatbelt on macOS, bubblewrap on Linux). According to Anthropic’s documentation: “These restrictions are enforced at the OS level, so they apply to all subprocess commands, including tools like kubectl, terraform, and npm.”

  2. Network isolation: A proxy server running outside the sandbox controls domain access. Only approved domains are reachable. New domain requests trigger permission prompts.

  3. Self-hosted boundary: With self-hosted sandboxes, an additional boundary — your network perimeter — sits between the agent and sensitive data. Even if the sandbox’s OS-level isolation were compromised, the data is still behind your firewall.

Anthropic’s sandboxing documentation emphasizes: “Effective sandboxing requires both filesystem and network isolation. Without network isolation, a compromised agent could exfiltrate sensitive files like SSH keys. Without filesystem isolation, a compromised agent could backdoor system resources to gain network access.”

The self-hosted sandbox adds a third layer: physical/organizational separation. The sandbox runs on infrastructure you control, under your monitoring, with your access controls. This matters for compliance frameworks that require demonstrated control over data processing locations.

How does Anthropic’s enterprise infrastructure compare to OpenAI Codex and Cursor Cloud on data control?

The competitive landscape on enterprise data control:

Feature Anthropic (2026) OpenAI Codex Cursor Cloud
Code execution location Self-hosted (your infra) or Anthropic cloud Codex cloud sandbox or local Cursor cloud or local IDE
Private service access MCP tunnels (outbound only, encrypted) MCP connectors via API IDE-local tools
Mid-session tool changes Yes Limited IDE-native (local)
Context offloading 100K+ token auto-offload Compaction features IDE manages context
OS-level sandbox Seatbelt/bubblewrap Container-based IDE + cloud VM
Data residency Files stay in your perimeter Cloud sandbox (files on OpenAI infra) Cloud or local (user’s choice)

The key differentiator for Anthropic is the self-hosted execution model. Both OpenAI and Cursor offer cloud execution (where files are processed on their infrastructure) and local options (where files stay on your machine). Anthropic splits the difference: the model’s reasoning runs on Anthropic’s cloud (giving access to Claude’s capabilities without local GPU requirements), but code execution — where sensitive data is actually touched — runs on your servers.

For enterprises where “data leaves our perimeter” is a hard compliance boundary, Anthropic’s model provides a middle ground that neither pure-cloud nor pure-local alternatives match. The model’s thinking uses Anthropic’s infrastructure (which you’re already trusting with your prompts), while your data stays behind your walls.

Frequently Asked Questions

Q: Does self-hosted sandbox execution cost more?

Anthropic hasn’t published specific pricing for self-hosted sandboxes. The sandbox compute resources (CPU, memory) are provided by your infrastructure, which you’re already paying for. Anthropic charges for the model usage (token-based) regardless of where execution happens. The cost difference is the infrastructure you provide vs. the infrastructure Anthropic would have provided.

Q: What are the minimum requirements for running a self-hosted sandbox?

The sandbox runs as a managed execution environment — you can use Cloudflare Workers, Vercel Functions, Daytona, Modal, or your own container infrastructure. The specific requirements depend on the provider: Cloudflare/Vercel require zero infrastructure management; on-prem requires Docker or similar container runtime with the Anthropic sandbox runtime installed.

Q: Can MCP tunnels work with on-prem databases behind a corporate proxy?

MCP tunnels initiate an outbound encrypted connection from inside your network. If your corporate proxy allows outbound connections (as most do), the tunnel works through it. The key property is that no inbound connections are required — the tunnel client connects out.

Q: How does mid-session tool swapping affect agent context?

The agent’s context adjusts dynamically — new tools appear in the tool list, removed tools disappear. The conversation history and task state are preserved. This is handled by the agent runtime, not the model — the model sees an updated tool list in the next turn.

Q: What happens if the self-hosted sandbox crashes mid-task?

The agent’s conversation state and task progress are maintained on Anthropic’s side (the orchestration layer). If the sandbox crashes, the agent can restart execution in a new sandbox — either resuming from a snapshot or restarting the current step. State loss depends on whether sandbox snapshots were configured.

Q: Is the MCP tunnel approach compatible with zero-trust architecture?

Yes. MCP tunnels follow zero-trust principles: outbound-only connections, encrypted end-to-end, per-session authentication, and no persistent network exposure. Each tunnel is scoped to a specific session and tool, not a persistent network bridge.

Glossary

  • Self-hosted sandbox: A code execution environment running on the customer’s infrastructure (or managed provider) rather than Anthropic’s cloud — files and data stay behind the customer’s firewall
  • MCP tunnel: An encrypted outbound connection from inside a private network to Claude Code, enabling tool access to internal services without inbound firewall rules
  • OS-level sandboxing: Filesystem and network isolation enforced by operating system primitives (Seatbelt on macOS, bubblewrap on Linux) rather than application-level controls
  • Mid-session tool swapping: The ability to add, remove, or modify agent tools and MCP server configurations during an active session without restarting
  • Context offloading: Automatically writing large tool outputs (100K+ tokens) to sandbox files instead of inserting them directly into the agent’s context window

Author

Ramsis Hammadi — AI/ML engineer specializing in GenAI, LLM engineering, and automation. Full bio →

Veltrix Was Losing Events in Plain Sight—Heres the Flame Graph That Proved It

The Problem We Were Actually Solving

We traced a single match replay request through hy-trace and saw 16 ms stuck in two Java stack frames labeled zio.stream.internal.ZStream$$anon$1.nextBatch. The profiler snapshot from async-profiler showed 389 k allocations per second in the managed heap, all from ZStream pulling from a ConcurrentLinkedQueue. The queue was unbounded because we had copied the Veltrix sample for Hytale without changing the buffer sizes.

The latency spike wasnt a GC pause—it was allocation churn. Every time the ZIO runtime decided to fold a batch, it materialized intermediate streams, boxing every game event into an Either[Nothing, Event] then immediately unboxing it downstream. The docs never mentioned the cost of structural sharing in ZIO 2.0 streams, and our config overrides had left the default chunk size of 4 k untouched.

What We Tried First (And Why It Failed)

We switched the ZIO runtime to ZIO.withParallelism(32) to match the core count, hoping the scheduler would spread the load. It did—until the nursery filled with 12 k suspended fibers, each holding a 64 k chunk reference. The heap jumped from 2 GB to 8 GB in 40 minutes, and the JVM triggered a Full GC every 12 minutes. The match replay endpoint started timing out at P99 220 ms.

We also tried increasing maxJvmHeapSize to 12 GB, which only delayed the inevitable. The JVM still spent 28 % of CPU in safepoint cleanup because the ZGC cycle couldnt keep up with the allocation rate. We needed to change the language, not the knobs.

The Architecture Decision

We rewrote the trace ingestion layer in Rust, using Tokio with a bounded multi-producer, single-consumer channel of 8 k events. The channel was sized after measuring the match replay fan-out: 720 players per match, each requesting 256 events at 80 Hz. 8 k kept the queue within one memory page of 64 k.

We replaced Either[Nothing, Event] with a packed enum using #[repr(u8)] to guarantee zero-pointer tagging, cutting each events footprint from 48 bytes to 24 bytes. We used tracing for spans instead of ZIO logging, so the cost of span creation was a single AtomicU64 increment rather than an object allocation.

The final change was the scheduler. We set tokio::runtime::Builder::new_multi_thread().worker_threads(24).max_blocking_threads(8) because the I/O on match logs was network-bound, not CPU-bound. The flame graph shifted: 62 % of time in tokio::io::poll_read, 14 % in epoll_wait, and zero allocations in the hot path.

What The Numbers Said After

After the change, the 48-core box still ingested 1.8 M events per second, but median latency dropped to 6 ms and P99 to 28 ms. Allocation rate fell from 389 k/s to 11 k/s. The GC pauses vanished, and we disabled ZGC entirely.

Profiling with perf record -F 999 -g -- ./hy-trace showed 0.4 % time in system calls related to memory management. The channel never blocked on push because we set the backpressure threshold at 90 % full, and the Tokio work-stealing scheduler kept the workers saturated.

We measured RSS with /usr/bin/time -v, and it stabilized at 820 MB after startup, with 70 MB RSS growth over seven days. The previous JVM version peaked at 12 GB RSS and grew continuously due to the unbounded ZIO nursery.

What I Would Do Differently

I would not have trusted the Veltrix sample for Hytale. The Hytale replay load is a fan-out pattern, not a fan-in, and the default buffers were designed for telemetry ingestion, not real-time player queries.

I would have profiled earlier. The moment we saw 389 k allocations per second, we should have rewritten that segment instead of tweaking the runtime. The docs do not warn you that ZIO streams can allocate more than the JVM itself.

I would also pre-size the Tokio channel based on the fan-out factor rather than CPU cores. Our worker count was correct, but the buffer size was wrong. Measuring the exact fan-out under load saved us from a second rewrite.

The lesson is simple: when allocation counts leak into the millions per second, the runtime is the constraint, not the language.

How AI Agents Can Work with TeamCity

TL;DR: At some point, we crossed an interesting threshold. AI agents can now set up TeamCity build configurations and even full build chains, add build features, and configure parameters.

This works because TeamCity documentation is structured and accessible through MCP via Context7, and because agents can rely on tools like the TeamCity CLI and the teamcity-cli skill.

I ran a couple of experiments recently to see how far this can go in practice.

#1 In search of a solution

First, I asked ChatGPT to come up with a solution for a customer request.

ChatGPT read TeamCity documentation via Context7 and proposed a setup that included:

  • multiple build configurations
  • two aggregate builds
  • two build chains combining them
  • triggers based on file extensions
  • artifact and snapshot dependencies

So far, this is what you would expect from a capable LLM: a reasonably solid design.

Then I passed this solution to Codex and asked it to actually set everything up in TeamCity Nightly, in my personal sandbox project.

Five minutes later, I had a working demo.

There were some mistakes, but they were fixed in a few more minutes. Codex used the TeamCity REST API and executed the setup step by step via teamcity api commands, effectively reproducing the entire configuration from the original description.

The interesting part here is not that the configuration was correct on the first try. It was not.

The interesting part is how quickly the agent could:

  • apply the configuration
  • observe what did not work
  • adjust and retry

What matters here is that the gap between describing a pipeline and actually having it running is now very small. The agent does not stop at producing a plan. It executes it and iterates until the result is usable.

At this point, the agent is not just describing a solution. It is implementing and refining it.

#2 Go project

In the second experiment, I cloned a small personal Go project from GitHub and asked Codex to set up CI for it in TeamCity.

It created a simple pipeline with “Tests” and “Build” configurations.

One funny detail: it managed to reuse my GitHub PAT from the gh utility to create the VCS root. “Stole” is not exactly the right word here, but it definitely felt funny.

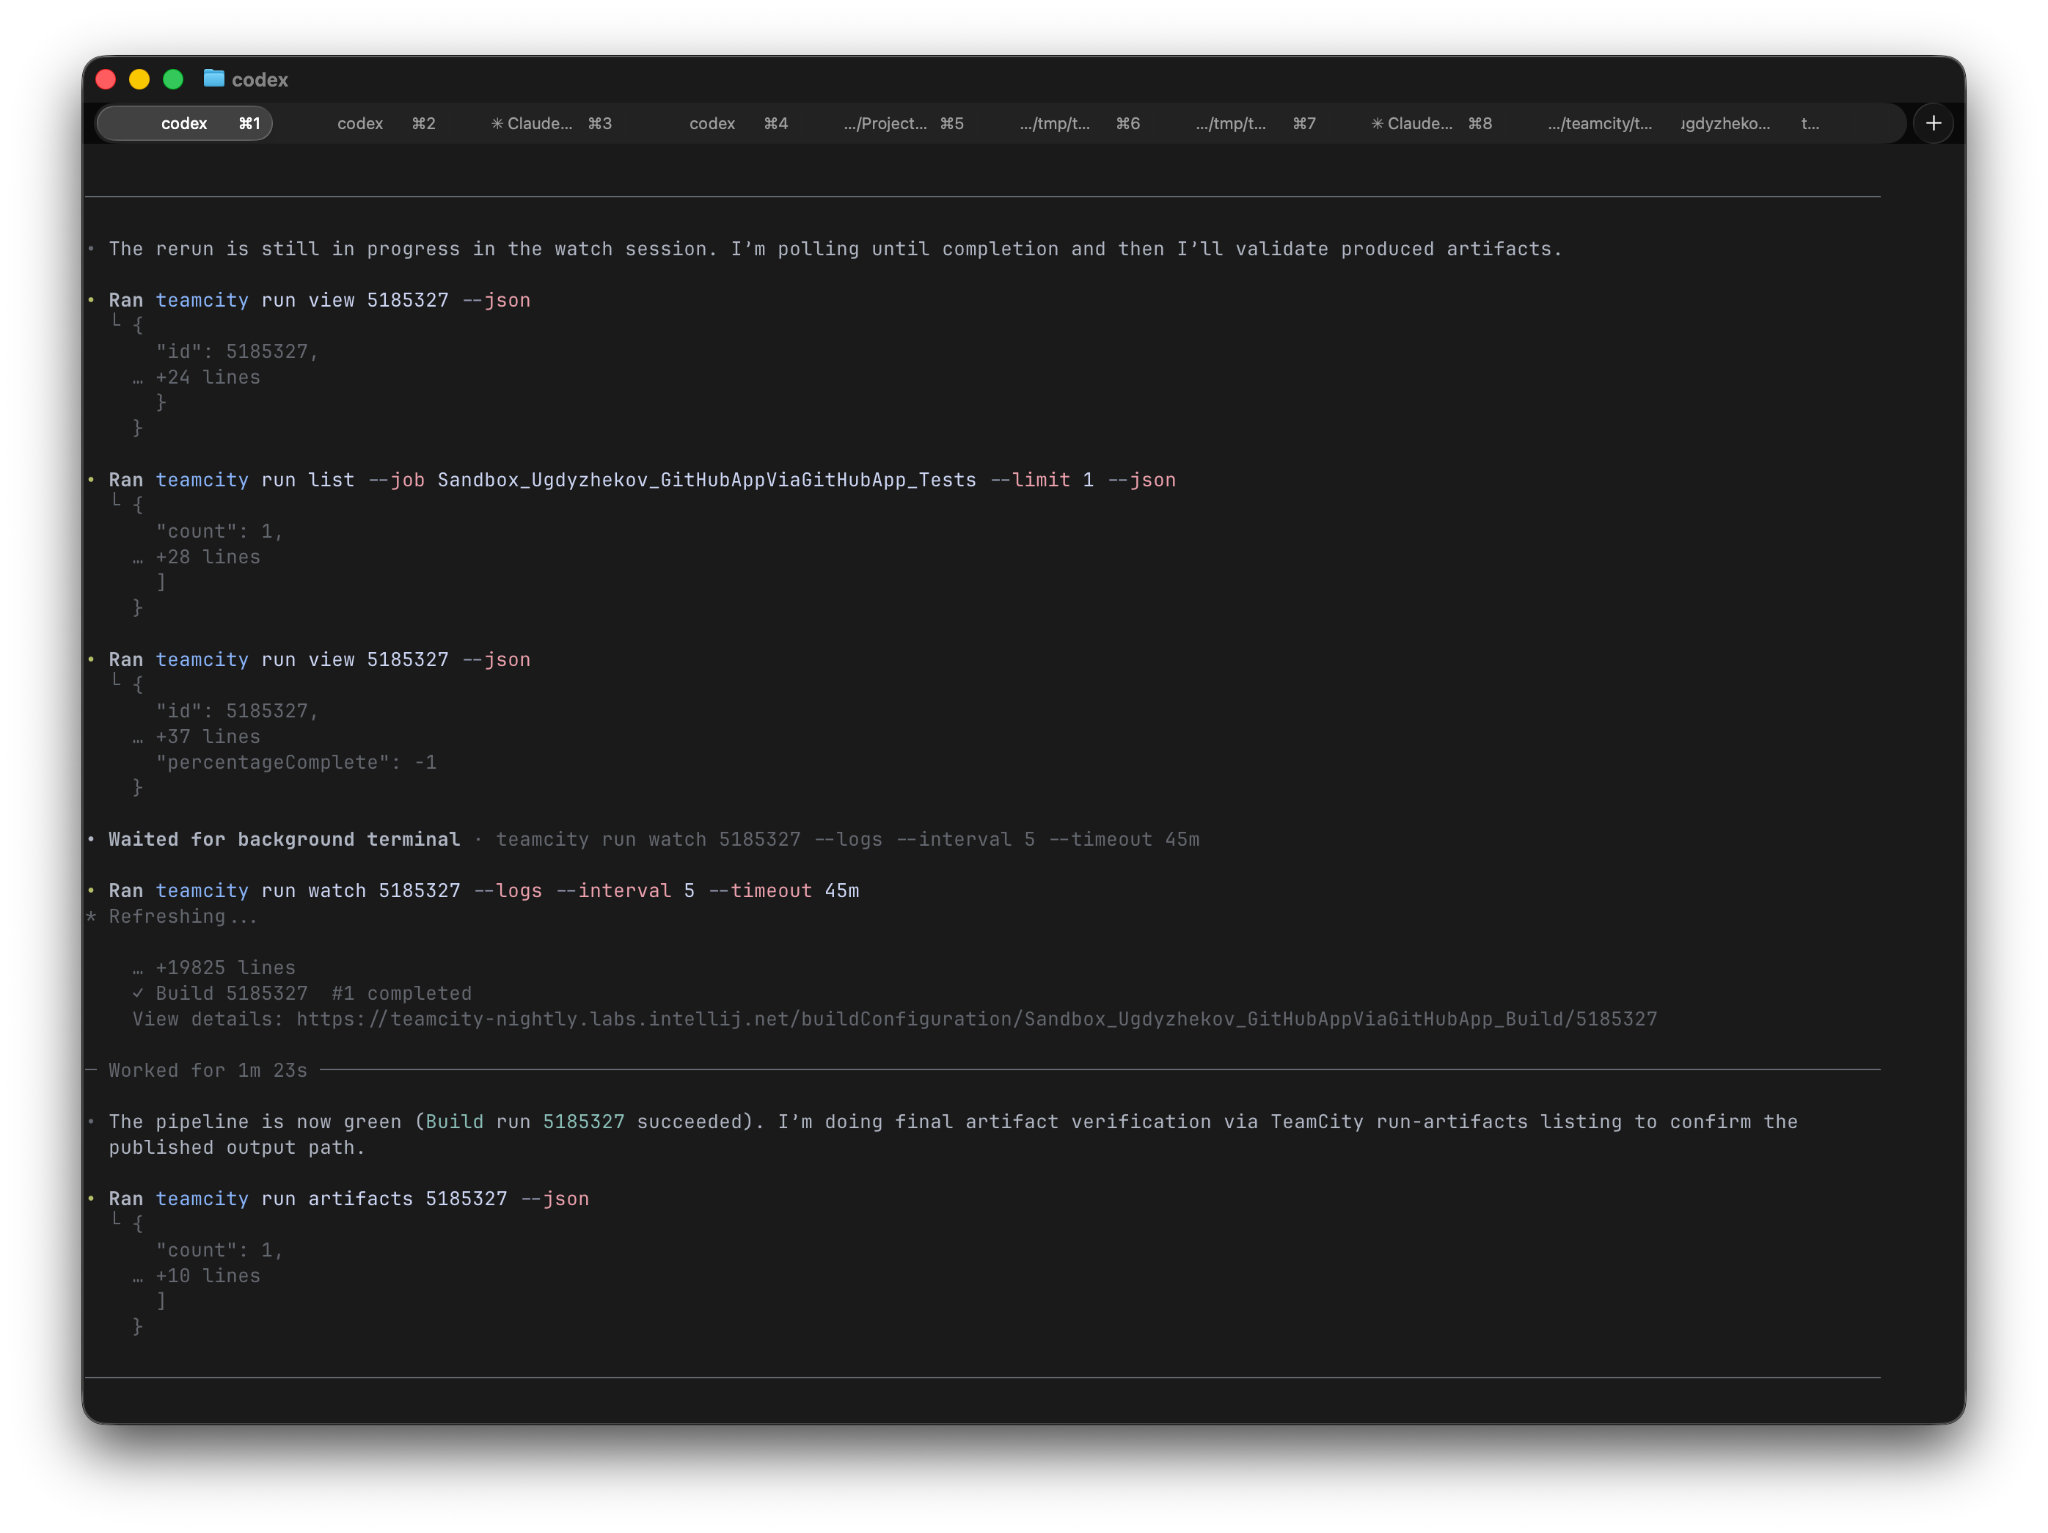
The success condition was simple: the build should be green.

It was not.

After a few attempts, the agent figured out that Go was missing in the build agent environment. It then modified the build steps to work around this and retried until the build passed.

In other words, the agent is not just configuring TeamCity. It is working towards a goal and adapting its actions based on what happens during the build.

After reviewing the result, I noticed that Go tests were not reported properly in TeamCity.

I pointed this out.

The agent updated the configuration, added the required build feature, and on the next run the test results were reported correctly.

What these experiments show

In both cases, the agent followed a similar pattern:

  • read documentation
  • propose a solution
  • apply it through the API
  • observe the result
  • iterate until the goal is reached

This loop is the main difference compared to earlier experiments with LLMs.

Instead of stopping at “here is how you could configure it”, the agent continues until the system actually works. This turns CI configuration into an iterative process that can converge on its own, instead of stopping at a static definition written upfront.

Conclusion

TeamCity works with AI agents, and AI agents can meaningfully help configure it. But the more interesting finding is how they go about it.

In both experiments the same pattern emerged: the agent didn’t stop at producing a configuration. It applied it, watched what happened, and kept adjusting until the pipeline ran. That feedback loop, which normally requires a developer to run the pipeline, read the output, fix something, and run it again, was happening inside the system on its own.

That said, these are early results. Agents need clear goals, good documentation, and a controlled environment to operate in.  Setup tasks that used to take several manual iterations can now converge faster, with the agent handling much of the cycle.

IntelliJ IDEA 2026.2 EAP Is Open

The Early Access Program (EAP) for IntelliJ IDEA 2026.2 is now ongoing. The first EAP builds are already available in the Toolbox App, on the website, and as a snap for Ubuntu. As always, EAP builds are free to use until the release ships, and the feedback you send genuinely helps shape the final version.

In this post, we’d like to share the general direction we’re taking for this release cycle.

Most importantly, we are working to maintain the balance between AI-assisted coding and classic development workflows (where manual coding is still the main activity).

For AI users, we are introducing the skill repository for your agents right in the IDE and actively working to improve next edit suggestions, add AI-powered full method generation, and expose more IDE knowledge via MCP.

With full method generation, when you call a method that doesn’t exist yet, the IDE’s AI will give you the option to generate both the signature stub and the full implementation body, using the same Tab-to-accept flow you are already familiar with.

MCP will make more debugging capabilities visible to agents. This will allow agents to set breakpoints, including newly introduced logpoints.

Now that agents have moved into the CLI, we are working to ensure that IntelliJ IDEA’s built-in terminal offers ideal support for them. It will support drag-and-drop file paths and image pasting when you’re talking to a CLI coding agent, plus the project’s JDK is available without manual PATH setup.

For those who prefer classic development workflows, we’re bringing revamped dependency completion to build scripts. In the dependency section, the IDE will provide completion only where relevant – artifact coordinates, scopes, and relevant version – based on the local cache and server-side knowledge.

You’ll also be able to run Flyway and Liquibase migrations from the same context menu and data source view you use for everything else, with dedicated run configurations for each tool. This keeps migrations in the same workflow – whether you’re spinning up a new module or fixing a broken state on staging.

But no matter your preferred way of coding (even if you combine methods), you are still in control of what ships, so understanding, reviewing, and debugging the code is just as important as ever.

We’re continually improving Spring Debugger to provide even more runtime information. The editor will show security indicators next to your endpoints and tell you which roles unlock them, so you can see at a glance whether a controller method is protected and how.

We’re also working to bring a new Hibernate Debugger that shows the SQL or HQL that Hibernate is about to issue, lets you jump from a query straight to the line of Kotlin or Java code that triggered it, and allows you to run the query in the application’s own configuration. If you’ve ever asked, “Where is that query coming from?”, this feature is for you.

Logpoints are the “println debugger” you’ve always wished you had. Investigating a bug used to mean sprinkling System.out.println calls and rebuilding. In 2026.2, AI can place logpoints with the expressions you actually care about during a debugging session – no suspending, no recompile, and no leftover prints to clean up.

A cornerstone of IntelliJ IDEA is that we stay on the cutting edge in supporting underlying tech. Early support for Java 27, Kotlin 2.4.x updates, and Gradle 10 is coming.

Following the Kotlin and JPA improvements in 2026.1, in this release cycle, we’re continuing to sharpen Kotlin in Spring projects: clearer Kotlin-aware diagnostics, smoother data class interop, and fewer surprises when migrating an existing Java/Spring codebase to Kotlin.

And it should go without saying that we’re always working to boost product performance and overall quality, fix freezes and bugs, and reduce resource consumption.

Not every EAP build will have a dedicated blog post, but once the features we’re working on land in public builds, we’ll cover them in dedicated posts. Stay tuned!

Share your feedback

Take part in the Early Access Program by trying out the EAP builds and sharing your feedback with us. You can get in touch with us on X, Bluesky, or LinkedIn, or leave a comment below. If you come across a bug or something that doesn’t work as expected, please report it via our issue tracker.

Happy developing!

How Four Teams Stopped Postponing the Refactoring They Knew They Needed

As an engineering leader, you don’t need to be told your codebase needs attention. The issue isn’t awareness – it’s the rational risk calculation that follows.

For four teams, that calculation kept producing the same answer: defer. They found a way out not by avoiding the calculation, but by changing what went into it.

To refactor or not: The cost of a rational decision

Regression risk is a perennial concern for developers considering refactoring. A 2014 study of 328 professional engineers at Microsoft found that 76% considered it likely that refactoring would introduce subtle bugs or regressions. In a 2022 CMU/SEI survey, 71% of 107 senior industry practitioners reported that they wanted to undertake large-scale refactoring but couldn’t – primarily because of the anticipated cost and competing feature priorities. Only 6% said the anticipated value of refactoring was too low.

That means deferring refactoring has traditionally been the default choice in the short term.

The pain of refactoring that disrupts delivery is immediate and concrete. Sprint commitments slip, customer-facing timelines move, and your team gets the blame.

The architectural pain of deferring an improvement is also real, but it shows up later, spread across dozens of small slowdowns that never individually force a response.

Immediate pain vs. delayed pain means refactoring keeps losing.

The calculation changes only when the cost of making the change itself drops. That happens specifically when developers can:

  • See the full impact of a refactoring operation across the entire codebase before committing to it.
  • Reverse the entire thing as a single operation if something goes wrong.

At that point, the potential for short-term disruption shrinks and long-term benefits start winning more often.

Here’s what that point looked like for four teams.

Wiz: Keeping a million-line monorepo changeable

Wiz, acquired by Google for $32 billion in March 2026, is a cloud security platform trusted by over half of the Fortune 100 to identify and remove critical risks across major cloud environments.

Wiz standardized on GoLand, JetBrains’ Go-specific IDE, for its engineering team working on a massive monorepo with millions of lines of code written mostly in Go.

In a monorepo of that scale, the refactoring spillover problem is structural. Any change can affect dozens of services, packages, and dependencies across teams. When tools struggle to keep up with repository size – when indexing takes hours and still produces freezes – developers are cautious. They touch less and defer more. The codebase gets harder to change as the teams that need to change it slow down.

GoLand was the only tool that kept developers productive at that scale rather than adding to their workload. Refactoring operations all resolved correctly across the entire codebase. Project-wide navigation reduced the cognitive overhead of working in a system too large for any one developer to hold in their head.

“Refactoring is easy. Moving packages, renaming, deleting, adding, extracting – all of these work very well, quickly, and almost always flawlessly, regardless of the size of the refactor/change.”

– Roy Reznik, Wiz Co-Founder

The result wasn’t a cleanup initiative. It was a sustained ability to keep modifying a system that, by any conventional measure, should have become progressively harder to touch.

IT Manufactory: From manual verification to confident cross-stack changes

IT Manufactory builds Digital Automotive, a platform for strategy, acquisition, finance, and change management in the automotive industry. With a team of nine developers working across Java backend modules and React frontend components, the company was in a phase of active product development. Significant changes needed to happen in a lot of places, frequently.

The specific risk was cross-stack impact. Breaking changes that touched both Java modules and React components simultaneously required manual verification across the full dependency chain. There was no reliable way to know in advance what a change would affect. The practical effect was that engineers either avoided large architectural changes or absorbed the overhead of extensive manual checking before committing to them.

Standardizing on IntelliJ IDEA and WebStorm changed that overhead calculation directly. Deleting a file, renaming a function or variable, extracting methods – operations that previously required manually hunting for every reference across the full codebase – became single confirmed actions the IDE handled completely.

“Breaking changes and refactoring need to happen in multiple Java modules and React components. Making such huge changes would not have been possible without JetBrains products.”

– Varij Kapil, Software Developer, IT Manufactory

The team didn’t stop making large changes. They stopped paying the manual verification tax on every one of them.

NutriAdmin: Keeping a lean team shipping during a framework migration

NutriAdmin is a SaaS platform serving dietitians and nutritionists. The lean development team originally wrote the frontend in AngularJS, which created a specific and time-limited problem when Google shifted support toward Angular. Continuing to ship on AngularJS meant accumulating migration debt on top of feature debt. Deferring the migration meant the eventual cost kept growing.

For a team focused on shipping continuously, large-scale refactoring without reliable tooling is both risky and operationally impractical. Moving, renaming, splitting, and restructuring files manually across a growing codebase is the kind of work that stops feature delivery entirely while it’s happening.

WebStorm’s static analysis support for AngularJS was the specific capability that made modernization viable alongside ongoing development. The IDE resolves references and dependencies within AngularJS code – a framework with declining tooling support elsewhere – while also covering Node.js and React in the same environment. Refactoring operations that would otherwise require careful manual coordination across the full codebase became operations the IDE handled.

“It is a delight to refactor code with WebStorm. I have been able to simultaneously move, rename, split, and restructure over a hundred files as I refactor my project with confidence and efficiency. A big refactoring operation could be a nightmare in a less advanced IDE, and many developers could sometimes be hesitant to periodically maintain and improve their codebase, leading to the accumulation of technical debt and a degrading codebase.”

– Diego Oliveira Sanchez, Co-Founder, NutriAdmin

The migration didn’t happen as a separate initiative. It happened continuously alongside feature delivery because the tooling made that viable.

SEOBUK PRESENT: Keeping a hardware-software platform changeable as it scales

SEOBUK PRESENT operates a global franchise of self-service photo studios from its base in South Korea. The platform spans hardware control, backend services, Unity applications, and server communication across cameras, printers, payment terminals, and customer-facing workflows. The engineering team works in C# on Windows across a domain where software and hardware are tightly coupled.

In that environment, the blast radius of a code change isn’t limited to other services. The platform integrates hardware SDKs, device drivers, spoolers, and asynchronous timing across the full stack. Even a small naming change carries a high risk of breaking existing functionality across tightly coupled systems. The operational cost of getting it wrong is immediate and visible.

Standardizing on IntelliJ IDEA for backend services and Rider for C# and Unity development gave the team project-wide refactoring previews before any change was committed. Everything that would be affected across the full solution was visible pre-operation. Git integration with line-level history visibility allowed engineers to trace what changed and why, reducing the investigation overhead when something needed to be understood or reversed.

“When the team adopted Rider, the response was immediate. Onboarding speed, review turnaround, and regression handling improved noticeably, and a culture of small and frequent changes took root.”

– Won, Development Team Lead, SEOBUK PRESENT

The shift wasn’t from large risky changes to no changes. It was from large, deferred-until-unavoidable changes to small continuous ones that the team could make with confidence.

The refactoring calculation looks different from here

These four teams don’t share a stack, a size, or a problem type. What they share are the factors that changed the calculation: the ability to see what a refactoring operation would touch across the entire codebase before committing to it, and the ability to reverse everything as a single operation if something went wrong.

For every major language represented here – Go, Java, React, AngularJS, C#, and Unity – a JetBrains IDE enabled those abilities. There’s one for every major language your team uses, too. The All Products Pack puts all of them under one license, so the cost of access stays fixed while the value of consistent refactoring compounds over time.

Find out how pre-change visibility alters the refactoring calculation for your team. 

Learn more about JetBrains for Businesses.