For web professionals, session management is a balancing act between user experience, cybersecurity, and resource usage. For people with disabilities, it is more than that — it is a barrier to buying digital tickets, scrolling on social media, or applying for a loan online. Session timeout accessibility can be the difference between a bad day and a good day for those with disabilities.
For many, getting halfway through an important form only to be unceremoniously kicked back to the login screen is a common experience. Such incidents can lead to exasperation and even abandonment of the website entirely. With some backend work, web professionals can ensure no one has to experience this frustration.
Why Session Timeouts Disproportionately Affect Users With Disabilities
A considerable portion of the global population has cognitive, motor, or vision impairments. Worldwide, around 1.3 billion people have significant disabilities. Whether they possess motor, cognitive, or visual impairments, their disabilities affect their ability to interact with technology easily. They can all be disproportionately affected by session timeouts, making session timeout accessibility a critical issue.
Session timeouts are inaccessible for a large percentage of the population. An estimated 20% of people are neurodivergent, meaning timeout barriers don’t just affect a small subset of users — they impact a substantial portion of any website’s audience. As a result, some users may look inactive when they are not. Strict timeouts create undue pressure.
Motor Impairments and Slower Input Speeds
For instance, someone with cerebral palsy tries to purchase tickets online for an upcoming concert. Due to coordination difficulties and muscle stiffness, they may enter their information more slowly than a non-disabled person would. They select the date, choose their seats, and fill out personal information. Before they can enter their credit card details, a timeout pop-up appears. They have been logged out due to “inactivity” and must restart the entire process.
This situation is not entirely hypothetical. Matthew Kayne is a disability rights advocate, broadcaster, and contributor to The European magazine. He describes the effort required to navigate websites as someone with cerebral palsy. He explains how the user interface is often poorly designed for adaptive devices, and he worries his equipment won’t respond correctly. After carefully navigating each page, he is suddenly logged out. In a moment, one timed form can erase hours of work, and it’s not just a matter of inconvenience. A single failed attempt can delay support or cause him to miss appointments.
Motor impairments can slow input speed, making it appear the user is not at their computer. As such, people who experience stiffness, hand tremors, coordination challenges, involuntary movements, or muscle weakness are disproportionately affected by session timeouts. According to the DWP Accessibility Manual, it can take multiple attempts for adaptive technology to register input, slowing users down considerably. Even if they receive a warning, they may not be able to act fast enough to prove they are still active.
Cognitive Impairments and Processing Time
Session timeouts can also create accessibility barriers for those with various types of cognitive differences. Strict timeouts can create undue pressure that assumes everyone processes information at the same speed. Users may appear inactive when they are actually reading, thinking, or processing.
Cognitive differences encompass a wide range of experiences, including neurodivergences like autism and ADHD, developmental disabilities like Down syndrome, and learning disabilities like dyslexia. Many people are born with cognitive differences. In fact, an estimated 20% of people are neurodivergent, making up a large portion of any website’s audience. Others acquire cognitive disabilities later in life through traumatic brain injury or conditions like dementia.
People with cognitive disabilities often need more time to complete online tasks — not because of any deficit, but because they process information differently. Design choices that work well for neurotypical users can create unnecessary obstacles for people with ADHD, dyslexia, autism, or memory-related conditions.
Invisible session timeouts are particularly problematic for people who experience memory loss, language processing differences, or time blindness. For example, neurodivergent technology leader Kate Carruthers says ADHD has affected her perception of time. She has time blindness and can’t reliably track how much time has passed, making estimates unhelpful.
When websites depend on users estimating remaining time before a session expires, they quietly exclude people — not just those with formal ADHD diagnoses, but anyone who experiences time differently or processes information at a different pace.
Vision Impairments and Screen Reader Navigation Overhead
Since blind or low-vision users cannot visually scan a page to find what they need, they must listen to links, headings, and form fields, which is inherently more time-consuming. More than 43 million people worldwide are affected by blindness, while 295 million have moderate to severe vision impairment, which makes this a significant accessibility concern for any global-facing website.
As a result, these users’ sessions may expire even if they are active. Live timers and 30-second warnings do little to help, as they are not built with screen readers in mind.
Bogdan Cerovac, a web developer passionate about digital accessibility, experienced this firsthand. The countdown timer informed him how long he had left before being logged out due to inactivity. By all accounts, it worked fine. However, he describes the screen reader experience as horrible, as it notified him of the remaining time every single second. He couldn’t navigate the page because he was spammed by constant status messages.
Common Timeout Patterns That Fail Accessibility Requirements
According to the National Institute of Standards and Technology, session management is preferable to continually preserving credentials, which would incentivize users to create authentication workarounds that could threaten security. However, several common timeout patterns fail to meet modern standards for session timeout accessibility.
Silent Timeouts and Insufficient Warnings
Many websites either provide no warning before logging users out, or they display a brief, seconds-long pop-up that appears too late to be actionable. For users who navigate via screen reader, these warnings may not be announced in time. For those with motor impairments, a 30-second countdown may not provide enough time to respond.
Let’s consider the Consular Electronic Application Center’s DS-260 page, which is used to apply for or renew U.S. nonimmigrant visas. If an application is idle for around 20 minutes, it will log the user off without warning. The FAQ page only provides an approximate time estimate. Someone’s work only saves when they complete the page, so they may lose significant progress.
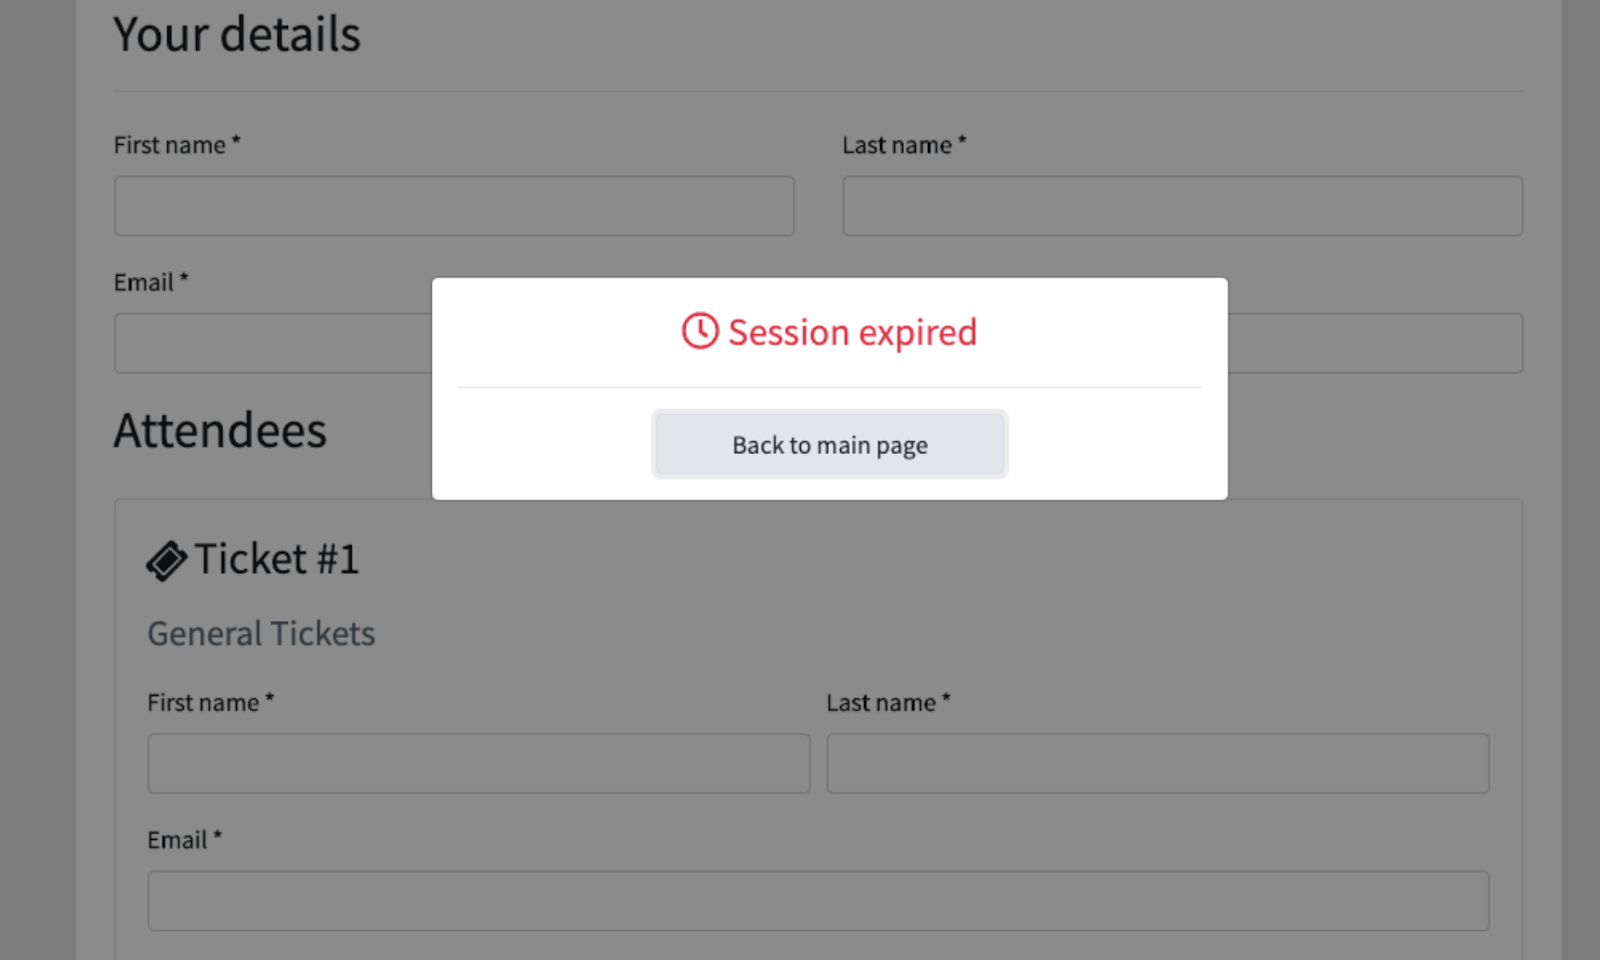
Nonextendable Sessions
An abrupt “session expired” message is frustrating even for individuals without disabilities. If there is no option to continue, users are forced to log back in and restart their work, wasting time and energy.
Form Data Loss on Expiration
Unless the website automatically saves progress, visitors will lose everything when the session expires. For someone with disabilities, this does not simply waste time. It can make their day immeasurably harder. Imagine spending an hour on a service request, job application, or purchase order only for all progress to be completely erased with little to no warning.
Design Patterns That Balance Security and Accessibility
Inconsistent timeout periods and a lack of warnings lead to the sudden, unexpected loss of all unsaved work. For long, complex forms, like the DS-260, a poor user experience is extremely frustrating. In comparison, the United Kingdom’s application for pension credit is highly accessible. It warns users at least two minutes in advance and allows them to extend the session. It meets level AA of the WCAG 2.2 success criteria, indicating its accessibility.
People with disabilities are disproportionately affected by the unintended consequences of poor session management. Thankfully, session timeouts’ inaccessibility is not a matter of fact. With a few small changes, web professionals can significantly improve their website’s accessibility.
Advance Warning Systems and Extend Functionality
Websites should clearly state the time limit’s existence and duration before the session starts. For instance, if someone is filling out a bank form, the first page should exist solely to inform them that it has a 60-minute time limit. A live counter that updates regularly can help them track how much time remains. Also, users should be told whether they can adjust the session timeout length.
Activity-Based vs. Absolute Timeouts
An activity-based timeout logs users out due to inactivity, while an absolute timeout logs them out regardless of activity. For an office, a 24-hour absolute timer might make sense, since workers only need to log in when they get to work. As long as users know when their session will expire, the latter is more accessible than the former.
Auto-Save and Progress Preservation
Cookies, localStorage, and sessionStorage are temporary, client-side storage mechanisms that allow web applications to store data for the duration of a single browser session. They are powerful, lightweight tools. Web developers can use them to automatically save users’ progress at frequent intervals, ensuring data is restored upon reauthentication.
This way, even if someone’s session expires by accident, they are not penalized. Once they log back in, they can finish filling out their credit card details or pick up where they left off with an online form.
Testing and WCAG Compliance Considerations
The Web Content Accessibility Guidelines (WCAG) is a collection of internationally accepted internet accessibility standards published by the W3C. It acts as the arbiter of session timeout accessibility. Web developers should pay special attention to Guideline 2.9.2, which outlines best practices for adequate time.
The timeout adjustable mechanism should extend the time limit before the session expires or allow it to be turned off completely. For the former option, a dialog box should appear asking users if they need more time, allowing them to continue with one click. The WC3 notes that exceptions exist.
For example, when a website conducts a live ticket sale, users can only hold tickets in their carts for 10 minutes to give others a chance to purchase limited inventory. Alternatively, session timeouts may be necessary on shared computers. If librarians allowed everyone to stay logged in instead of automatically signing them out overnight, they would risk security issues.
Some processes should not have time limits at all. When browsing social media, reading a news article, or searching for items on an e-commerce site, there is no reason a session should expire within an arbitrary time frame. Meanwhile, in a timed exam, it may be necessary. However, in this case, administrators can extend time limits for students with disabilities.
When web developers make session management accessible, they are not catering to a small group. Pew Research Center data shows 62% of adults with disabilities own a computer. 72% have high-speed home internet. These figures do not differ statistically from the percentage of non-disabled adults who say the same.
Overcoming the Session Timeout Accessibility Barrier
The WCAG provides additional resources that web developers can review to understand session management accessibility better:
- WCAG SC 2.2.1 Timing Adjustable
- WCAG SC 2.2.5 Re-authenticating
- WCAG SC 2.2.6 Timeouts
In addition to following these guidelines, there is a wealth of information from leading educational institutions, authorities on open web technologies, and government agencies. They provide a great starting place for those with intermediate web development knowledge.
Web professionals should consider the following resources to learn more about tools and techniques they can use to make session management more accessible:
- Harvard University’s Session Extension Technique
- DWP Accessibility Manual: How to test session timeouts
- Window: sessionStorage property
Session timeout accessibility is not only an industry best practice but an ethical web development standard.
Those who prioritize it will appeal to a wider audience, improve usability, and attract more website visitors and longer sessions.
The main takeaway is that a website with inaccessible session timeouts sends a clear message that it doesn’t value the user’s time or effort, a problem that creates significant barriers for people with disabilities. However, this is a solvable issue. With a few simple changes, such as providing session extension warnings and auto-saving progress, web developers can build a more considerate, accessible, and respectful internet for everyone.
Further Reading On SmashingMag
- “What Does It Really Mean For A Site To Be Keyboard Navigable”, Eleanor Hecks
- “Designing For Neurodiversity”, Vitaly Friedman
- “What I Wish Someone Told Me When I Was Getting Into ARIA”, Eric Bailey
- “A Designer’s Accessibility Advocacy Toolkit”, Yichan Wang