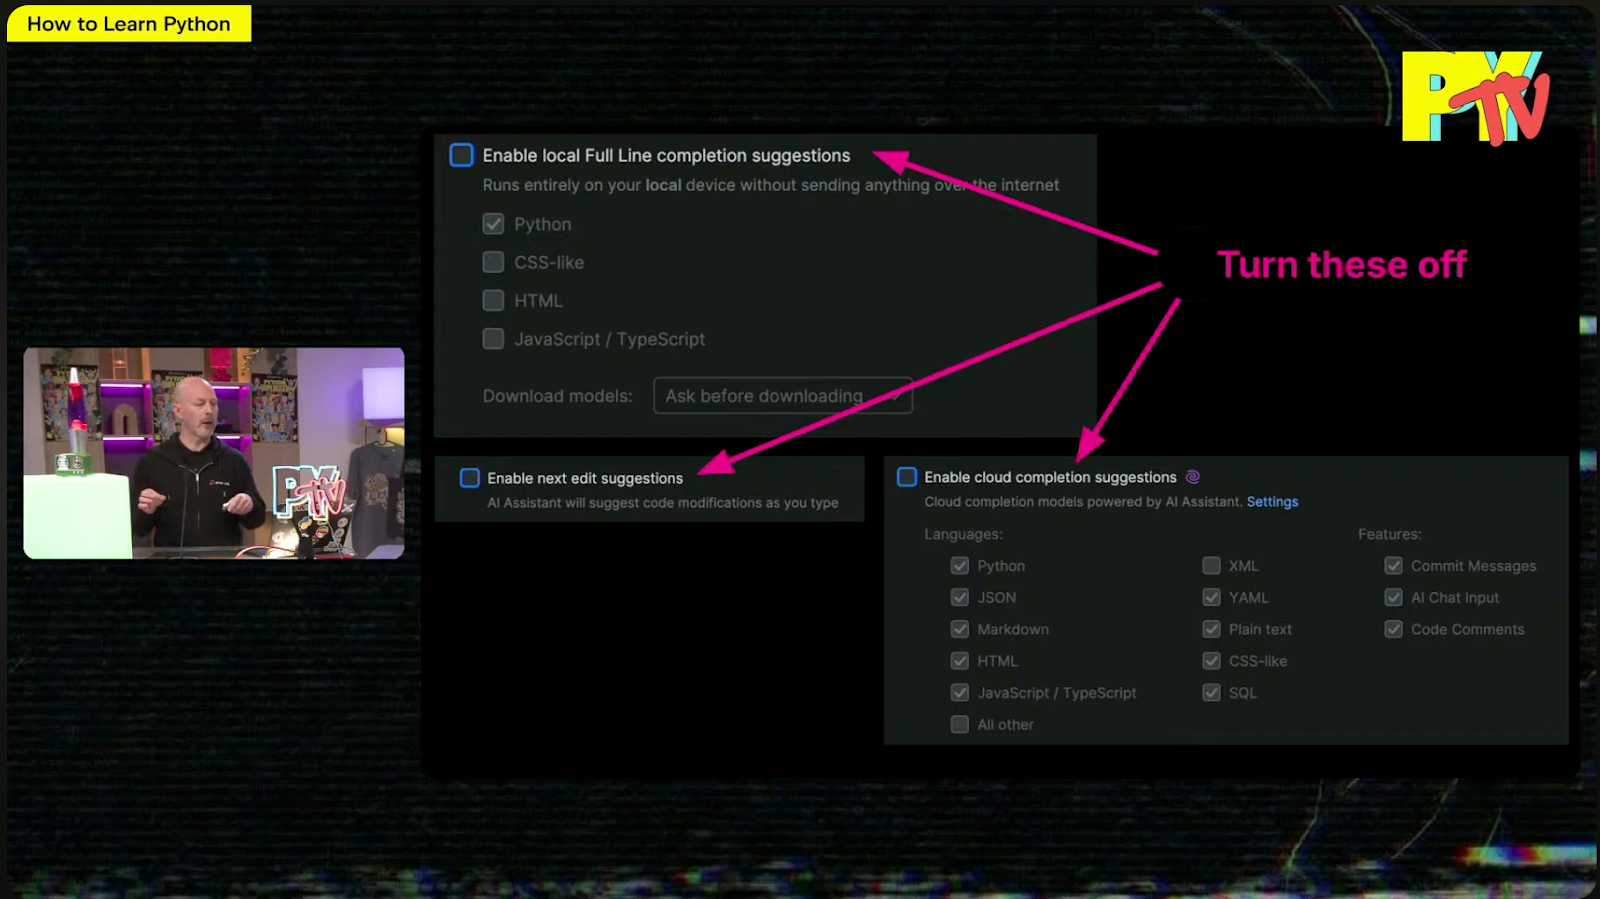
While listening to Mark Smith’s inspirational talk for Python Unplugged on PyTV about How to Learn Python, what caught my attention was that Mark suggested turning off some of PyCharm’s AI features to help you learn Python more effectively.
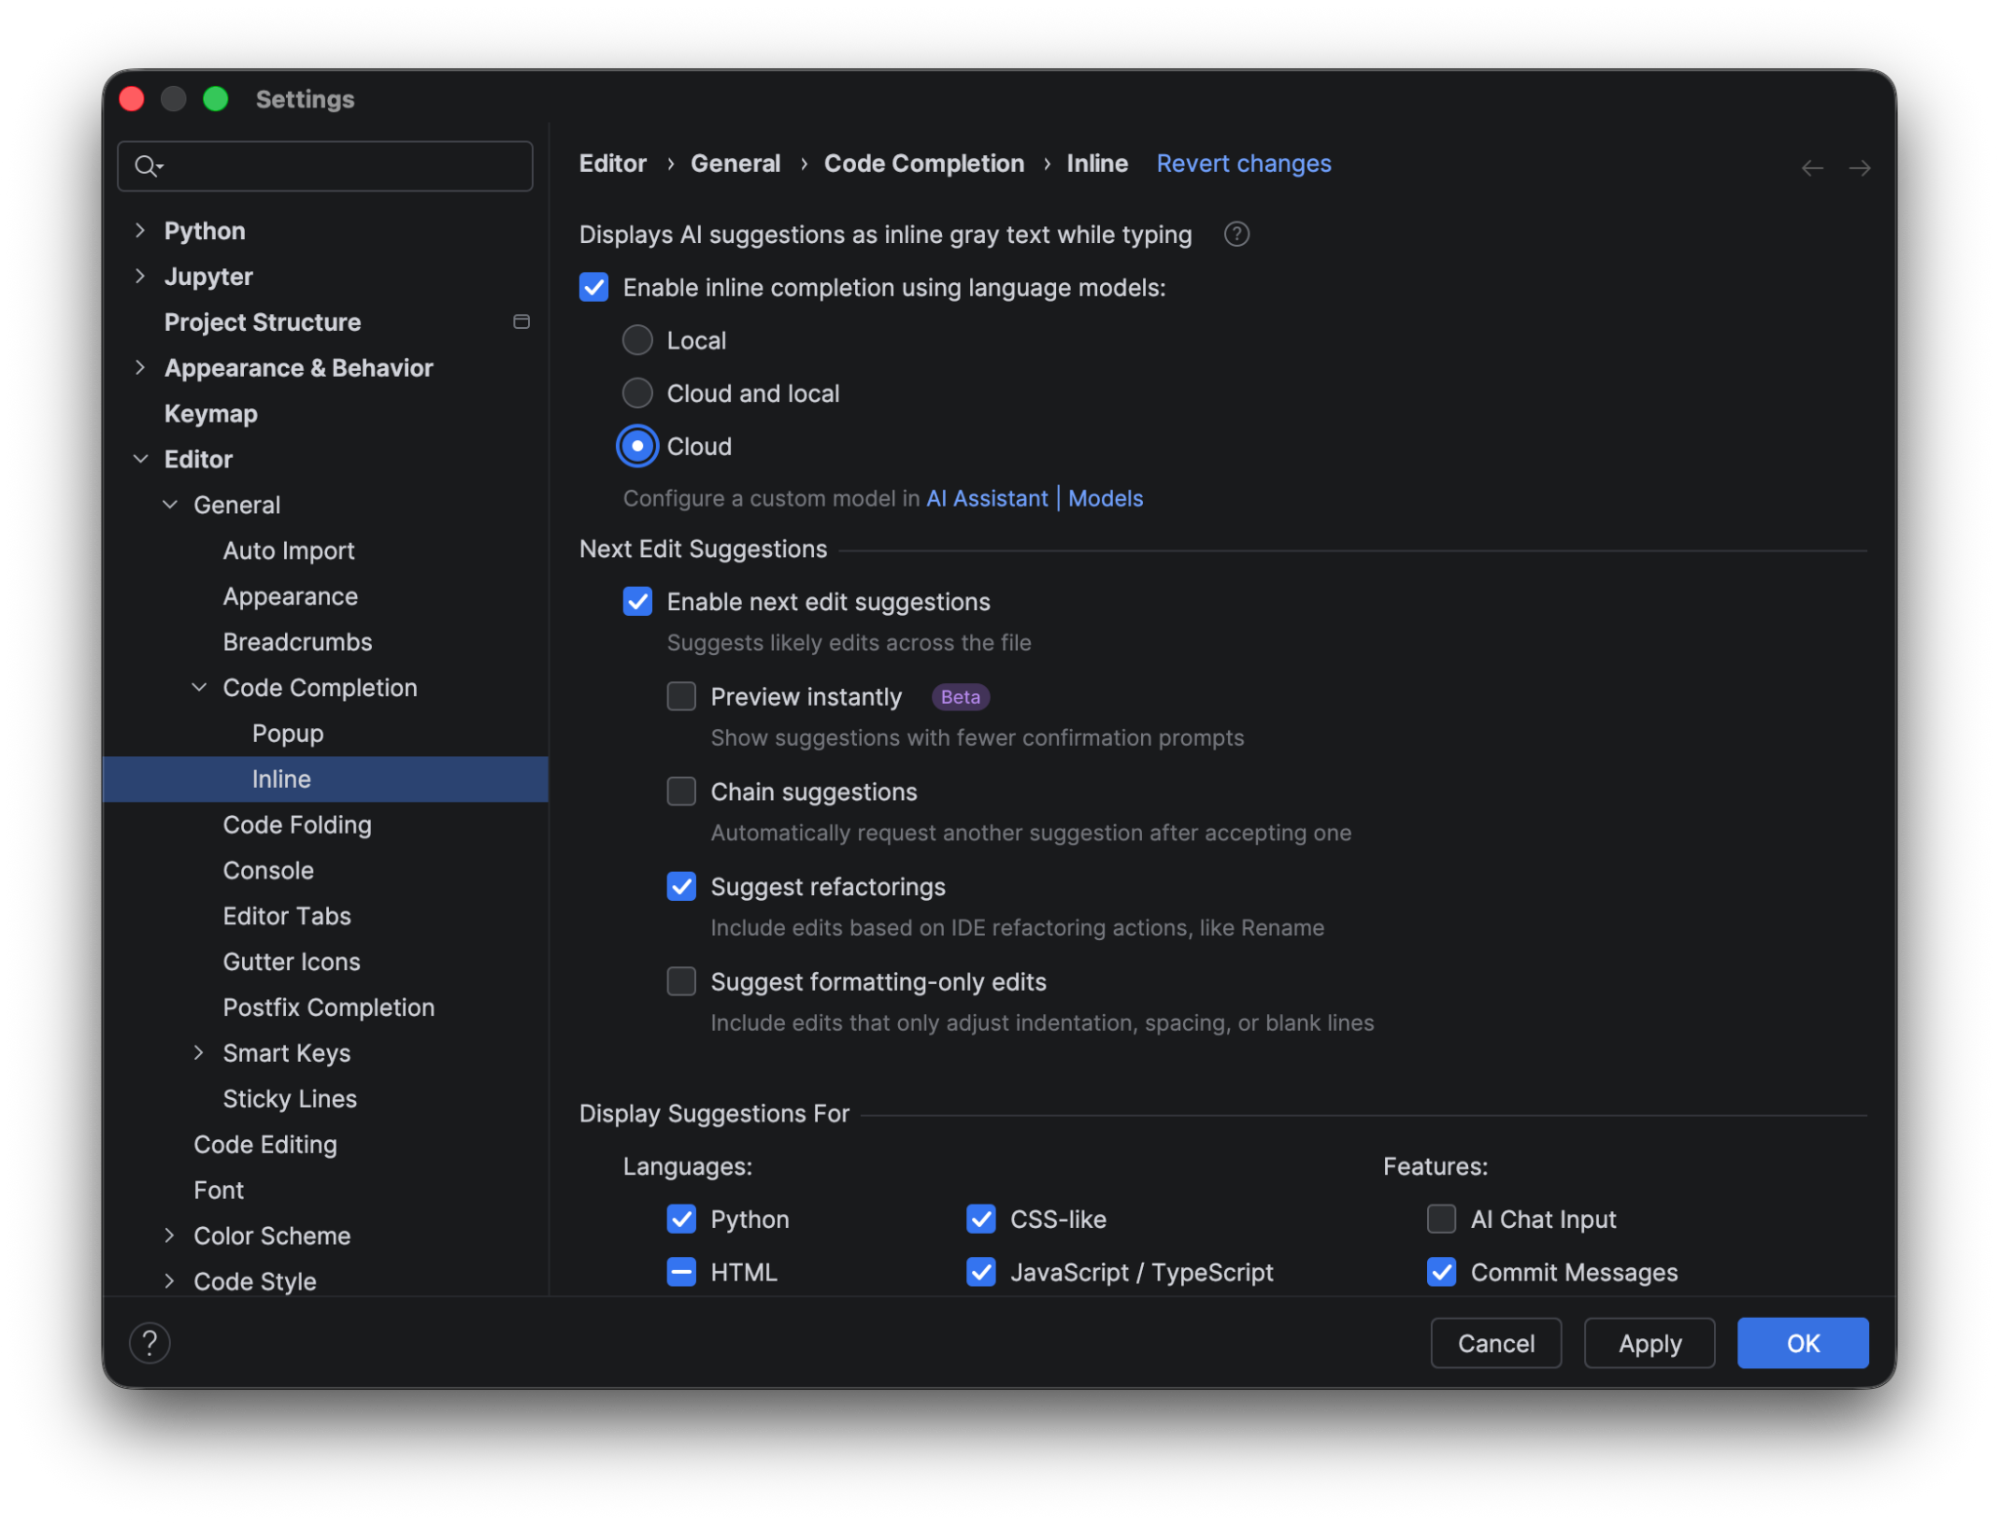
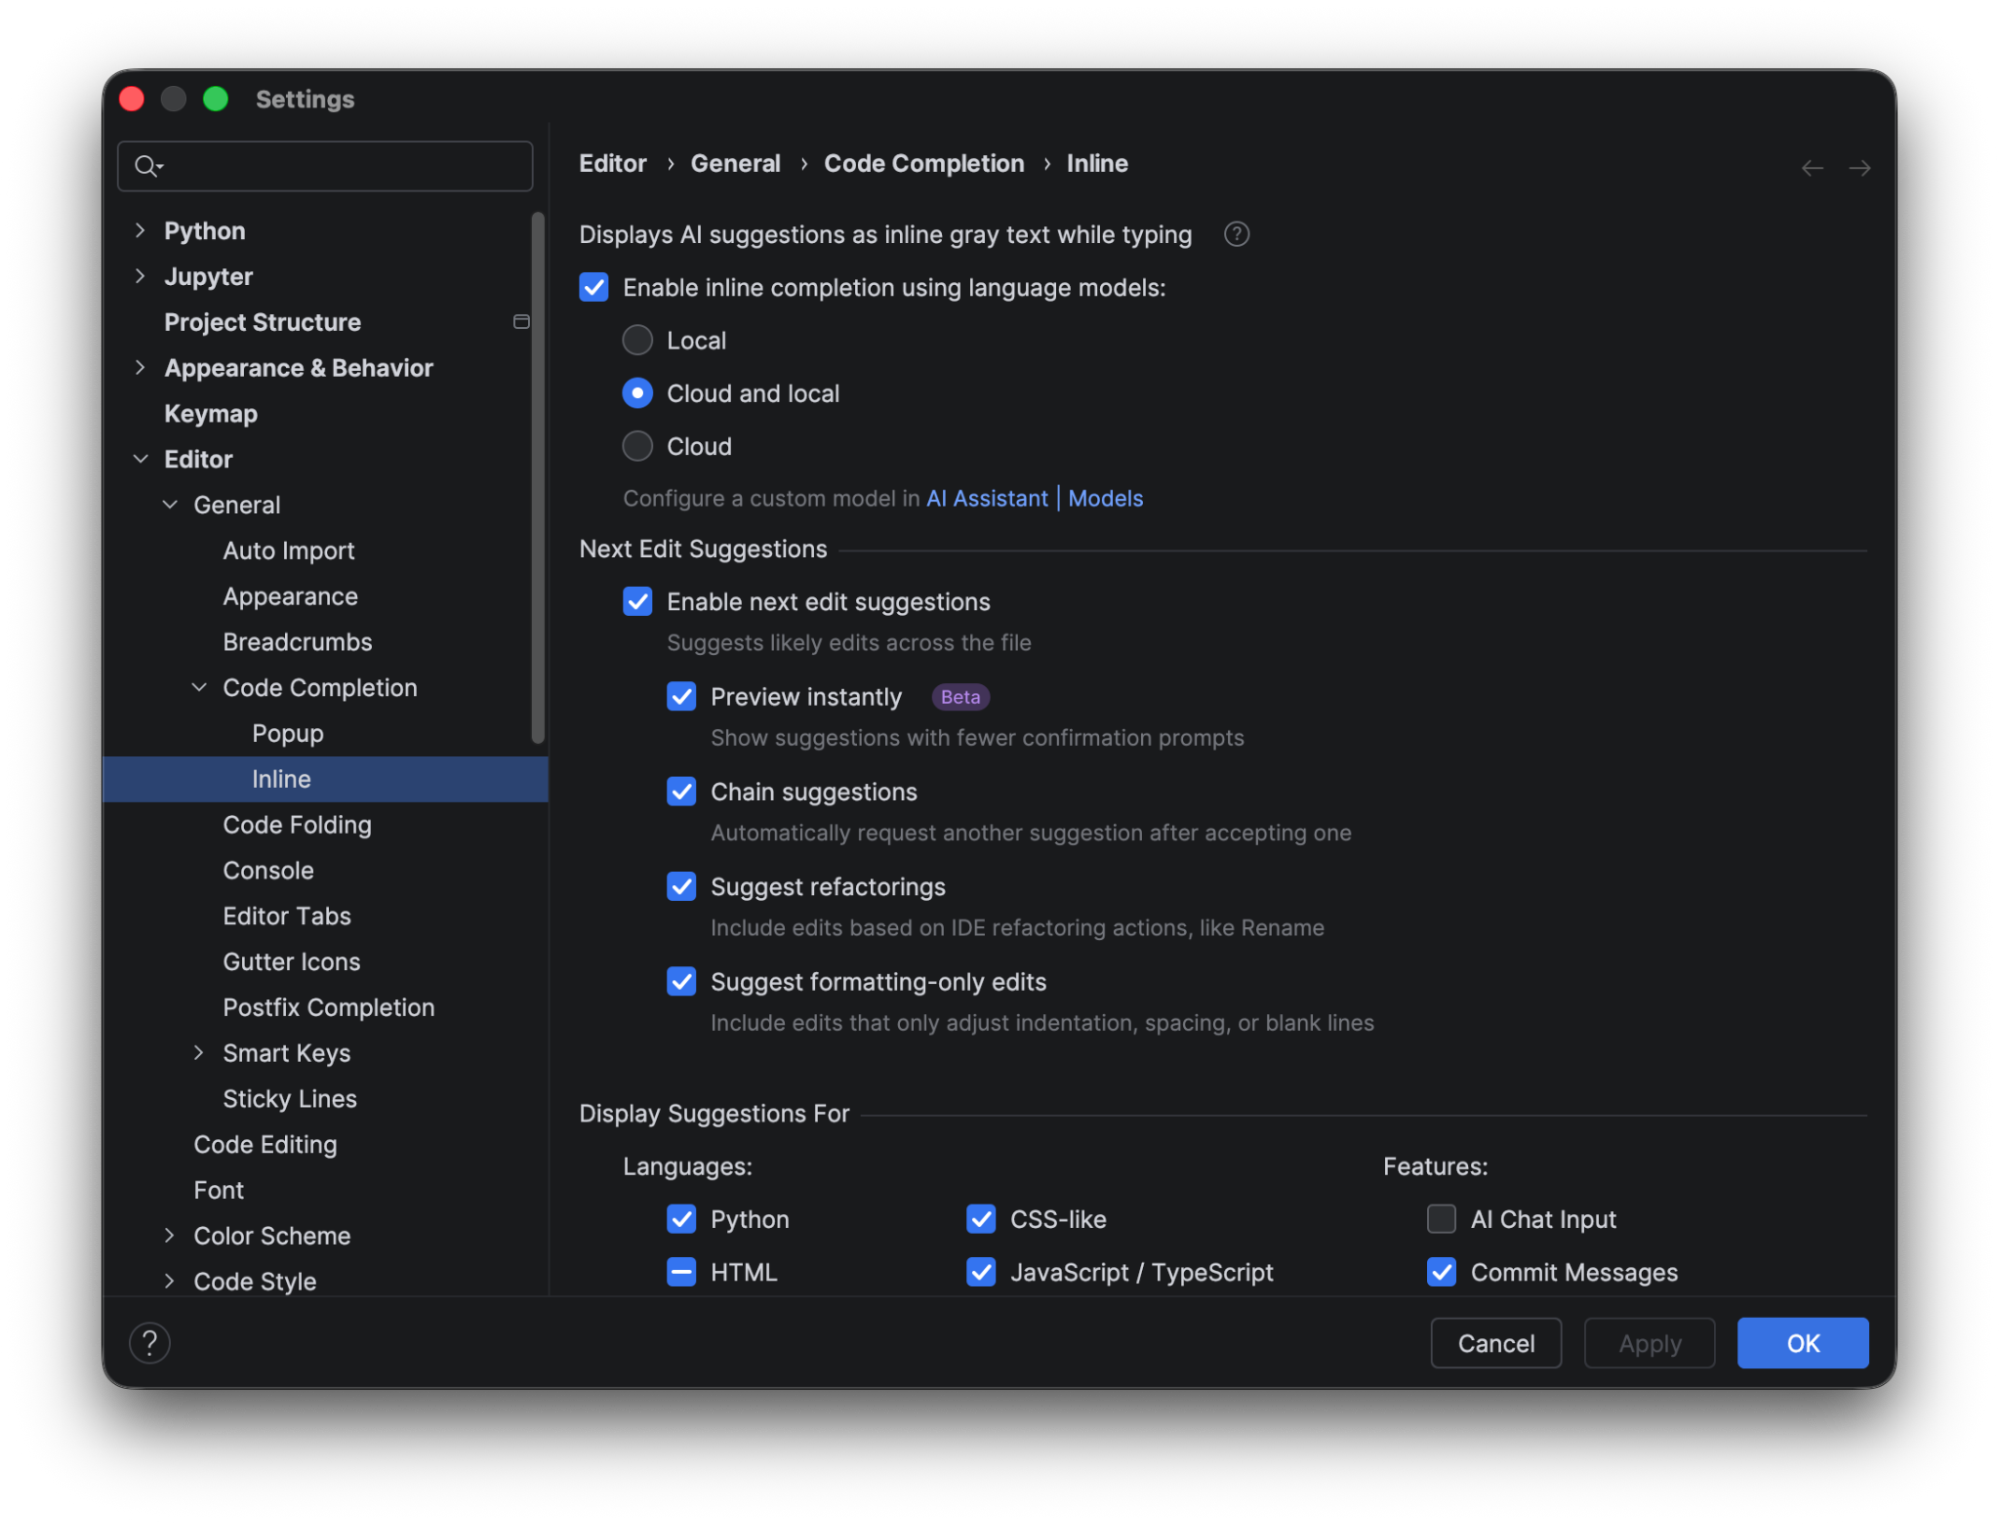
As a PyCharm user myself, I’ve found the AI-powered features beneficial in my day-to-day work; however, I never considered that I could turn certain features on or off to customize my experience. This can be done from the settings menu under Editor | General | Code Completion | Inline.
While we are at it, let’s have a look at these features and investigate in more detail why they are great for professional developers but may not be ideal for learners.
Local full line code completion suggestions
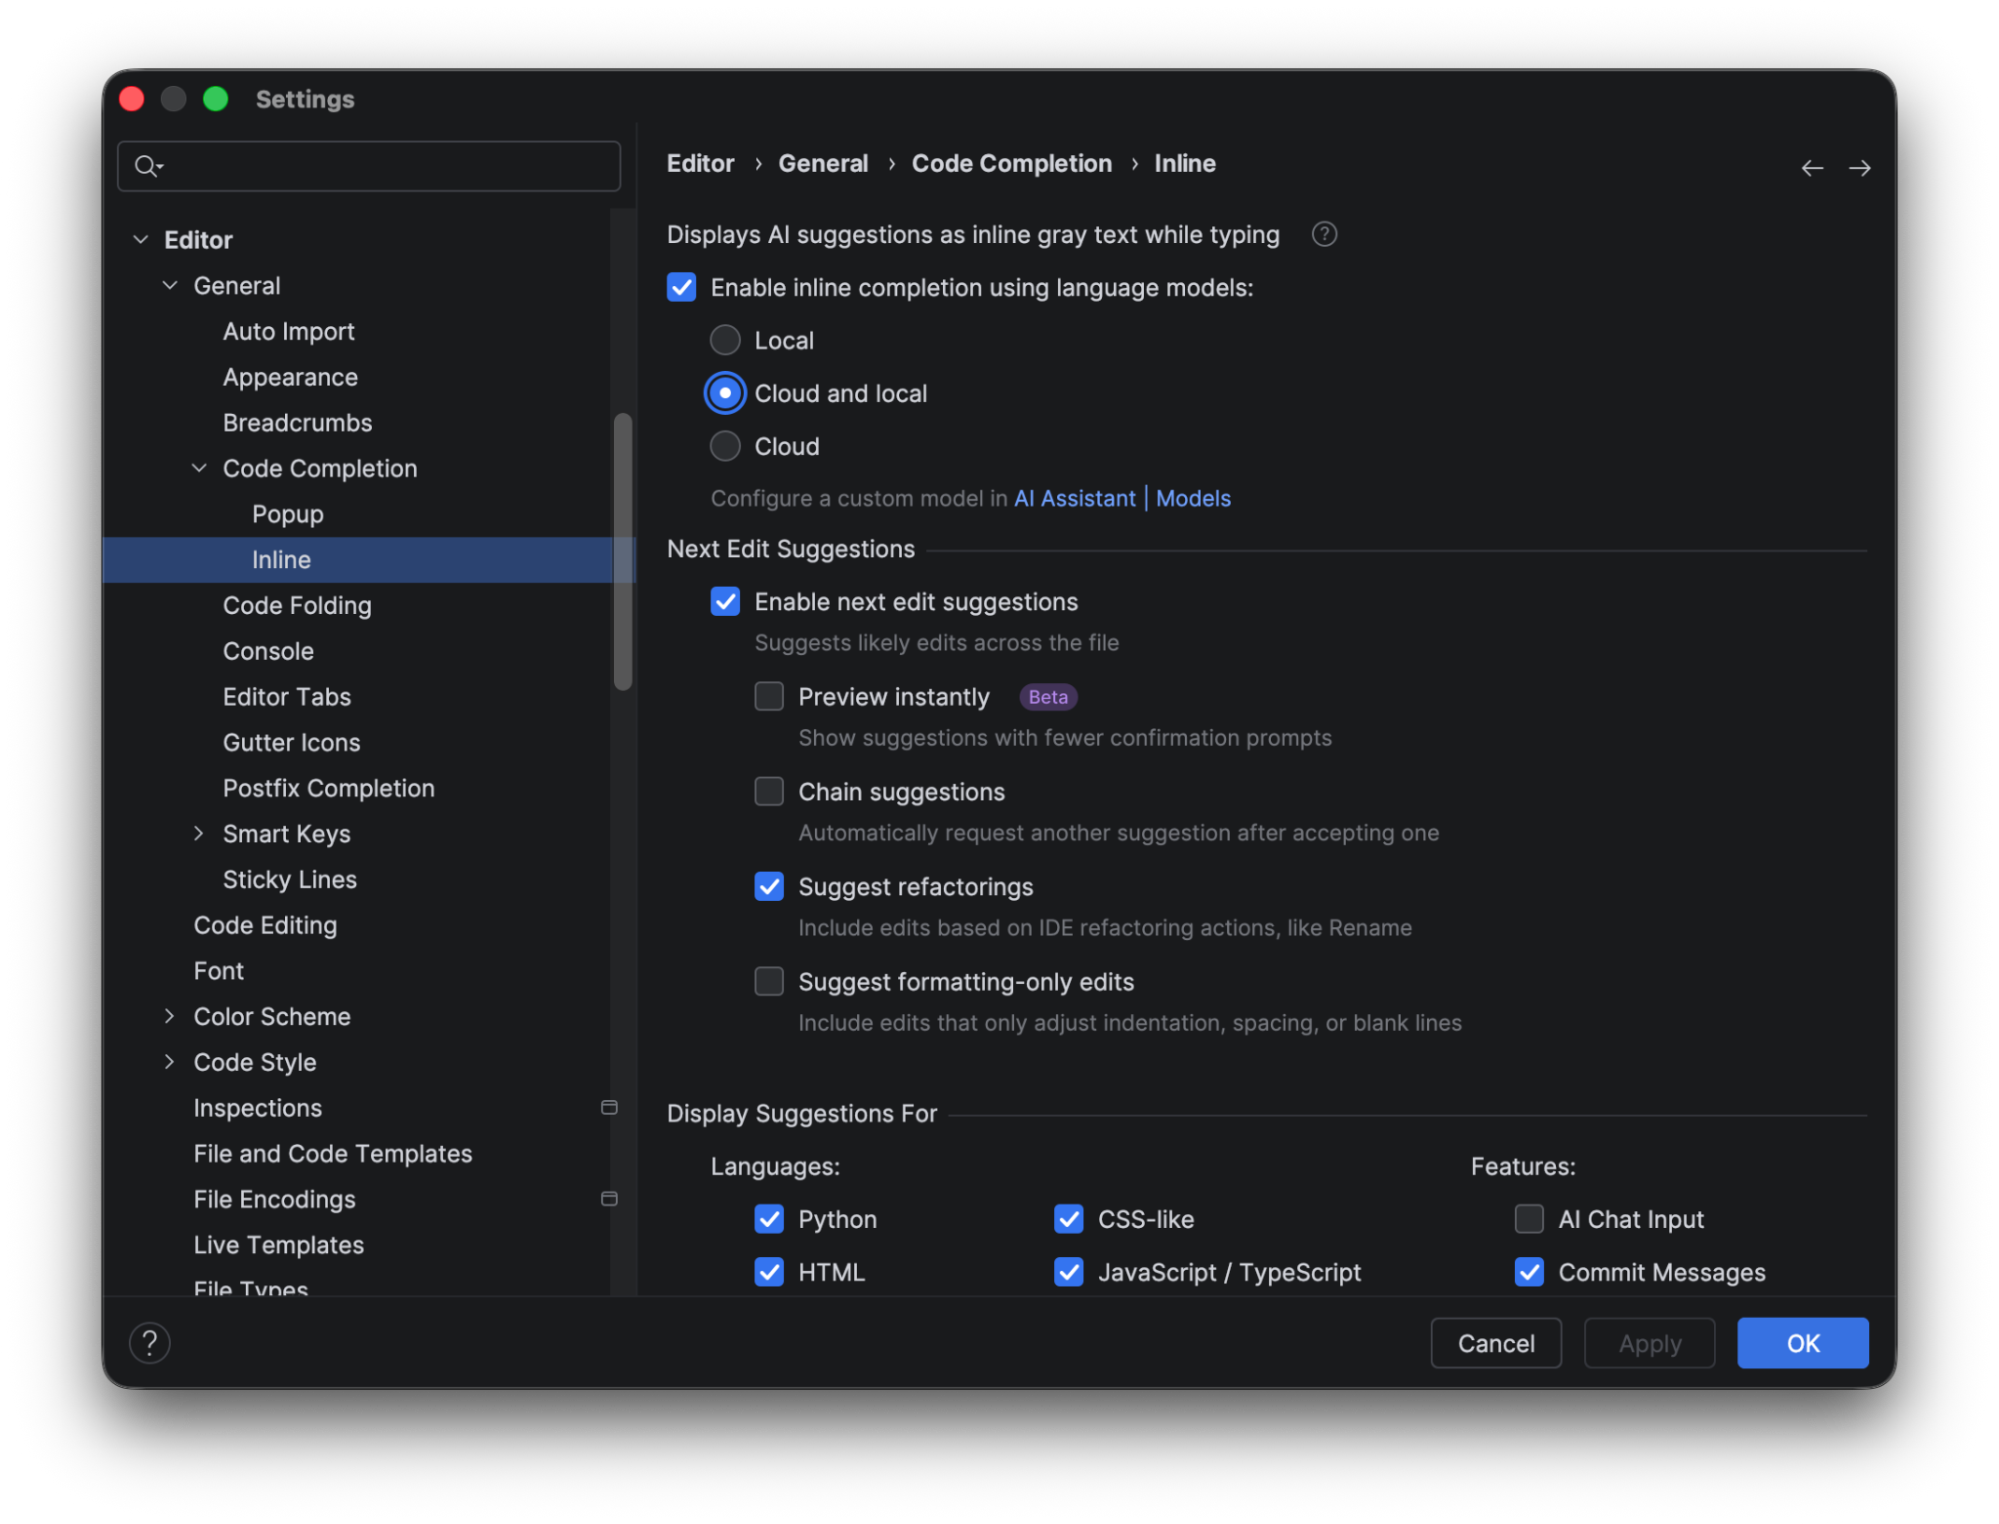
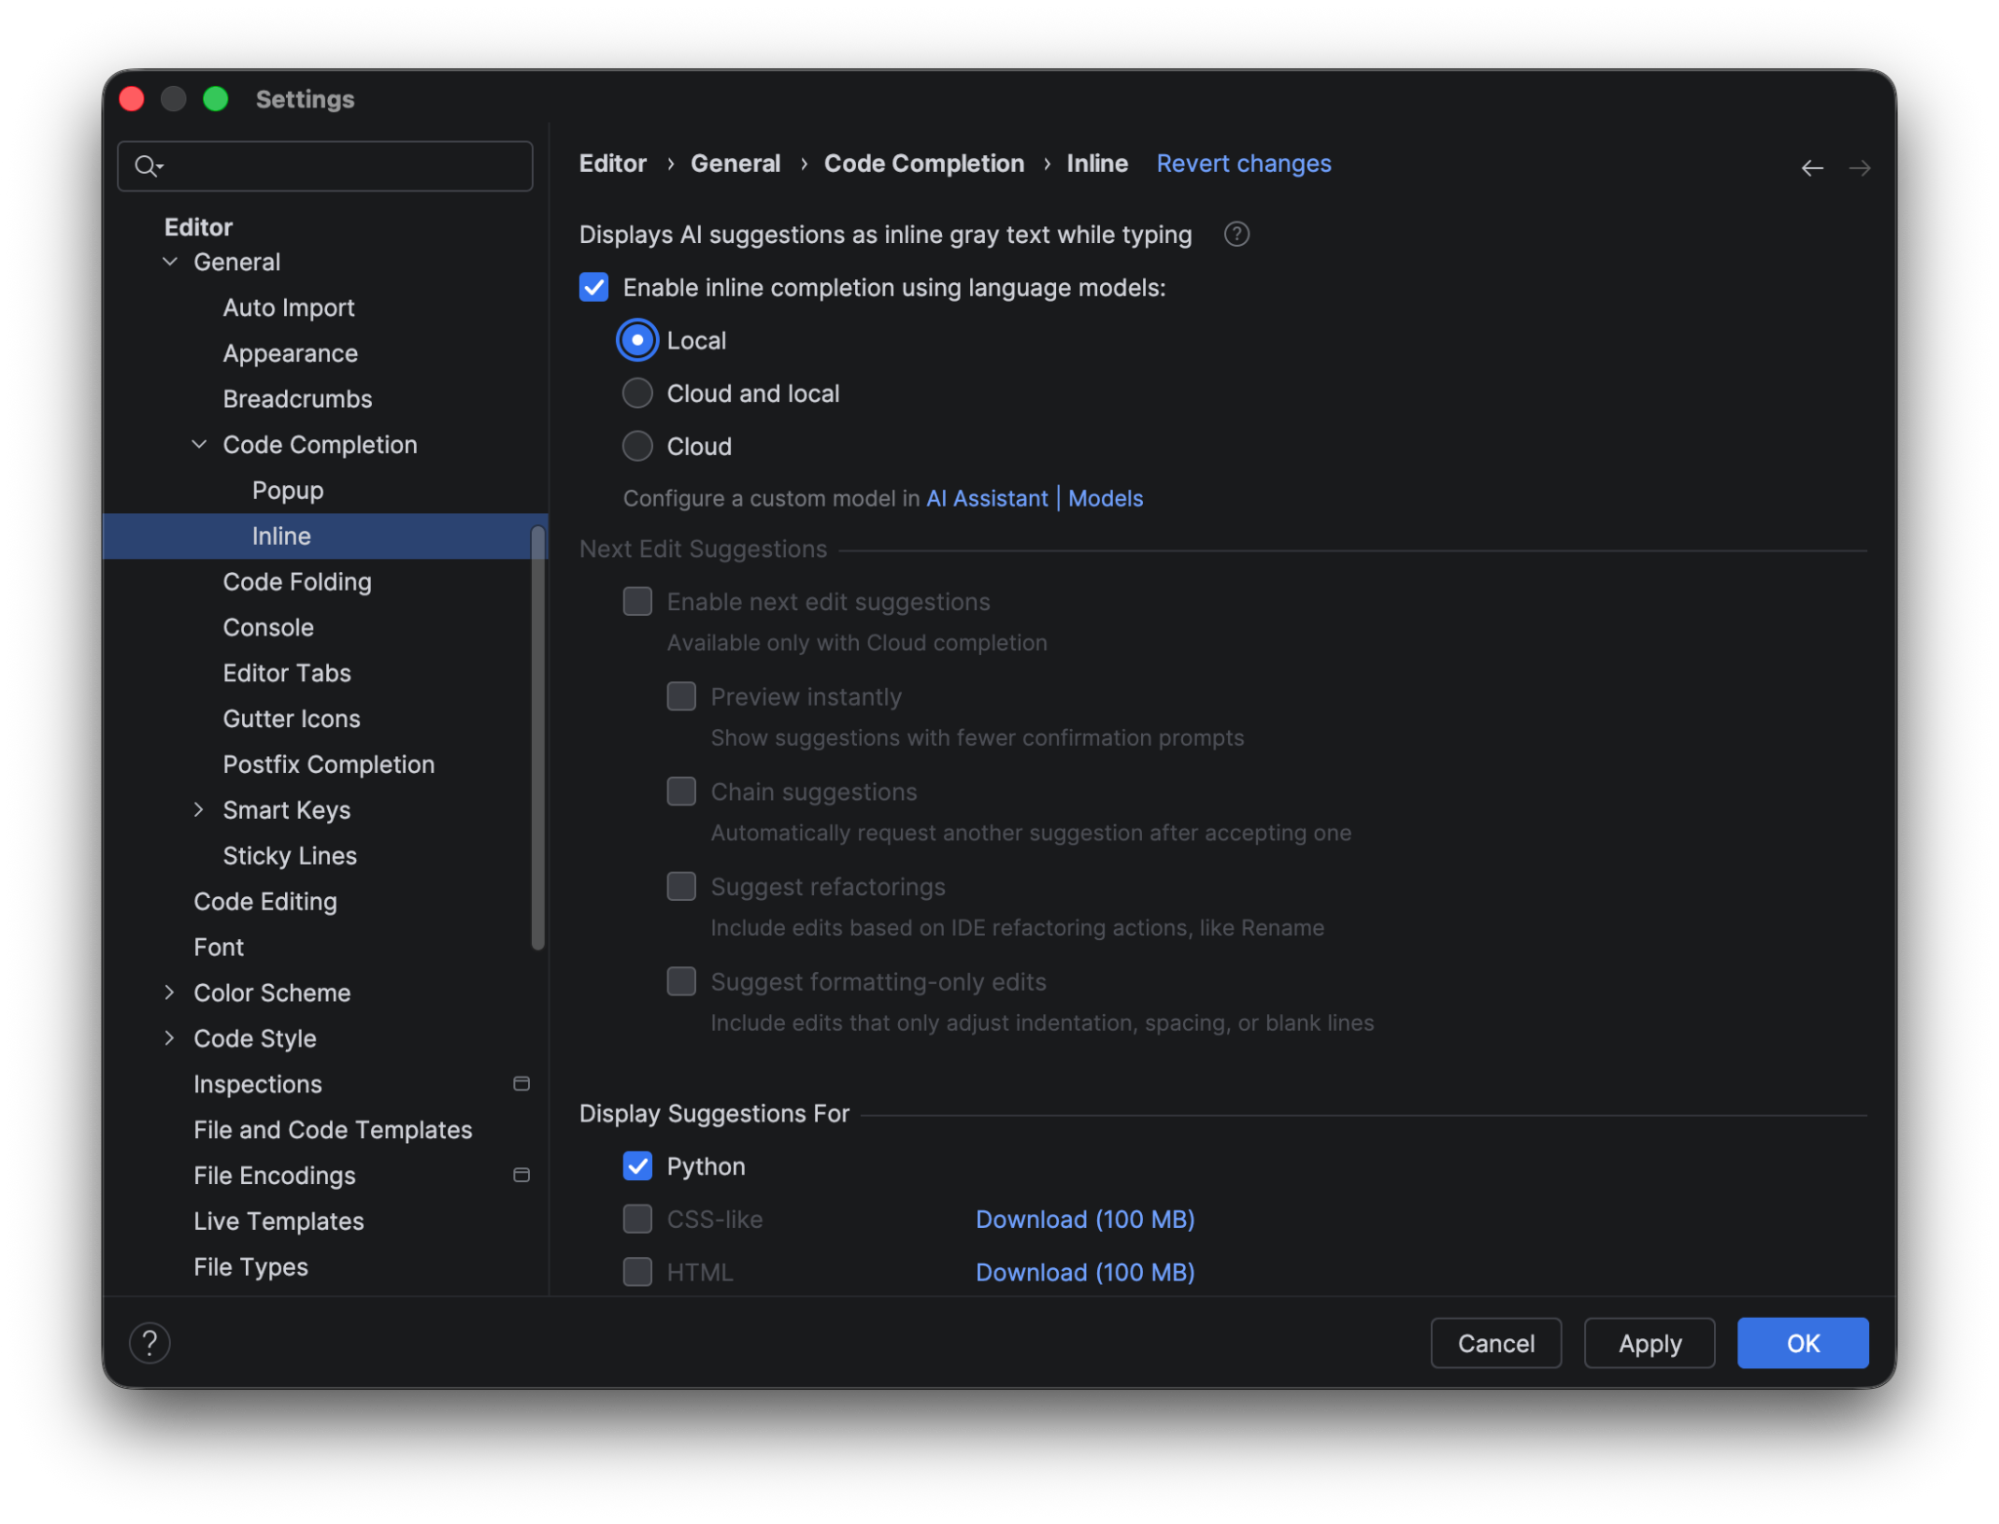
JetBrains AI credits are not consumed when you use local line completion. The completion prediction is performed using a built-in local deep learning model. To use this feature, make sure the box for Enable inline completion using language models is checked, and choose either Local or Cloud and local in the options. To show the complete results using the local model alone, we will look at the predictions when only Local is selected.
When it’s selected, you see that the only code completion available out of the box in PyCharm is for Python. To make suggestions available for CSS or HTML, you need to download additional models.
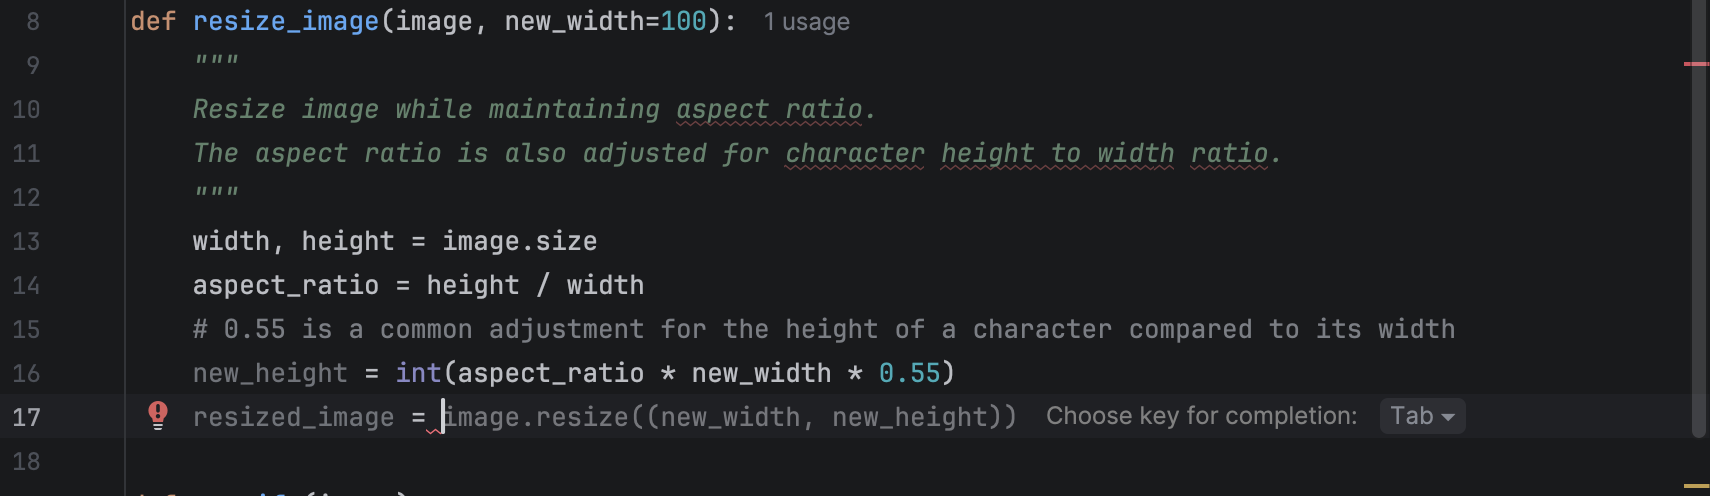
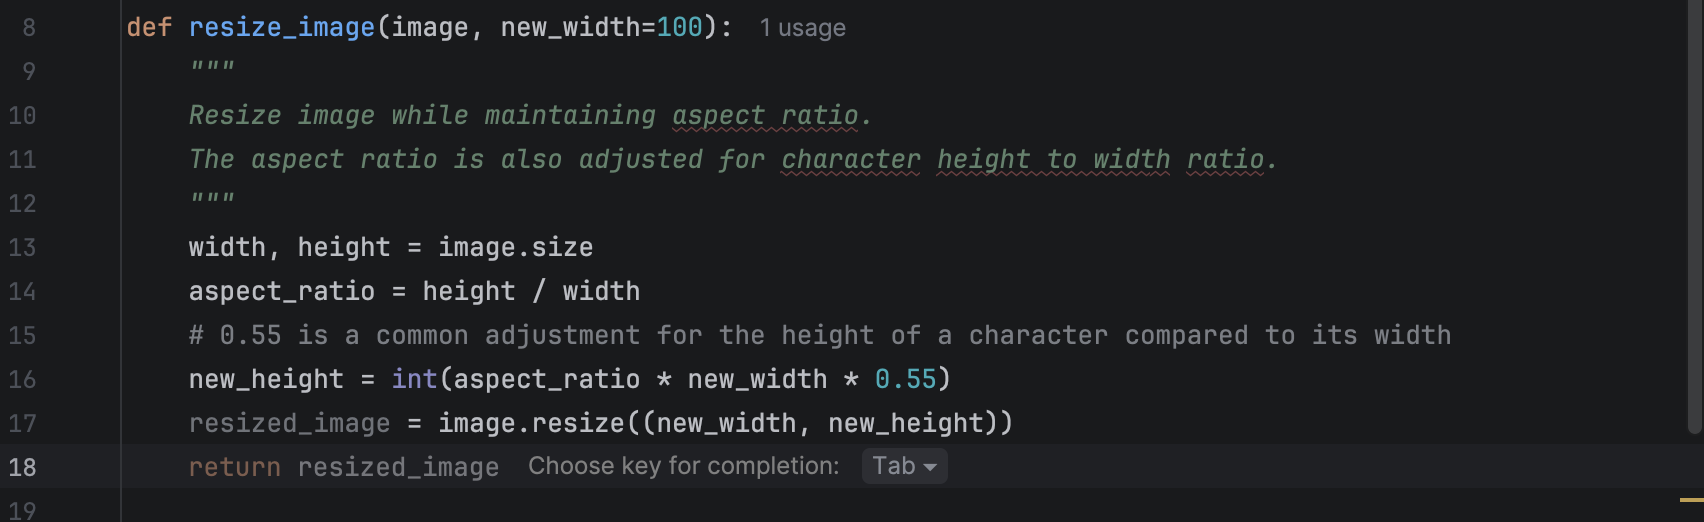
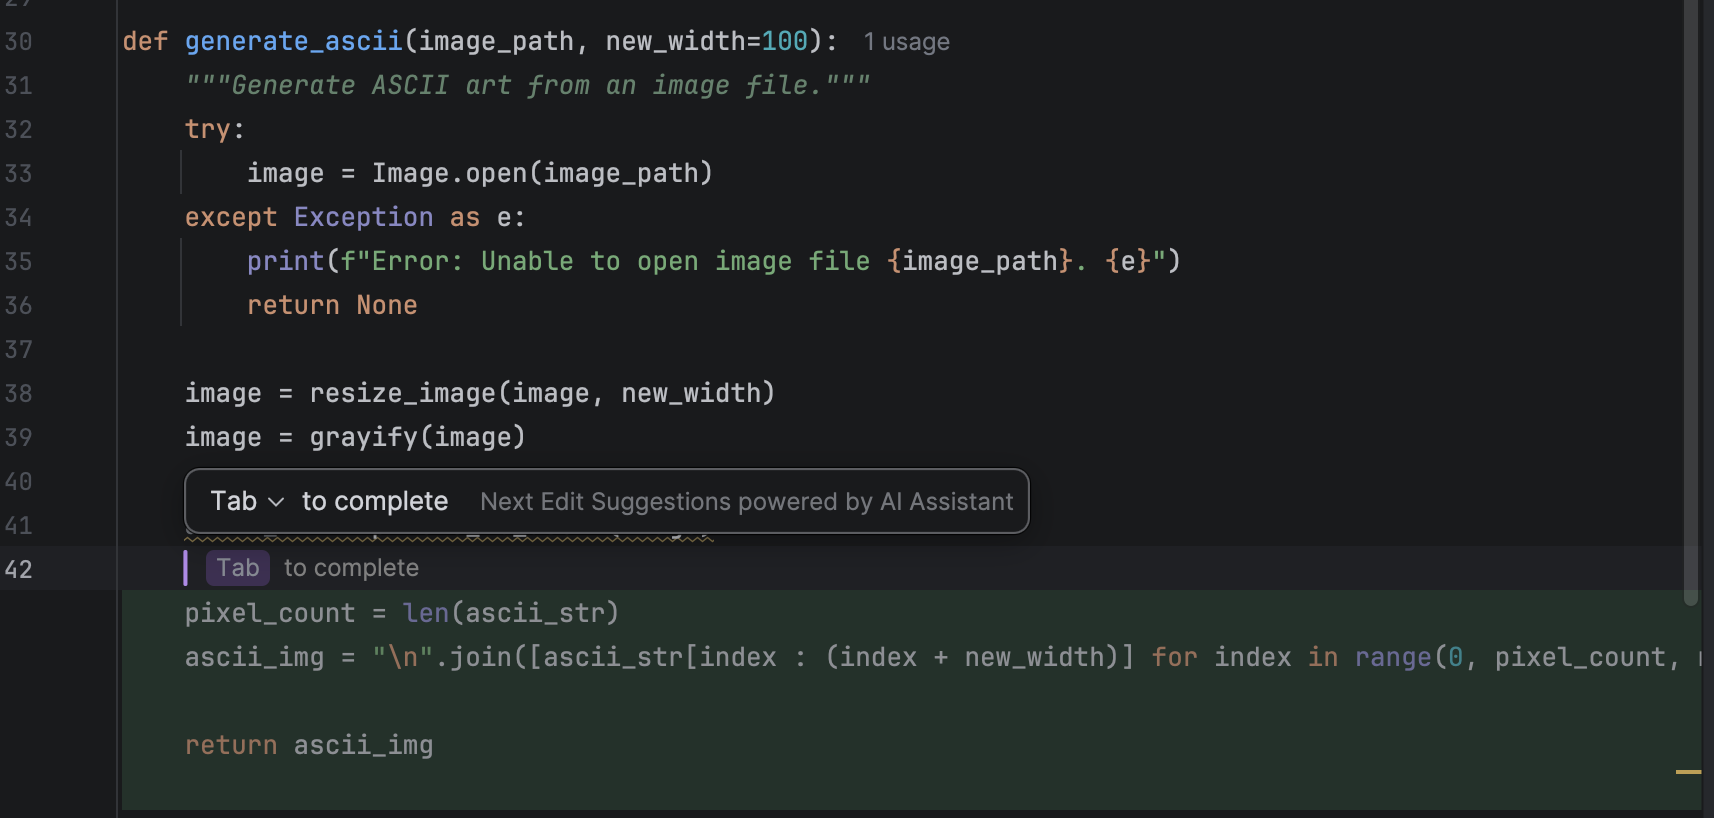
When you are writing code, you will see suggestions pop up in grey with a hint for you to use Tab to complete the line.
After completing that line, you can press Enter to go to the next one, where there may be a new suggestion that you can again use Tab to complete. As you see, this can be very convenient for developers in their daily coding, as it saves time that would otherwise be spent typing obvious lines of code that follow the flow naturally.
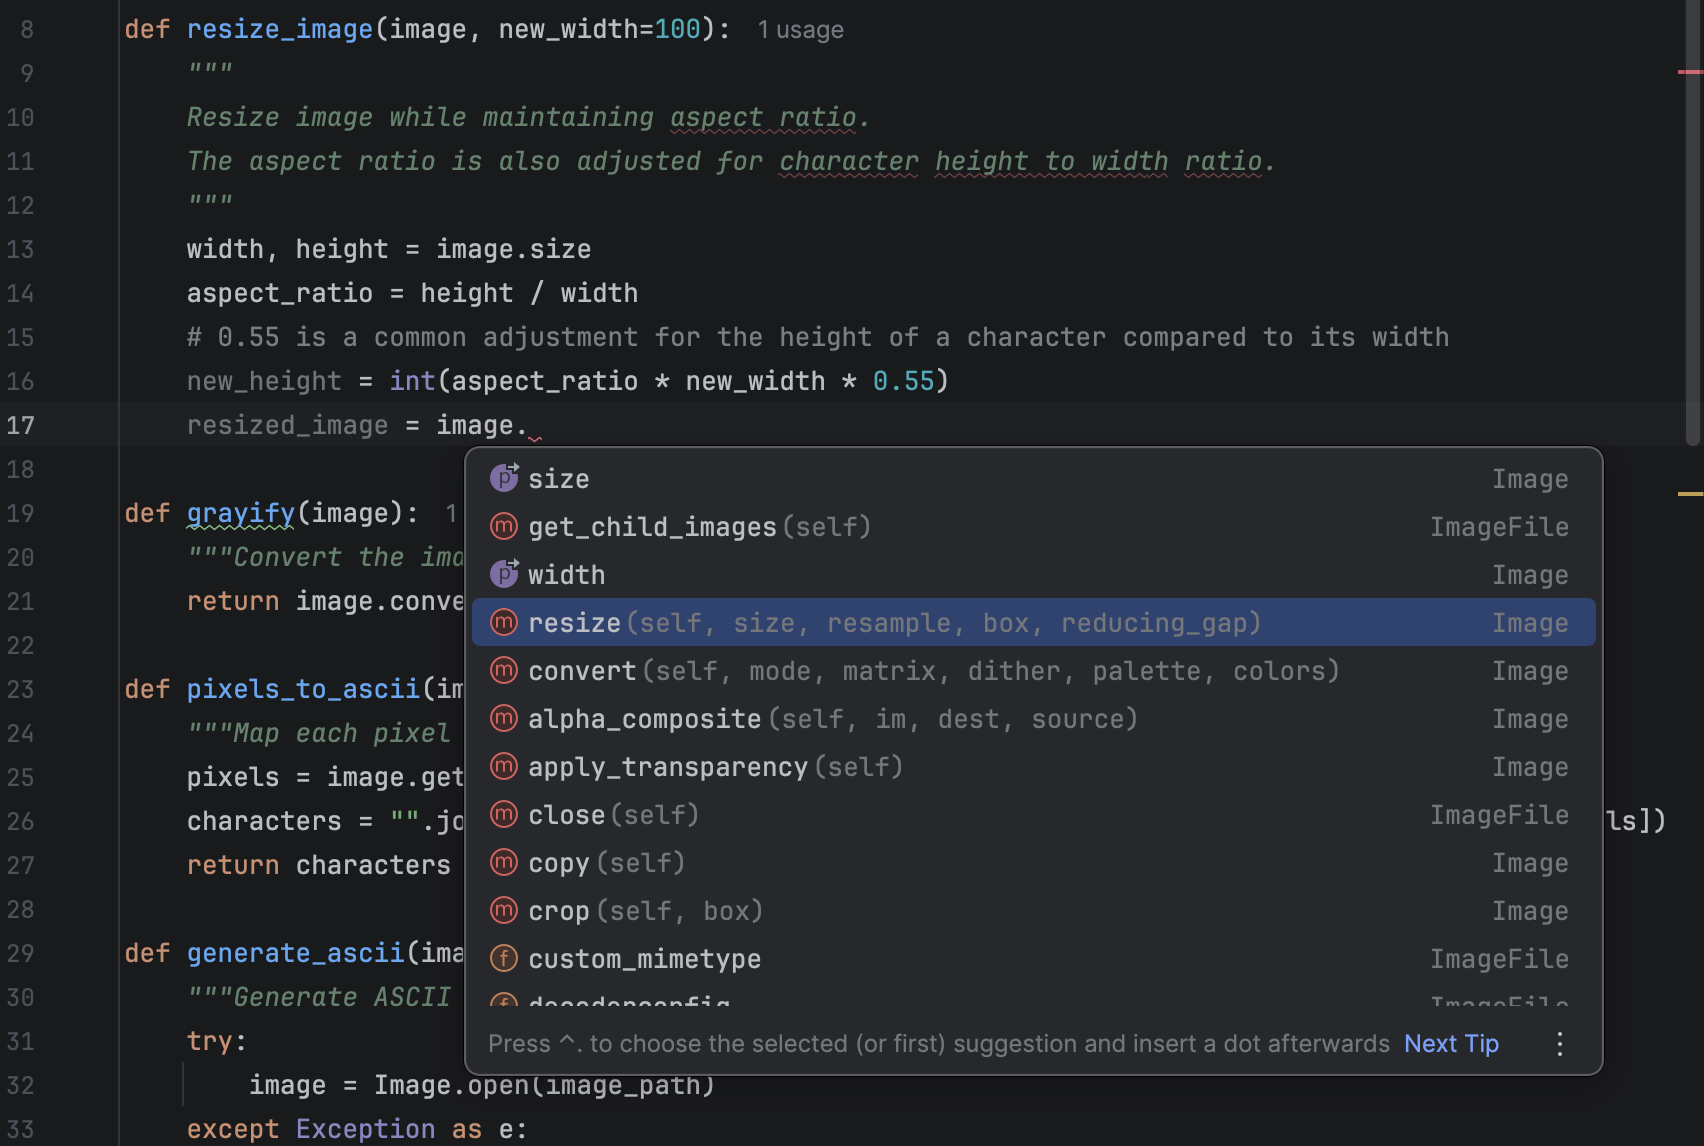
However, for beginners, mindlessly hitting Tab and letting the model complete lines may discourage them from learning how to use the functions correctly. An alternative is to use the hint provided by PyCharm to help you choose an appropriate method from the available list, determine which parameters are needed, check the documentation if necessary, and write the code yourself. Here is what the hint looks like when code completion is turned off:
Cloud-based completion suggestions
Let’s have a look at cloud-based completion in contrast to local completion. When using cloud-based completion, next-edit suggestions are also available (which we will look at in more detail in the next section).
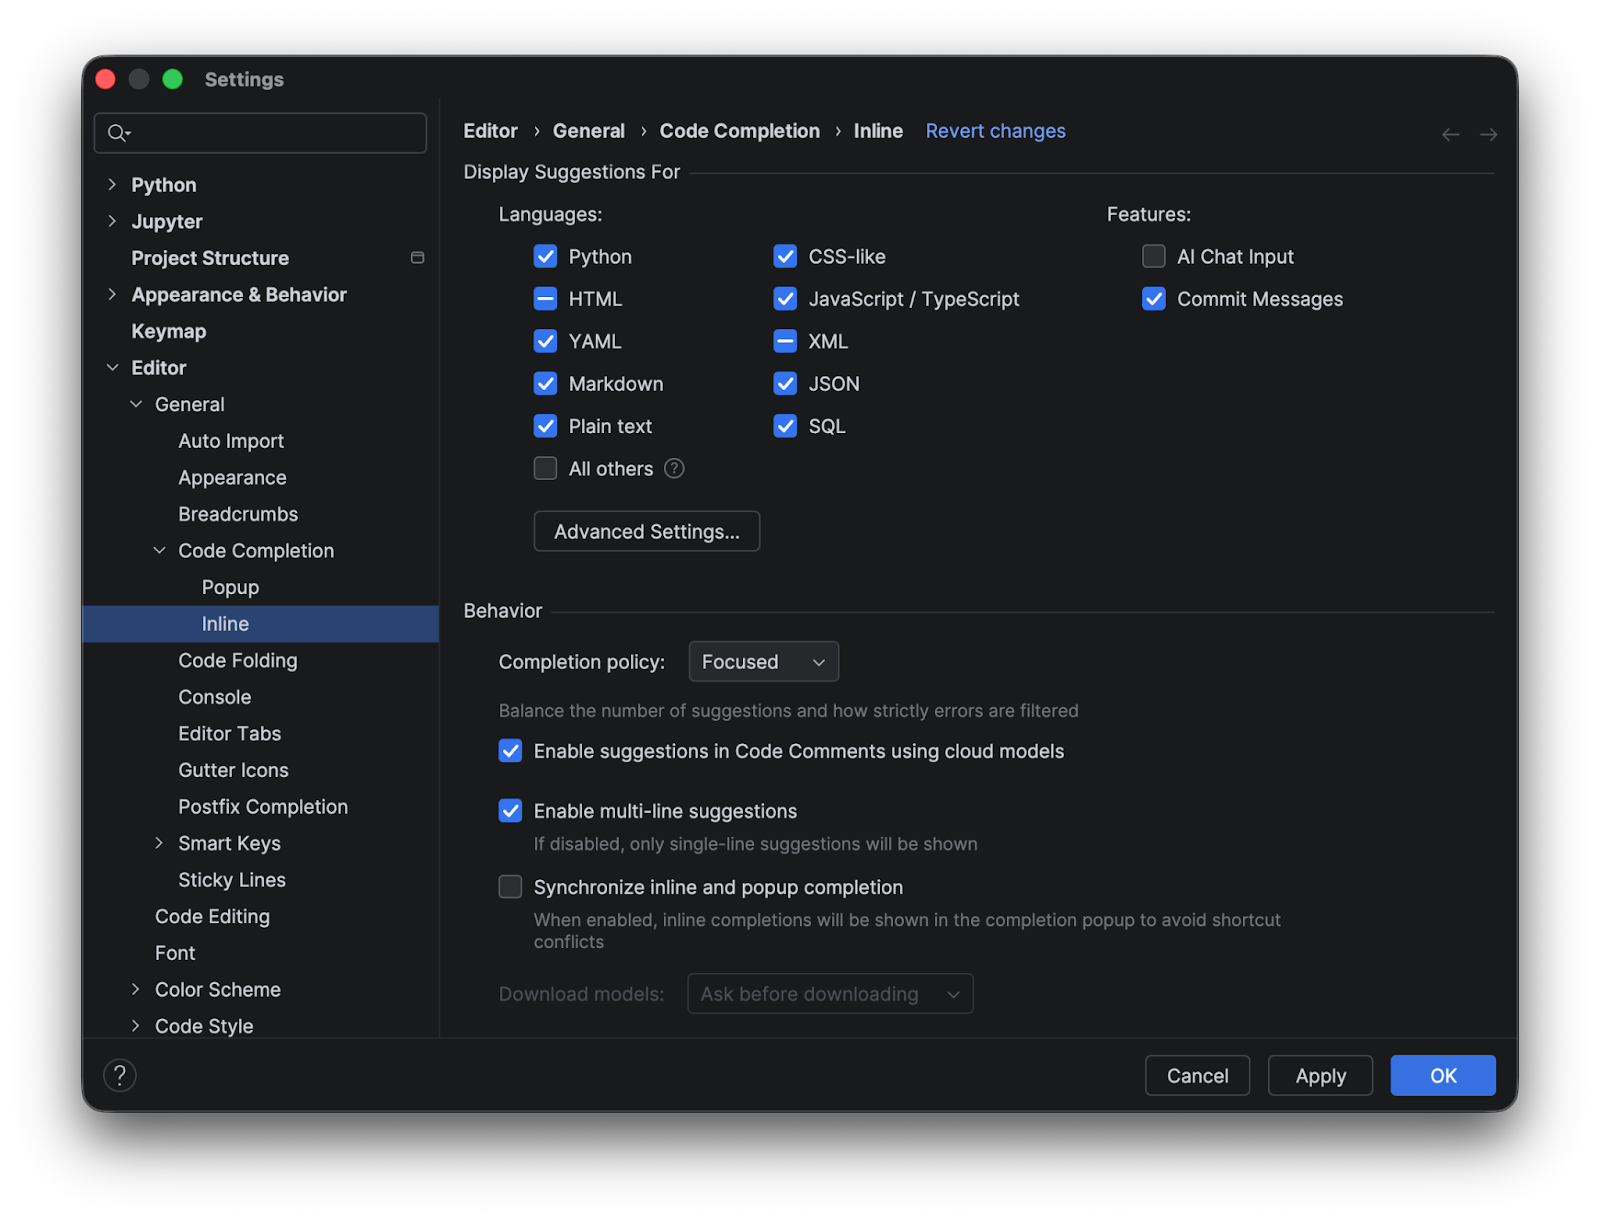
Cloud-based completion comes with support for multiple languages by default, and you can switch it on or off for each language individually.
Cloud-based completion provides more functionality than local model completion, but you need a JetBrains AI subscription to use it.
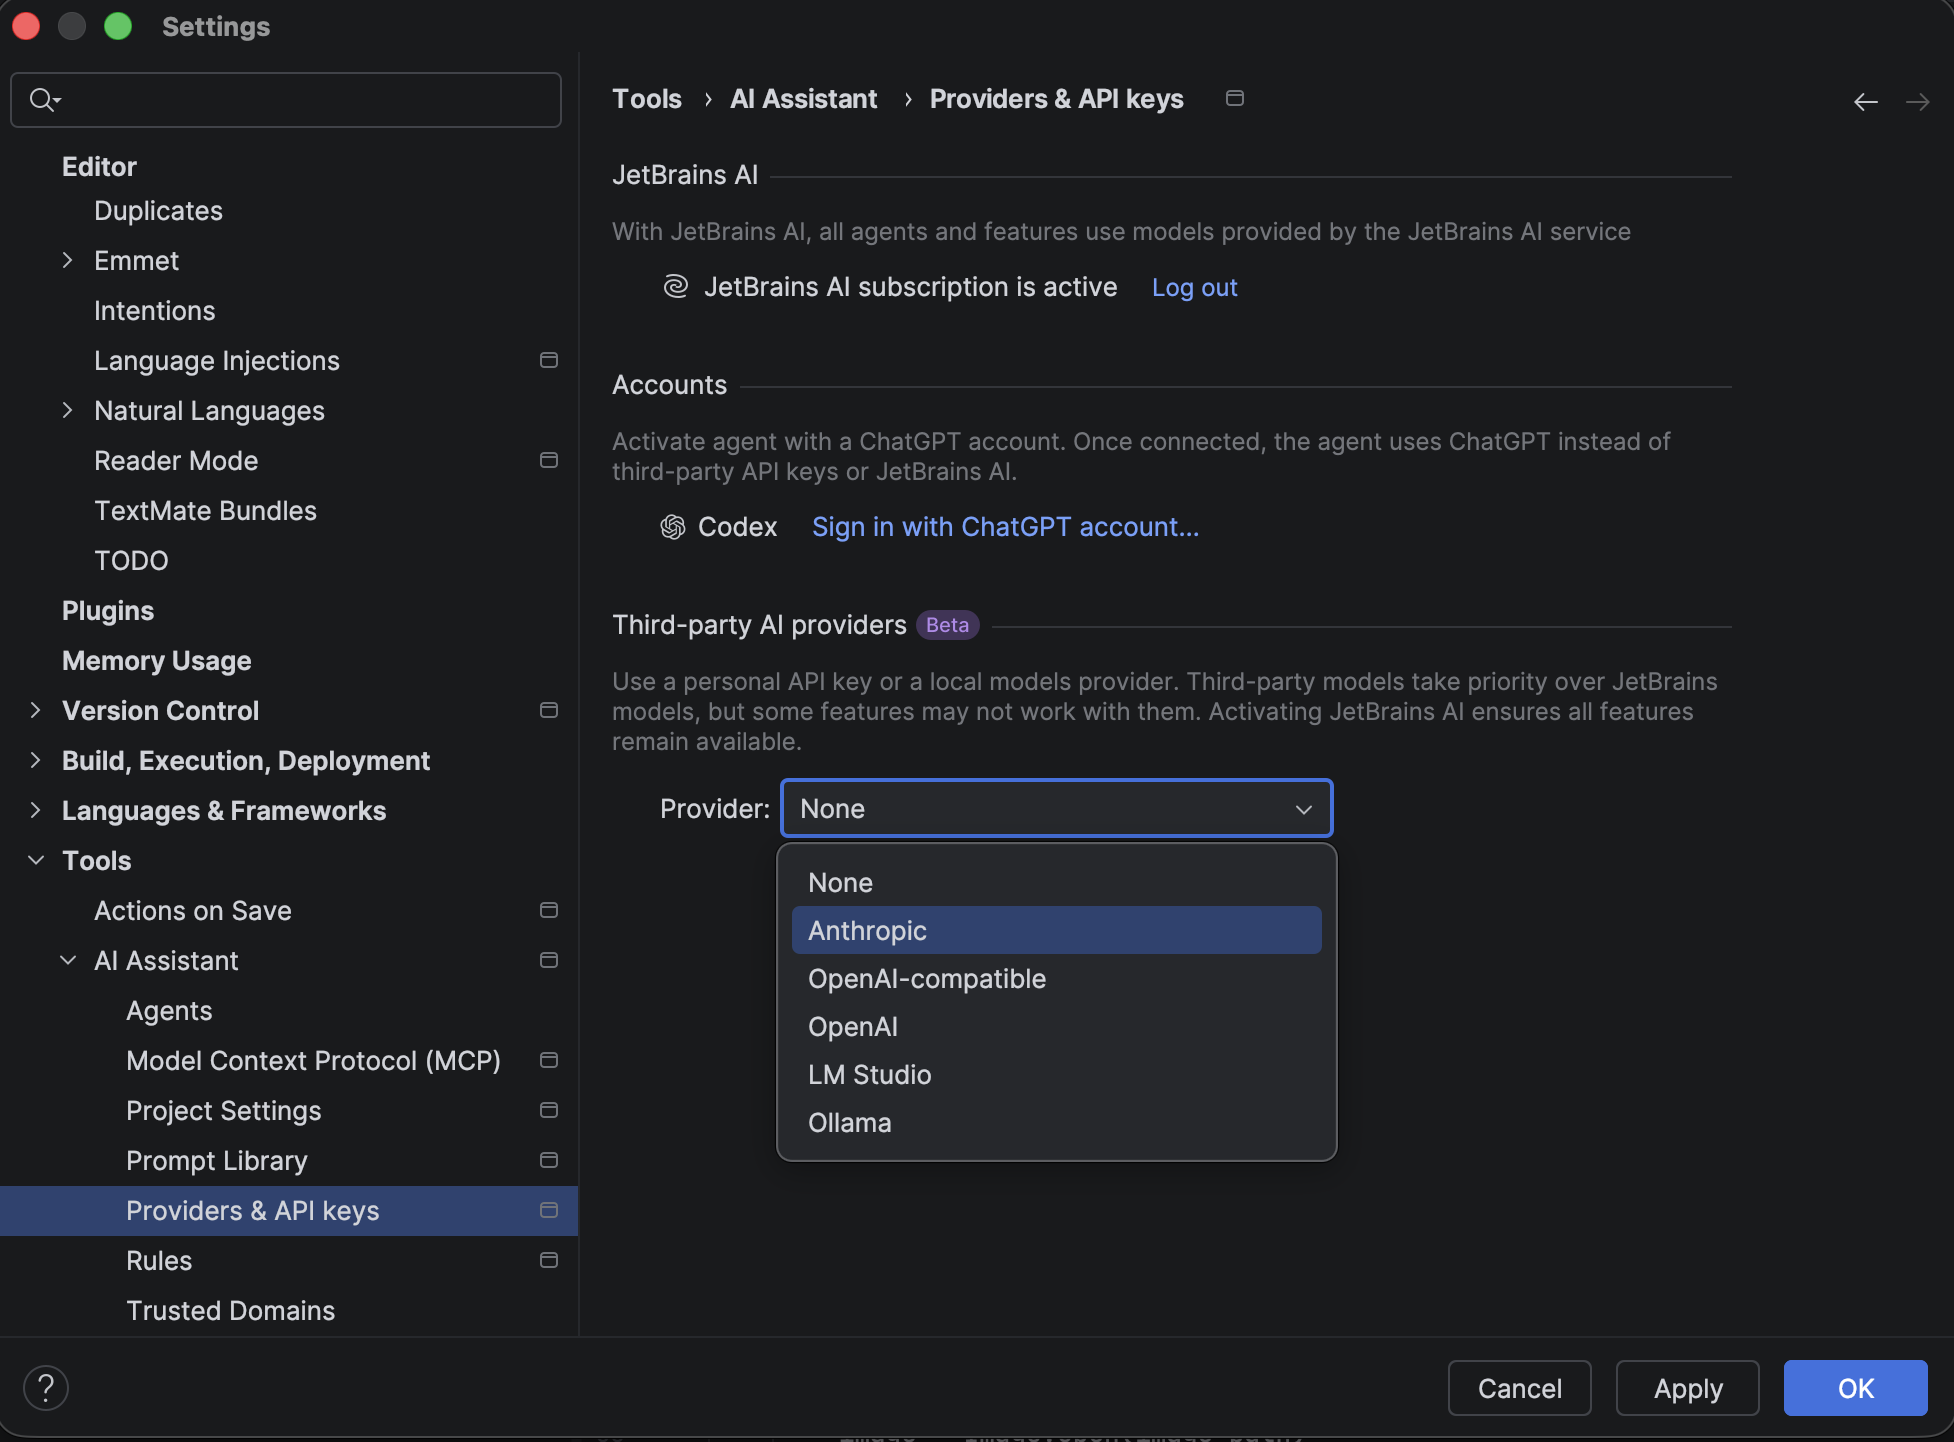
You may also connect to a third-party AI provider for your cloud-based completion. Since this support is still in Beta in PyCharm 2026.1, it is highly recommended to keep your JetBrains AI subscription active as a backup to ensure all features are available.
After switching to cloud-based completion, one of the differences I noticed was that it is better at multiple-line completion, which can be more convenient. However, I have also encountered situations where the completion provided too much for me, and I had to jump in to make my own modifications after accepting the suggestions.
For learners of Python, again, you may want to disable this functionality or have to audit all the suggestions in detail yourself. In addition to the danger of relying too heavily on code completion, which removes opportunities to learn, cloud code completion poses another risk for learners. Because larger suggestions require active review from the developer, learners may not be equipped to fully audit the wholesale suggestions they are accepting. Disabling this feature for learners not only encourages learning, but it can also help prevent mistakes.
Next edit suggestions
In addition to cloud-based completion, JetBrains AI Pro, Ultimate, and Enterprise users are able to take advantage of next edit suggestions.
When they are enabled, every time you make changes to your code, for example, renaming a variable, you will be given suggestions about other places that need to be changed.
And when you press Tab, the changes will be made automatically. You can also customize this behavior so you can see previews of the changes and jump continuously to the next edit until no more are suggested.
This is, no doubt, a very handy feature. It can help you avoid some careless mistakes, like forgetting to refactor your code when you make changes. However, for learners, thinking about what needs to be done is a valuable thought exercise, and using this feature can deprive them of some good learning opportunities.
Conclusion
PyCharm offers a lot of useful features to smooth out your day-to-day development workflow. However, these features may be too powerful, and even too convenient, for those who have just started working with Python and need to learn by making mistakes. It is good to use AI features to improve our work, but we also need to double-check the results and make sure that we want what the AI suggests.
To learn more about how to level up your Python skills, I highly recommend watching Mark’s talk on PyTV and checking out all the AI features that JetBrains AI has to offer. I hope you will find the perfect way to integrate them into your work while remaining ready to turn them off when you plan to learn something new.
Building a multiplayer lobby is where most Unity real-time projects fall apart.
Not the networking part — that’s the easy bit. The hard part is everything around it: players joining and leaving mid-session, the host disconnecting and taking the room with them, a player’s phone screen locking for 30 seconds and losing their slot forever. Most tutorials stop at “connected”. This one doesn’t.
This is a complete walkthrough of building a production-ready lobby in Unity using socketio-unity — room creation, join by code, ready states, host migration, and reconnect with a grace window. Every line of code is taken from the real Samples~/Lobby/ sample in the repo, so you can run it locally and pull it apart.
Prerequisites
Unity 2020.1+
Node.js (for the test server)
socketio-unity installed via Window → Package Manager → Add package from git URL:
https://github.com/Magithar/socketio-unity.git
Architecture Overview
Before writing a line of code, the architecture matters. A lobby has three distinct concerns — networking, state, and UI — and mixing them is how you end up with spaghetti that breaks every time the server sends an unexpected event.
The sample uses a clean three-layer split:
LobbyNetworkManager   ← Transport: connects, emits, receives
        ↓ writes
LobbyStateStore       ← State: single source of truth, fires C# events
        ↓ events
LobbyUIController     ← View: subscribes to events, drives UI
The UI never touches the socket directly. The network layer never knows about GameObjects. When something breaks — and in multiplayer, something always breaks — you know exactly which layer to look at.
Step 1 — Connect to the /lobby Namespace
Create a LobbyNetworkManager MonoBehaviour. Use a namespace socket (_root.Of("/lobby")) rather than the root socket — this lets the server scope events cleanly per feature without event name collisions.
Set autoReconnect = false so you control reconnect logic — this is essential for restoring sessions with saved credentials rather than connecting as a fresh player.
Step 2 — Define Your Data Models
The server sends JSON snapshots of the room state. Two things are critical here:
[Preserve] prevents IL2CPP from stripping fields that are only referenced via JSON deserialization — without this, WebGL builds will silently lose data. [JsonProperty] ensures the fields survive minification.
The version check is not optional. During reconnect, the server broadcasts the current room snapshot to the rejoining client — which means the same state can arrive twice. Without the version guard, your UI fires double join/leave events and gets out of sync.
DiffAndFirePlayerEvents lives on LobbyStateStore, called by ApplyRoomState — not on the UI controller. Keep all player diffing logic inside the store.
Step 4 — Wire Up Incoming Events
Subscribe to the four server events in LobbyNetworkManager:
// Server identifies you before room_state arrives_lobby.On("player_identity",(stringjson)=>{varobj=JObject.Parse(json);store.SetLocalPlayerId(obj.Value<string>("playerId"));store.SetSessionToken(obj.Value<string>("sessionToken"));});// Authoritative full snapshot_lobby.On("room_state",(stringjson)=>{varstate=JsonConvert.DeserializeObject<RoomState>(json);store.ApplyRoomState(state);});// Host started the match_lobby.On("match_started",(stringjson)=>{stringscene=JObject.Parse(json)["sceneName"]?.ToString();store.FireMatchStarted(scene);});// Player permanently removed (left or reconnect window expired)_lobby.On("player_removed",(stringjson)=>{varobj=JObject.Parse(json);store.FirePlayerRemoved(obj["playerId"]?.ToString(),obj["name"]?.ToString(),obj["reason"]?.ToString());});
Identity ordering matters: the server sends player_identity before the ACK and before room_state. By the time ApplyRoomState fires, IsHost evaluates correctly.
Step 5 — Emit Lobby Actions
Use ACK callbacks for create_room and join_room — they confirm success and return credentials:
Note on ParseAck: The real LobbyNetworkManager.cs handles three response shapes — raw string, JSON array, and JSON object. The snippets below use a simplified version for readability. For production use, copy the full ParseAck implementation directly from the sample to avoid silent failures on the array case.
Instantiate one prefab row per player. Update without full rebuilds by diffing — recreating all rows on every state update causes flicker and loses UI state:
privatereadonlyDictionary<string,GameObject>_playerRows=new();privatevoidHandlePlayerJoined(LobbyPlayerplayer){varrow=Instantiate(playerRowPrefab,playerListContent);_playerRows[player.id]=row;UpdateRow(row,player);}privatevoidHandlePlayerLeft(stringplayerId){if(_playerRows.TryGetValue(playerId,outvarrow))Destroy(row);_playerRows.Remove(playerId);}// Called on every room_state to reconcile the authoritative listprivatevoidRefreshPlayerRows(RoomStatestate){varstateIds=newHashSet<string>(state.players.Select(p=>p.id));foreach(varidin_playerRows.Keys.Except(stateIds).ToList()){Destroy(_playerRows[id]);_playerRows.Remove(id);}foreach(varplayerinstate.players){if(!_playerRows.TryGetValue(player.id,outvarrow))row=_playerRows[player.id]=Instantiate(playerRowPrefab,playerListContent);UpdateRow(row,player);}}privatevoidUpdateRow(GameObjectrow,LobbyPlayerplayer){booldisconnected=player.status=="disconnected";varnameText=row.transform.Find("NameText").GetComponent<TextMeshProUGUI>();nameText.text=player.id==store.CurrentRoom?.hostId?$"{player.name} [Host]{(disconnected?" (Reconnecting...)":"")}":$"{player.name}{(disconnected?" (Reconnecting...)":"")}";nameText.color=disconnected?Color.gray:Color.white;varicon=row.transform.Find("ReadyIcon").GetComponent<Image>();icon.color=disconnected?Color.yellow:(player.ready?Color.green:Color.gray);}
Step 7 — Handle Disconnects and Session Restore
This is where most lobby implementations give up. The server holds a player’s slot for 10 seconds after disconnect — their row stays visible with status = "disconnected". On reconnect, send saved credentials to reclaim the slot:
privateconststringPREF_ROOM_ID="Lobby_LastRoomId";privateconststringPREF_PLAYER_ID="Lobby_PlayerId";privateconststringPREF_SESSION_TOKEN="Lobby_SessionToken";// Save on every room_statePlayerPrefs.SetString(PREF_ROOM_ID,state.roomId);PlayerPrefs.SetString(PREF_PLAYER_ID,store.LocalPlayerId);PlayerPrefs.SetString(PREF_SESSION_TOKEN,store.SessionToken);// On reconnect — try to restoreprivatevoidHandleConnected(){stringpid=PlayerPrefs.GetString(PREF_PLAYER_ID,"");stringroom=PlayerPrefs.GetString(PREF_ROOM_ID,"");stringtoken=PlayerPrefs.GetString(PREF_SESSION_TOKEN,"");if(!string.IsNullOrEmpty(pid)&&!string.IsNullOrEmpty(token)){networkManager.ReconnectSession(pid,room,token);StartCoroutine(RejoinTimeout(5f));// give up after 5 sec}}
publicvoidReconnectSession(stringplayerId,stringroomId,stringsessionToken){_lobby.Emit("reconnect_player",new{playerId,roomId,sessionToken},ack=>{varresult=ParseAck(ack);if(result?.Value<bool>("ok")!=true){// Room expired — clear credentials and return to lobby selectionPlayerPrefs.DeleteKey(PREF_ROOM_ID);store.FireError(newSocketError(ErrorType.Auth,result?.Value<string>("error")));}});}
The 5-second rejoin timeout is important. If the room expired while the player was disconnected, you don’t want to hang on a reconnect attempt forever — clear the stale credentials and return them to the lobby selection screen.
Step 8 — Start the Match
Only the host sees the Start button. On match_started, all clients load the scene:
// In Update() — simpler than event-driven for a togglestartMatchButton.gameObject.SetActive(store.IsHost);privatevoidHandleMatchStarted(stringsceneName){if(!string.IsNullOrEmpty(sceneName))SceneManager.LoadScene(sceneName);}
Assign LobbyNetworkManager and LobbyStateStore to LobbyUIController in the Inspector. Both should be on a DontDestroyOnLoad GameObject if you carry them across scenes.
Key Patterns
Pattern
Why
room_state.version check
Ignores duplicate snapshots during reconnect
player_identity before ACK
Ensures IsHost is correct by the first room_state
_joinInFlight guard
Prevents double-emit during reconnect sequence
PlayerPrefs session storage
Survives app backgrounding, not just network blips
5-second rejoin timeout
Clears stale credentials if the room already expired
Running the Demo
The Samples~/Lobby/ sample includes a full working server:
cd TestServer~
npm install
npm run start:lobby   # or: npm run dev:lobby (auto-restart via nodemon)
The server lives at TestServer~/lobby-server.js. The package.json at TestServer~/package.json already declares express and socket.io as dependencies — no manual installs needed.
Then open the Unity scene and press Play. The sample is the fastest way to see all of this in action before adapting it to your own project.
The Repo
github.com/Magithar/socketio-unity
MIT licensed. Socket.IO v4 only. WebGL verified. Zero paid dependencies.
What’s the hardest part of multiplayer lobbies you’ve had to solve? Host migration, latency compensation, or something else entirely? Drop it in the comments.
BullMQ needs Redis. Cron has no retries. I needed background jobs that can sleep for 48 hours, fan out to parallel workers, and survive server restarts — without paying for infrastructure I don’t have users to justify yet.
I replaced the entire Redis + BullMQ + cron + monitoring stack with five Inngest functions. Total cost: $0.
AI as a Solo Founder’s Tool
A 5-part email series on using AI as more than a search engine — for building, marketing, and shipping alone.
drippery.app
The Full Picture
Drippery — my drip email SaaS — runs five background functions. Together they cover scheduled email delivery, DNS domain verification polling, orphaned file cleanup, and beta user lifecycle.
All five are registered in one Next.js API route. Inngest calls it via webhook. No Redis, no worker process, no cron container.
Here’s what that replaces:
Without Inngest
With Inngest
Redis instance (~$10/month on Render)
Nothing
BullMQ worker process
Nothing
Cron container or external service
Nothing
Manual retry logic
Built-in, per-step
Observability dashboard
Inngest dashboard (free)
Distributed locking for cron
Handled automatically
Long-running job persistence
step.sleep()
Fan-out worker pool
step.sendEvent()
Let me walk through each function.
The Email Pipeline: Scheduler + Parallel Sender
The core email system is a two-function pipeline. The scheduler runs every 15 minutes and asks: which subscribers are due for their next drip email?
exportconstsendPendingEmails=inngest.createFunction({id:'send-pending-emails',triggers:[cron('*/15 * * * *')]},async ({step})=>{constsubscribers=awaitstep.run('fetch-subscribers',async ()=>findActiveSubscribersWithSequences());// For each subscriber: find next due email, check dayOffset + send window// Dispatch one event per matchawaitstep.sendEvent('dispatch',eventsToDispatch);});
It walks through each active subscriber, finds their position in the sequence, and checks if enough days have passed.
Creators in different timezones shouldn’t get emails at 3 AM — the scheduler verifies the current time matches the tenant’s preferred send window before dispatching anything.
The key decision: fan-out. Instead of sending emails inside the loop, the scheduler dispatches email/send events. Each event triggers a separate function invocation.
50 subscribers due = 50 parallel runs. No worker pool, no concurrency config.
The other critical detail: drip semantics. One email per subscriber per tick, never the whole sequence at once.
Each email/send event triggers the sender — one subscriber, one email, full isolation:
Each step.run() is independently retryable. If the Resend API times out on send-email, only that step retries — the DB fetch doesn’t re-execute.
If the server crashes after sending but before recording, Inngest resumes at record-sent. No double-sends, no lost records.
The 48-Hour Function: Domain Verification Polling
This is the function I couldn’t have built with BullMQ — at least not without a lot of scheduling glue.
When a user adds a custom sender domain, Drippery registers it with Resend and starts polling for DNS verification. This can take 5 minutes or 24 hours — you don’t know upfront.
exportconstcheckDomainVerification=inngest.createFunction({id:'check-domain-verification',triggers:[{event:'domain/check-verification'}]},async ({event,step})=>{const{senderDomainId,attempt=1}=event.data;constMAX_ATTEMPTS=576;// 48 hours at 5-minute intervalsconstresult=awaitstep.run('check-resend',async ()=>{constresend=newResend(process.env.RESEND_API_KEY);returnresend.domains.get(domain.resendDomainId);});if (isVerified)return{status:'verified',attempts:attempt};awaitstep.sleep('wait','5m');awaitstep.sendEvent('next-check',{name:'domain/check-verification',data:{senderDomainId,attempt:attempt+1},});});
This function can run for up to 48 hours.step.sleep() suspends the function, frees server resources, then resumes exactly where it left off.
With BullMQ, you’d need explicit delayed job scheduling, persistence logic, and retry handling. Here it’s one line:await step.sleep('5m').
The Maintenance Jobs: Cleanup + Beta Lifecycle
The remaining two functions are simpler but follow the same pattern.
Orphan image cleanup runs every Sunday at 3 AM. It compares images in Cloudflare R2 against database references and deletes anything unreferenced:
Each tenant gets its own step.run(). If one tenant’s email lookup fails, only that step retries — the rest still get processed.
The Cost
Inngest’s free tier gives you 50,000 executions per month. My actual usage is well under 10,000 — scheduler ticks, dispatched sends, daily and weekly jobs.
For an early-stage SaaS, the free tier has plenty of headroom.
When I outgrow it, paid plans start at $75/month. By that point, I’ll have enough paying users to cover it. That’s the scaling curve I wanted.
What’s Next
Five functions today. The next one will probably be a subscriber re-engagement job — if someone hasn’t opened the last 3 emails, automatically pause their sequence and notify the tenant.
Same pattern: one more function file, zero infrastructure changes.
The entire background job layer of my SaaS is five TypeScript functions, one API route, and zero managed services. When you’re building alone, that’s the architecture that lets you ship.
If you’re curious about Drippery — dead-simple drip email sequences for creators, starting at $0/month — check it out at drippery.app.
I write weekly about what I’m shipping and what’s breaking on Substack.
In the previous article, we learned how word embeddings and positional encoding are combined to represent both meaning and position.
Now let’s go back to our example where we translate the English sentence “Let’s go”, and add positional values to the word embeddings.
Now, let’s get the positional encoding for both words.
Understanding Relationships Between Words
Now let’s explore how a transformer keeps track of relationships between words.
Consider the sentence:
“The pizza came out of the oven and it tasted good.”
The word “it” could refer to pizza, or it could potentially refer to oven.
It is important that the transformer correctly associates “it” with “pizza”.
Self-Attention
Transformers use a mechanism called self-attention to handle this.
Self-attention helps the model determine how each word relates to every other word in the sentence, including itself.
Once these relationships are calculated, they are used to determine how each word is represented.
For example, if “it” is more strongly associated with “pizza”, then the similarity score for pizza will have a larger impact on how “it” is encoded by the transformer.
We have now covered the basic idea of self-attention. We will explore it in more detail in the next article.
Looking for an easier way to install tools, libraries, or entire repositories?
Try Installerpedia: a community-driven, structured installation platform that lets you install almost anything with minimal hassle and clear, reliable guidance.
Primitive and Non-primitive data-types in JavaScript.
Variables hold values, and every value has a specific data type that defines the kind of information it holds. These data types are broadly categorized into two groups: Primitive Data Types and Non-Primitive Data Types. Let us discuss it one by one.
Primitive Data Types:
Primitive data types are the built-in data types provided by JavaScript. They represent single values and are not mutable. JavaScript supports the following primitive data types:
1.1 Number:
Number data type in JavaScript can be used to hold decimal values as well as values without decimals.
Example:
let x = 250;
let y = 40.5;
console.log(“Value of x=” + x);
console.log(“Value of y=” + y);
Output
Value of x=250
Value of y=40.5
1.2 String:
The string data type in JavaScript represents a sequence of characters that are surrounded by single or double quotes.
Example:
let str = ‘Hello All’;
let str1 = “Welcome to my new house”;
console.log(“Value of str=” + str);
console.log(“Value of str1=” + str1);
Output
Value of str=Hello All
Value of str1=Welcome to my new house
1.3 Undefined:
This means that a variable has been declared but has not been assigned a value, or it has been explicitly set to the value undefined.
Example:
let x;
console.log(x); // Outputs: undefined
Output:
Screenshot-(6)
undefined output
1.4 Boolean:
The boolean data type can accept only two values i.e. true and false.
Example:
let x;
console.log(x); // Outputs: undefined
Output:
Click to enlarge
boolean output
1.5 Null:
This data type can hold only one possible value that is null.
Example:
let x = null;
console.log(“Value of x=” + x);
Output
Value of x=null
1.6 BigInt:
BigInt data type can represent numbers greater than 253-1 which helps to perform operations on large numbers. The number is specified by writing ‘n’ at the end of the value
Example: Below is an example.
let bigNum = 123422222222222222222222222222222222222n
console.log(bigNum)
Output
123422222222222222222222222222222222222n
1.7 Symbol:
Symbol data type is used to create objects which will always be unique. these objects can be created using Symbol constructor.
Example:
let sym = Symbol(“Hello”)
console.log(typeof(sym));
console.log(sym);
Output
symbol
Symbol(Hello)
Non-primitive Data Types:
Non-primitive data types, also known as reference types, are objects and derived data types. They can store collections of values or more complex entities. The two key non-primitive data types in JavaScript are:
2.1 Object:
An object in Javascript is an entity having properties and methods. Everything is an object in javascript.
How to create an object in javascript:
Using Constructor Function to define an object:
// Create an empty generic object
let obj = new Object();
// Create a user defined object
let mycar = new Car();
Using Literal notations to define an object:
// An empty object
let square = {};
// Here a and b are keys and
// 20 and 30 are values
let circle = {a: 20, b: 30};
Example:
// Creating object with the name person
let person = {
firstName: “MS”,
lastName: “Praveen”,
};
// Print the value of object on console
console.log(person.firstName
+ ” ” + person.lastName);
Output
MS Praveen
2.2 Array:
With the help of an array, we can store more than one element under a single name.
Ways to declare a single-dimensional array:
// Call it with no arguments
let a = new Array();
// Call it with single numeric argument
let b = new Array(10);
// Explicitly specify two or
// more array elements
let d = new Array(1, 2, 3, “Hello”);
Example:
let a = new Array();
let b = new Array(10);
let d = new Array(1, 2, 3, “Hello”);
console.log(“value of a=” + a);
console.log(“value of b” + b);
console.log(“value of d=” + d);
Output
value of a=
value of b,,,,,,,,,
value of d=1,2,3,Hello
Note: JavaScript does not support two-dimensional arrays. but we can do this by creating an array of an array.
Primitive data types:
Primitive Data types are predefined.
Primitive Data types will have certain values.
Size depends on the type of data structure.
Examples are numbers and strings.
It can start with a lowercase.
Non-primitive data types:
Non-Primitive data types are created by the programmer
Primitive Data types will have certain values.
Most security breaches don’t happen because attackers are geniuses.
They happen because:
Access control is missing one check
Encryption is configured “later”
Input validation is assumed, not enforced
The OWASP Top 10 documents these exact failures—the most common, most dangerous application security risks seen across the internet.
This series is about understanding them deeply and fixing them practically, specifically in AWS‑based architectures.
🎯 What This Series Is (and Isn’t)
✅ What You’ll Get
Clear explanations of each OWASP Top 10 category
Realistic AWS examples (API Gateway, ALB, ECS, Lambda, WAF)
Practical mitigation strategies you can apply immediately
Security reasoning that developers, DevOps, and architects can align on
❌ What You Won’t Get
Vendor fluff
Overly academic theory
Fear‑driven security talk
“Enable this checkbox and you’re done” advice
This is about how vulnerabilities actually happen in real systems—and how to stop them.
🧭 Why the OWASP Top 10 Still Matters
The OWASP Top 10 is more than a list. It’s the common language of application security.
It matters because it:
🛠 Aligns Engineering & Security
Tools like AWS WAF, F5, Burp Suite, and SAST/DAST scanners reference OWASP risks directly.
📜 Defines Compliance Baselines
Standards like SOC 2, PCI DSS, HIPAA, and ISO 27001 map directly to OWASP categories.
🚨 Focuses on Real‑World Breaches
Addressing the OWASP Top 10 mitigates the majority of web application attacks seen in production.
If you build or operate applications, you’re already dealing with OWASP—whether you realize it or not.
🗺️ The 10‑Day Roadmap
Each post covers one OWASP category per day, with hands‑on cloud context.
✅ Day 1: Broken Access Control (A01:2021)
🔐 Day 2: Cryptographic Failures
💉 Day 3: Injection
🔄 Day 4: Insecure Design
⚙️ Day 5: Security Misconfiguration
🧩 Day 6: Vulnerable & Outdated Components
🔑 Day 7: Identification & Authentication Failures
📊 Day 8: Software & Data Integrity Failures
📝 Day 9: Security Logging & Monitoring Failures
🌐 Day 10: Server‑Side Request Forgery (SSRF)
Each post stands alone—but together they form a complete security mindset.
☁️ AWS‑First, Vendor‑Aware
Examples and mitigations will focus on:
AWS WAF & Shield
API Gateway
Application Load Balancers
ECS, EKS, and Lambda
IAM, CloudWatch, and CloudTrail
Where useful, I’ll also reference advanced WAFs (like F5) to show how defense‑in‑depth actually works in real enterprises.
👥 Who This Series Is For
Backend & frontend developers
Cloud & DevOps engineers
Architects responsible for secure design
Security engineers working with product teams
Anyone tired of security advice that doesn’t map to real systems
If you’ve ever said:
“We’ll fix security later…”
This series is for you.
📌 Follow the series to get each post as it drops
Let’s build systems that are harder to break—and easier to defend.
This post was written together with Thorben Janssen, who has more than 20 years of experience with JPA and Hibernate and is the author of “Hibernate Tips: More than 70 Solutions to Common Hibernate Problems” and the JPA newsletter.
Spring Data JDBC provides a simple and predictable persistence model. It focuses on aggregate roots, constructor-based mapping, and clear rules for reading and writing data. If you enjoy working with explicit data flows and want full control over your SQL, Spring Data JDBC might be the perfect framework for your project.
And with Kotlin, everything becomes so much easier. Its focus on immutability, null safety, and concise data structures aligns nicely with Spring Data JDBC’s design. In this article, you will see how to model aggregates, store and retrieve data, use value objects, handle child entities, and define custom queries using Kotlin.
Kotlin’s strengths for JDBC-based persistence
Before looking at concrete examples, it helps to understand why Kotlin fits so well into this programming model.
Data classes keep your aggregates concise. They define constructor parameters, implement the equals(), hashCode(), and toString() methods, and encourage immutable states. Spring Data JDBC provides strong support for constructor-based mapping and handles immutable aggregates with ease, significantly reducing boilerplate code.
Kotlin’s type system also reduces many common mistakes. Nullability is explicit, so you can see immediately which fields may not contain a value. Constructor-based mapping becomes more reliable because there is no silent conversion of null values into empty strings or default primitives.
Lightweight value classes allow you to express domain concepts without adding noise. An email address, a customer number, or a price becomes a first-class concept in your model. And Spring Data JDBC can, of course, map them without requiring any additional boilerplate code or mapping annotations.
Kotlin also simplifies custom query projections, because data classes work very well with constructor mapping. Default parameters, named arguments, and collection operations make aggregate updates straightforward.
All these features create a natural fit for Spring Data JDBC and Kotlin.
Defining an aggregate root with Kotlin
An aggregate is a pattern introduced by domain-driven design (DDD) concepts. It consists of one or more entities that are handled as a unit when reading or writing them to the database. The aggregate root is the primary object of the aggregate. You address it when referencing the aggregate or when fetching it from the database.
Let’s start with a simple aggregate that only consists of the aggregate root. Each instance is stored as a record in your database whenever you decide to persist or update it. There is no hidden state and no proxying.
The following data class represents a person. The @Table annotation is optional, but it clearly marks the class as an entity. This helps IntelliJ IDEA to provide you with the most suitable tooling when building your persistence layer.
The @Id annotation marks the field as the object’s identifier. The @Sequence annotation is optional and tells Spring Data to retrieve a value from the database sequence when persisting a new object. And because this happens after you created a new Person object in your code, the ID field has to be nullable.
If you want, you can define all other fields as non-nullable.
@Table
data class Person(
    @Id
    @Sequence(sequence = "person_seq")
    val id: Long? = null,
    val firstName: String,
    val lastName: String
)
As you can see in the code snippet, you don’t need to provide any additional mapping annotations. By default, Spring Data JDBC maps the class to a database table with the same name and each field to a column with the same name. You can change this mapping by annotating your class with @Table and a field with @Column. But most teams try to avoid that to keep their entities easy to read and understand.
By default, Spring Data JDBC uses the primary constructor to create and hydrate entity instances. You can also annotate a constructor with @PersistenceCreator if you want Spring Data JDBC to use it instead. This is an excellent match for Kotlin’s data classes, because all non-primary-key fields can be immutable, mandatory, and have default values. This helps you avoid uninitialized properties and the need for no-argument constructors that you might be familiar with in Spring Data JPA and other persistence frameworks.
After you define the aggregate, you have to create a repository to manage it.
Creating repositories and defining queries
Spring Data JDBC uses repository interfaces to define data access operations. The simplest way to define a repository is to extend Spring Data JDBC’s CrudRepository.
This provides you with basic methods, including save(), findById(), and deleteById().
You can also add your own queries using Spring Data JDBC’s derived query methods. These are methods whose names describe the query that Spring Data JDBC should execute. The framework parses the method name, creates the appropriate SQL statement, and maps the query result.
And if you need more control over the executed query statement, you can define a method, annotate it with @Query, and provide your own SQL statement. Spring Data JDBC handles the rest!
Here are a few examples.
interface PersonRepository : CrudRepository<Person, Long> {
    fun findByLastName(lastName: String): List<Person>

    @Query("select * from Person p where p.last_name = :lastName")
    fun getByLastName(lastName: String): List<Person>
}
You can also return Kotlin data class projections. This works well when you want to read specific columns but not the entire aggregate, or when you want to transform your data into a different structure.
The following PersonName data class and findPersonNameById repository method show a typical example.
data class PersonName(
    val id: Long,
    val name: String
)

interface PersonRepository : CrudRepository<Person, Long> {
    @Query("select p.id, p.first_name || ' ' || p.last_name as name FROM Person p where p.id = :id")
    fun findPersonNameById(id: Long): PersonName
}
Spring Data JDBC executes the defined query and maps the query result to the constructor parameters of the PersonName class. This keeps the projection code clean and allows you to avoid manual mapping.
2025-12-09T21:59:12.572+01:00 DEBUG 7484 --- [SDJWithKotlin] [           main] o.s.jdbc.core.JdbcTemplate               : Executing prepared SQL statement [select p.id, p.first_name || ' ' || p.last_name as name FROM Person p where p.id = ?]
2025-12-09T21:59:12.595+01:00  INFO 7484 --- [SDJWithKotlin] [           main] c.t.j.k.s.SpringDataJdbcKotlinTests      : PersonName(id=401, name=Jane Smith)
Persisting and loading aggregates
Working with repositories is straightforward. Each call interacts directly with the database. There is no state tracking or implicit updates. This makes the behavior easy to understand and gives you full control over the executed statements.
@Service
@Transactional
class PersonService(private val personRepository: PersonRepository) {
    fun createNewPerson(firstName: String, lastName: String): Person {
        // add additional validations and/or logic ...
        return personRepository.save(
            Person(
                firstName = firstName,
                lastName = lastName
            )
        )
    }

    fun updateLastName(id: Long, lastName: String): Person {
        val person = personRepository.findById(id).orElseThrow()
        val updated = person.copy(lastName = lastName)
        return personRepository.save(updated)
    }
}
The only logic Spring Data JDBC provides when you call the save() method is a check to see if the identifier is null. If it is, the record is inserted. Otherwise, an update is executed. Since all fields are immutable, you’re always working with complete and consistent objects.
Using Kotlin value objects in your aggregate
Real-world aggregates often contain values that deserve their own type. Using Kotlin, you can model them using value classes, and Spring Data JDBC supports them out of the box.
If your value class only wraps one value, you should annotate it with @JvmInline. This activates a Kotlin-specific optimization removing the performance overhead of a wrapper class by replacing it with its inlined value at runtime.
@JvmInline
value class Email(val value: String)

data class Person(
    @Id
    @Sequence(sequence = "person_seq")
    val id: Long? = null,
    val firstName: String,
    val lastName: String,
    val email: Email
)
As you can see, Kotlin’s value and data classes make the code very easy to read and quick to write.
Doing the same in Java requires much more code, an additional mapping annotation and Spring Data JDBC’s embedded entity concept.
@Table
public class Person {

    @Id
    @Sequence(sequence = "person_seq")
    private Long id;

    private String firstName;

    private String lastName;

    @Embedded.Nullable
    private Email email;

    public Long getId() {
        return id;
    }

    public void setId(Long id) {
        this.id = id;
    }

    public String getFirstName() {
        return firstName;
    }

    public void setFirstName(String firstName) {
        this.firstName = firstName;
    }

    public String getLastName() {
        return lastName;
    }

    public void setLastName(String lastName) {
        this.lastName = lastName;
    }

    public Email getEmail() {
        return email;
    }

    public void setEmail(Email email) {
        this.email = email;
    }
}

public class Email {

    private String email;

    public Email(String email) {
        this.email = email;
    }

    public String getEmail() {
        return email;
    }

    public void setEmail(String email) {
        this.email = email;
    }
}
Java doesn’t know value classes. Spring Data JDBC tries to compensate for this by introducing the concept of an embedded entity.
You define an embedded entity by creating a Java class with a set of properties. In this example, that’s the Email class with its email property. To use the Email class as a property type, you have to annotate it with @Embedded. Spring Data JDBC then applies the same mapping we covered in the example demonstrating Kotlin’s value class. It maps the email field to a database column with the same name, enabling you to use it in all your queries.
So, it looks like you have to write more code and use an embedded entity in Java to get the same result as you got with a simple value class in Kotlin. But it’s actually worse than that. In Kotlin, you can annotate your simple value classes with @JvmInline and get the previously described optimizations. These don’t exist in Java. As a result, your embedded class mapping not only requires more code – it also carries a much greater performance overhead.
Now, let’s get back to our Kotlin-based examples.
Spring Data JDBC maps the value object based on its wrapped value and doesn’t require any additional mapping annotations.
You can even use the value class as a parameter type in your derived or custom queries.
2025-12-09T22:03:49.340+01:00 DEBUG 14665 --- [SDJWithKotlin] [           main] o.s.jdbc.core.JdbcTemplate               : Executing prepared SQL statement [SELECT "person"."id" AS "id", "person"."email" AS "email", "person"."last_name" AS "last_name", "person"."first_name" AS "first_name" FROM "person" WHERE "person"."email" = ?]
2025-12-09T22:03:49.363+01:00  INFO 14665 --- [SDJWithKotlin] [           main] c.t.j.k.s.SpringDataJdbcKotlinTests      : Person(id=401, firstName=Jane, lastName=Smith, email=Email(value=a@b.com))
Modeling one-to-many relationships
Aggregates can contain collections of child entities. Spring Data JDBC stores each of these entity types in separate tables.
data class Company(
    @Id
    var id: Long,
    val name: String,
    val employees: List<Employee>
)

data class Employee(
    @Id
    var id: Long,
    var name: String
)
When you read the aggregate, Spring Data JDBC always fetches the entire aggregate with all child entities. And it handles all write operations the same way. When persisting or updating an aggregate, it writes the entire aggregate with all its entities to the database. This fits well with Kotlin’s immutable list types, but requires some attention when defining your aggregates to avoid performance issues.
Transactions and practical considerations
Spring Data JDBC integrates with Spring’s transaction management. A transactional boundary ensures that all write operations within the aggregate are applied consistently.
Kotlin reduces many typical pitfalls. Properties must be initialized, nullability is clear, and immutable data helps avoid accidental side effects. When updating an aggregate, you create a new instance with the correct state as opposed to modifying an existing one. This results in a predictable and maintainable persistence layer.
Conclusion
Spring Data JDBC offers a clear and simple approach to relational persistence. You work with aggregates that are written and read as complete units, and you always know which statements are executed. Kotlin supports this style through immutable data structures, value classes, nullability rules, and concise syntax.
If you design your aggregates carefully and treat each instance as a complete snapshot of its state, you can build applications that remain easy to understand and maintain. The combination of Spring Data JDBC and Kotlin gives you a persistence stack that stays simple even as your application grows.
To learn more about persistence with Kotlin, check out our two previous articles in this series:
How to Avoid Common Pitfalls with JPA and Kotlin
Using Spring Data JPA with Kotlin
About the author
Thorben Janssen
Thorben Janssen is a consultant and trainer who helps teams build better persistence layers with JPA and Hibernate. An international speaker with more than 20 years of experience in JPA and Hibernate, Thorben is the author of the best-selling book Hibernate Tips: More than 70 solutions to common Hibernate problems.
He also writes on thorben-janssen.com about various persistence topics, and to help developers improve their skills, he founded the Persistence Hub.
Join us Thursday, April 16, 2026, 15:00 – 16:30 UTC (check other timezones) for our free live webinar, OSS PowerUps – XenoAtom.Terminal.UI, with Alexandre Mutel. This is the fifteenth episode of our series of OSS Power-Ups, where we put a spotlight on open-source .NET projects.
Register now and get a reminder, or join on YouTube
What does it take to build a terminal UI that feels modern – and keeps it maintainable as it grows? In this talk, I’ll share the behind-the-scenes journey of creating XenoAtom.Terminal.UI, focusing on the design choices that enabled a reactive, binding-first retained model, a consistent layout pipeline, and a foundation that scaled to 60+ controls without turning into framework spaghetti.
I’ll also show how AI coding agents accelerated key parts of the work – from API exploration to implementation, refactoring, and tests – what worked, what didn’t, and the practical guardrails that kept the project shippable. Finally, I’ll connect these lessons to how I’m evolving my broader OSS portfolio: what’s next, how I choose projects, and how AI is changing the way I build open source.
You can attend Alexandre Mutel’s webinar on YouTube, or register here to get a reminder closer to the webinar.
About the presenter:
Alexandre Mutel
Alexandre Mutel is VP of Engineering at DataGalaxy, driving innovation in the data governance space. With 20+ years in .NET, he’s known for widely used open-source projects like SharpDX, Markdig, Scriban, and the profiler Ultra. He enjoys pushing .NET into unexpected territory – from high-performance tooling to retro experiments like building a .NET framework for the Commodore 64.
You can follow Alexandre on Mastodon, BlueSky, LinkedIn, and GitHub.
What happens when we try to draw a single pixel in Java? The rendering triggers a sophisticated and multi-layered process. It begins within the high-level frameworks of Java’s Abstract Window Toolkit (AWT) or Swing, then flows through the Java 2D graphics pipeline, necessitating precise handling of color models, gamma correction, and coordinate-space transformations. To reach the Wayland compositor, the pixel is embedded within memory buffers shared between processes, subjected to thorough tracking of changed regions, and eventually presented on the display, completing its journey from an abstract computation to a tangible visual element.
This deep dive is intended for anyone working on Java UI optimization on Linux. It walks through the components and processes involved in carrying that pixel from your Java code to the display.
The beginning
We usually render in Java by making a draw call in an overridden
public void paint(Graphics g)
method of some AWT/Swing Component like so:
g.drawRect(x, y, 1, 1)
The Graphics object passed to every paint() provides a host of methods for drawing a given graphics primitive – like a tiny rectangle in our case – on the underlying canvas. Graphics redirects the actual work to an appropriate group of rendering algorithms collectively called a “graphics pipeline”.
The pipeline is chosen based on various properties of Graphics, such as rendering hints or the effective compositing algorithm (in other words, a method of overlaying semi-transparent colors). Should any of those properties change (for example, with a call like setRenderingHint(RenderingHints.KEY_ANTIALIASING, RenderingHints.VALUE_ANTIALIAS_ON)), Graphics will be forced to reconsider the decision about the pipelines and choose new ones to suit the new circumstances. The code responsible for this decision can be found in SurfaceData.validatePipe().
Rendering and raster
The input to a renderer is a mathematical abstraction of a two-dimensional shape and associated attributes (like color and stroke), and its output is a group of pixels representing that shape. The renderer uses a two-dimensional grid of pixels – a raster (specifically WritableRaster) – provided by the Graphics object as a canvas to paint on.
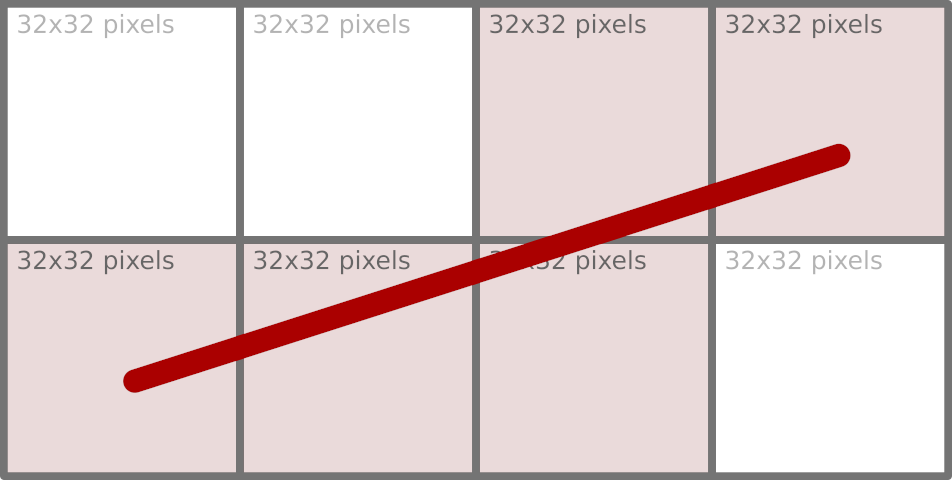
Note: Some renderers break large primitives into chunks (for instance, 32×32 units) and work with each chunk individually (for example, MarlinTileGenerator), which is why we can see – with certain tracing tools – a large amount of small window updates resulting from a single drawing operation.
Moving pixels around in such small chunks is far from optimal from a memory-access point of view. We will return to how this problem is addressed later.
When painting on the window’s surface, we didn’t need to create any rasters to store pixels. Where did the raster come from then? Since we are painting on a window, that window must be the source of raster pixels – and this is true, up to a point.
Every AWT window that needs to be displayed on the screen has a counterpart in the native desktop windowing system. That counterpart is represented by a peer object (WindowPeer), which acts as a bridge between the native and Java parts of AWT. One of the bridge’s properties is the window’s content, represented as a SurfaceData object that stores the raster and handles all the low-level details. The peer manages this SurfaceData object and grants access to it upon request. Whenever a part of a window needs to be repainted, the AWT subsystem (sun.awt.RepaintArea) responsible for doing that obtains SurfaceData for the window wrapped in a Graphics object, which is later used as the target of various draw, fill, or clear operations.
Representing native windowing systems suggests that SurfaceData has to do more with the platform’s native code. At this level, SurfaceData is defined by a rather small API (see SurfaceData.h), with which we can lock a region of the surface (for reading, writing, or both), obtain a direct pointer to the raster, and then release it. This compact contract is enough to introduce a new surface type: Any platform or graphics subsystem can provide its own implementation of these functions, thereby plugging seamlessly into the Java 2D rendering pipeline without requiring modifications to the higher-level Java code.
Concrete implementations of SurfaceData exist for each supported rendering target. For in-memory images represented by BufferedImage, BufImgSurfaceData manages pixel data stored in the Java heap. For on‑screen rendering, platform‑specific variants handle the native windowing system: WLSMSurfaceData for Wayland, D3DSurfaceDatafor Direct3D on Windows, and MetalSurfaceData for macOS’s Metal framework, etc. Each of these subclasses supplies the necessary native hooks to lock the appropriate framebuffer or texture, ensuring that the same Java‑level drawing operations (whether performed by the Marlin renderer or by a hardware‑accelerated pipeline) can target any surface while keeping platform specifics isolated behind the stable SurfaceData interface.
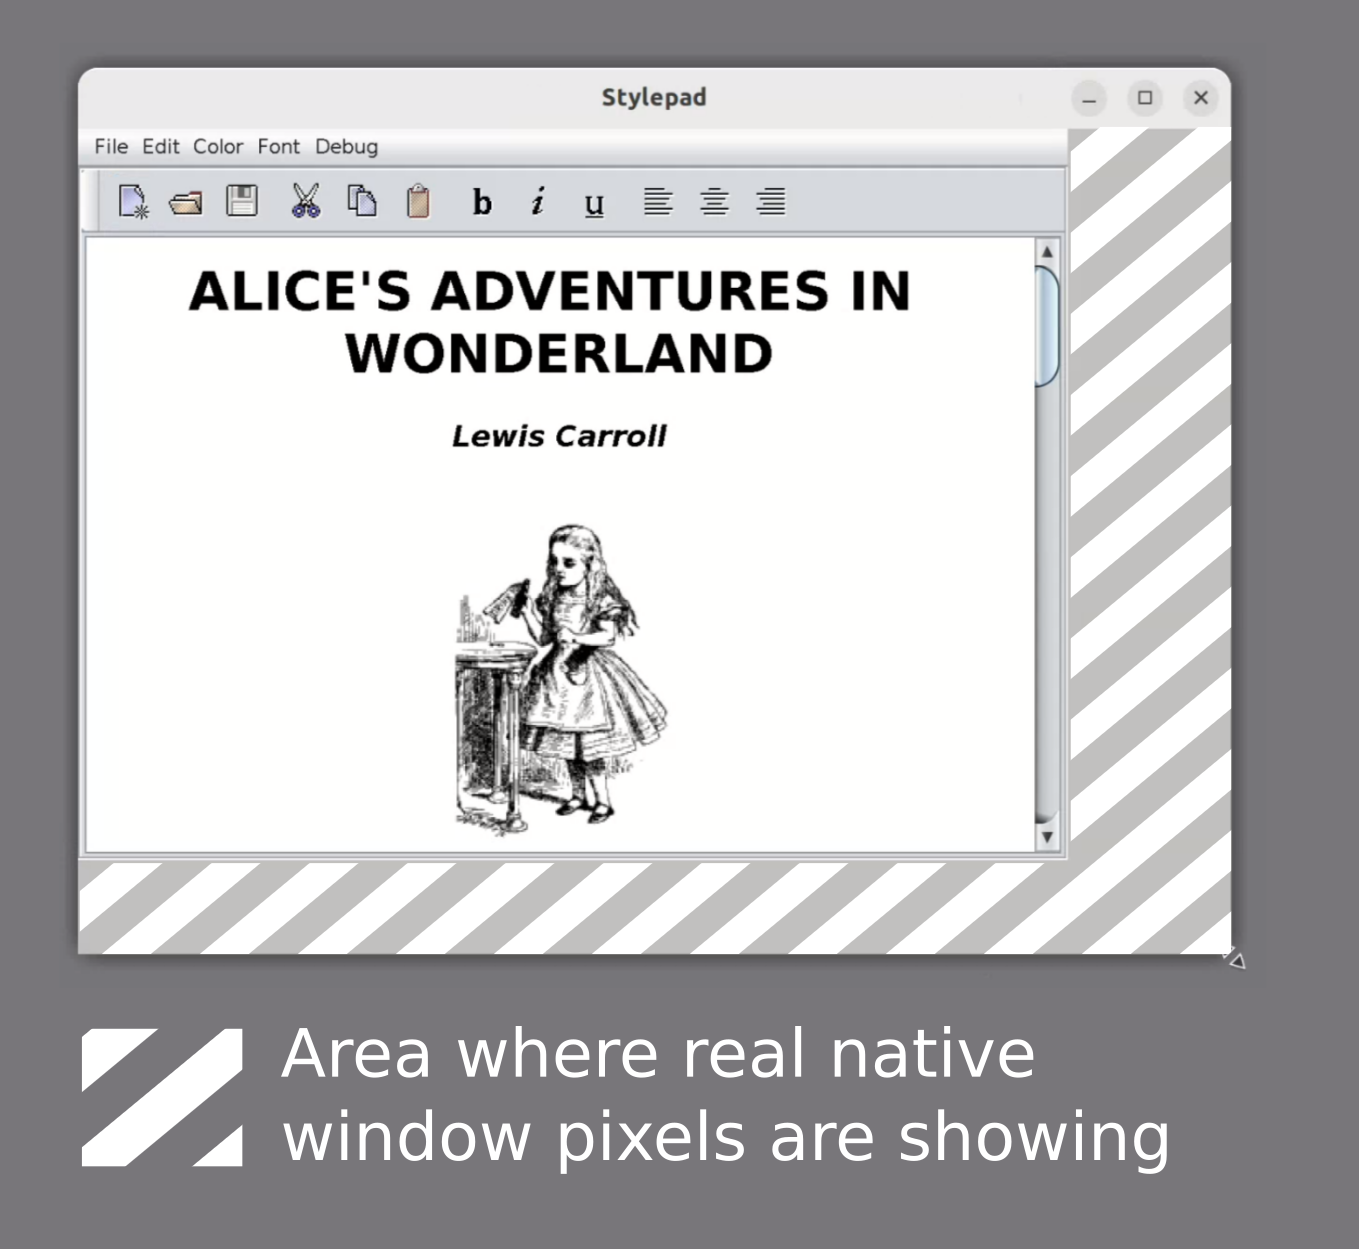
The locking mechanism in the Wayland compositor is crucial for efficient change tracking. Acting as a synchronization point, this locking function identifies precisely which areas of the surface are affected by a client’s buffer update, limiting further processing only to the “damaged” areas of the window.
We have established that, when painting on a window, the raster comes from the native window subsystem. With Swing, the situation with raster origins is more involved. Painting in Swing is routed through a class called RepaintManager, which accumulates changes made to the window’s surface and can be configured to use its own buffering strategy (for example, with the -Dswing.bufferPerWindow=true VM option). When such double-buffering is in effect, the repaint manager itself provides the canvas for the Swing components to paint on. Only after all updates (JComponent.paintToOffscreen()) are finished does it transfer the resulting image to the native window’s SurfaceData using an operation called blitting.
In the simplest case, blitting is just a memory copy operation. That, of course, can work only when both source and destination image formats are identical. If they are not, the very sophisticated Java 2D subsystem provides the blit algorithm that performs the conversion on the fly (see GeneralMaskBlit), but the performance of this operation suffers greatly compared to a simple memory copy. This is why, when working with BufferedImage objects, it is important to pick image formats that exactly match the native graphics system (i.e. SurfaceType of SurfaceData) and avoid conversions altogether. For this purpose, we have GraphicsConfiguration.createCompatibleImage().
There’s one interesting side effect to the Swing double-buffering. The buffers that act as temporary storage for the future window content need to be resized whenever the window changes size. This resizing does not happen immediately, so when you enlarge a double-buffered Swing window very quickly, the buffer size may lag behind the new window size. This discrepancy makes the raw window SurfaceData raster visible at the resize edges for a moment.
Colors and blending
Each pixel in a raster consists of one or more data elements that correspond to color components like red, green, blue, and alpha. The ColorModel class defines how these data elements should be interpreted, serving as the bridge that converts an abstract color specification (such as an RGB or RGBA value) into the actual numerical values stored in a pixel. While this transformation may appear straightforward, it is in fact considerably more complex beneath the surface.
Take the alpha value, for example. Consider the color Color(255, 255, 255, 128), a semi-transparent white. Given a very straightforward conversion into a 32-bit RGBA pixel, which of the following is right?
0xFFFFFF80
0x80808080
0x80808000
The last one has lost the transparency value, which may seem like a bad thing at first, but it all depends on the context. If this pixel is not meant for further blending with other semi-transparent ones and will only be copied as is, it is as good as option (2). But do (1) and (2) represent the same pixel, though, especially given that their numeric values are different?
That’s where ColorModel.isAlphaPremultiplied() comes in.
When two images are overlaid (which happens a lot – think of a Button painted over a Frame background), the resulting value of each pixel is calculated according to the effective AlphaComposite rule. The compositing rule implements one of the Porter/Duff operations, with the default being AlphaComposite.SrcOverNoEa. In this most common case of painting a semi-transparent pixel over an opaque background, the resulting color component can be expressed as
where source_alpha is normalized to the [0, 1] range (i.e. 0x80 is exactly a coefficient of 0.5).
There are two multiplications here: source_color * source_alpha applies the alpha value to the source pixel, and it needs to be done every time that pixel is used in a blending operation. This is, of course, somewhat expensive, given the size of images that need to be displayed on a typical 4K monitor (8,294,400 pixels). So it is common to store pixels with their alpha value already pre-multiplied. In this encoding scheme, a semi-transparent white is 0x80808080 rather than 0xFFFFFF80. Note how drastically the pixel value of the same color differs depending on ColorModel.isAlphaPremultiplied(). It is important to keep track of this property and apply it correctly.
Color space
So far, the color has been represented as a vector in three-dimensional space. One important implied characteristic of that space is that it is linear in emitted energy: A vector of (128, 128, 128) in a linear space emits twice as much energy as (64, 64, 64), for example. But that is not how human vision perceives the emitted light.
We can differentiate a greater number of dark colors, while the differences in very bright ones are less noticeable to the human eye. This suggests that, when encoding a color, more resolution is needed for dark tones, possibly at the expense of the bright side of the spectrum for perceptually linear results. The process of transforming a color according to this logic is called gamma encodingand can be approximately expressed as:
stored_value = linear_value ^ (1 / 2.2),
where 2.2 is the gamma value tuned to the sensitivity of human vision. This transformation function effectively allocates more code values for darker colors while compressing the intensity of bright colors.
Most consumer-level devices like displays expect their input pixel values to be in a non-linear color space called sRGB. The sRGB color space gamma uses a piecewise encoding function that remains linear near 0 values while maintaining an effective gamma of about 2.4, making it even more complex.
Since pixel values consumed by the hardware need to be in sRGB, we must store them in the same sRGB color space in Java to save on conversion. This is a widely used optimization, but it’s not without its pitfalls.
Gamma correction
Suppose we have just painted an image with non-opaque parts and we want to overlay it on top of some background. All images involved are in the sRGB color space to save on final conversion, as we have just noted. The blending function introduced earlier – for a source pixel with 0.5 alpha and the color black on a white background – simplifies to
But wait: We are applying the rules for blending in a linear space to a very non-linear one! The correct approach would be to first convert all the colors to the linear space, perform the blending operation, and convert the result back to sRGB. Following these steps, we get 188 instead of 127.
In terms of energy emission, 188 in the sRGB space corresponds to ~50% linear light intensity, while 127 emits only ~21%. So blending directly in sRGB without intermediate conversions results not only in an incorrect color, but also in darker visuals overall.
Performing those intermediate conversions, however, is very costly if we must do this for every displayed frame, especially in CPU-based pipelines. Consequently, it is common to blend images as if they were already in a linear space, applying some adjustments to compensate for the darker results. These kinds of conversion errors can actually live unnoticed for years because they affect all color components equally, making the incorrect result less obvious in many cases.
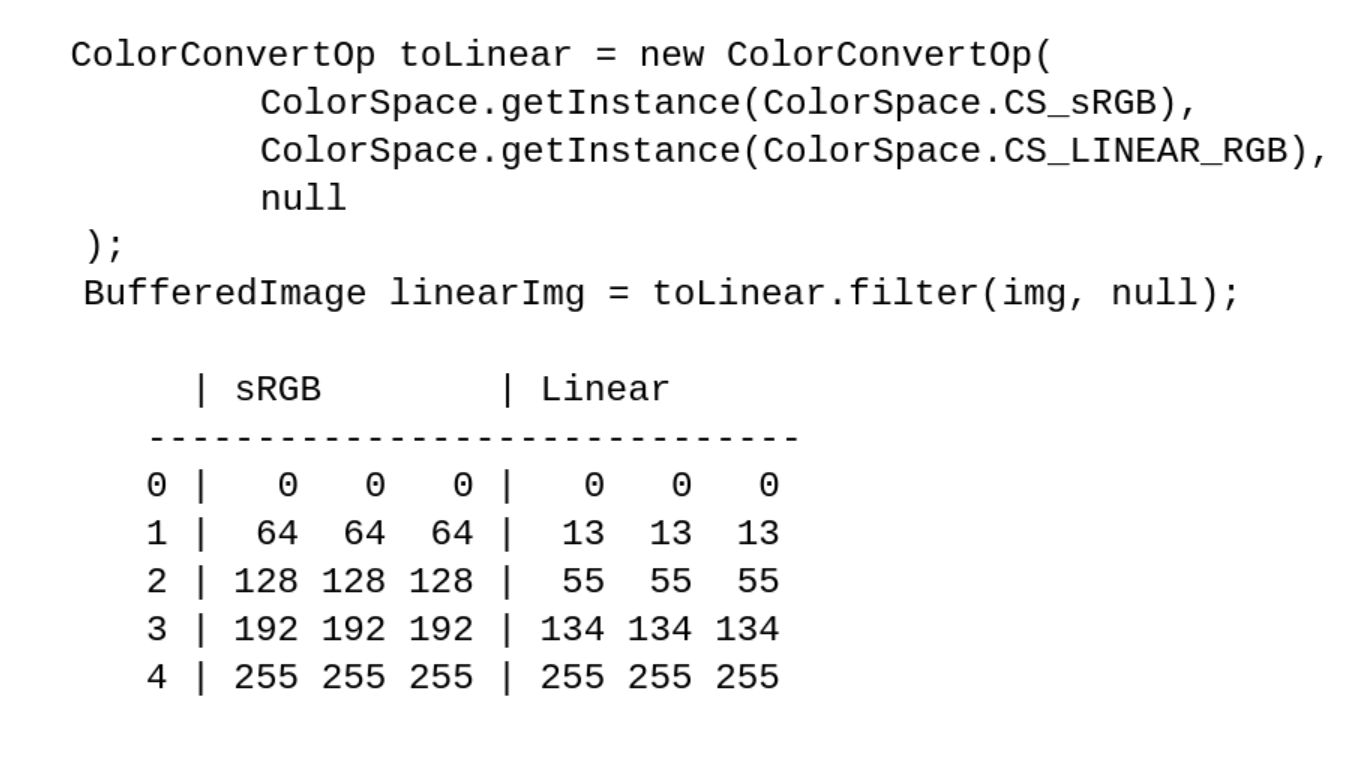
Note: To see the effects of color spaces on pixel values, use ColorConvertOp and access the image’s pixels directly through BufferedImage.getRaster().
Here are a few samples of gray pixels in sRGB space converted to a linear space with
Properties of Graphics
We have spent a great deal of time discussing the issues of colors and blending, but where did the actual color come from? It was not specified to the drawing primitive (the drawRect() call).
Color is actually one of many properties of a Graphics object. In practice, we typically encounter a Graphics2D object, which is in fact a descendant of Graphics. Color may be specified either implicitly at its creation or changed explicitly through, for example, Graphics.setColor().
In the simplest case, the painting color is SystemColor.windowText and the clearing (background) color SystemColor.window, which are obviously toolkit-dependent (initialized by Toolkit.loadSystemColors()). So when you paint with a Graphics object, you paint with Graphics.getColor(), and when you clear using, say, Graphics2D.clearRect(), you paint with Graphics2D.getBackground().
Coordinate systems
Going back to the starting point – g.drawRect(x, y, 1, 1) – are those 1 values really pixels? Which measurement units are those, or, more formally, what is the coordinate space the drawing primitives operate in? At this level, there are two spaces, with more to be added at the lower levels closer to the windowing subsystem (in our case, Wayland).
Java 2D abstracts away the real device coordinate space. All coordinates passed by the client application to Graphics are considered to be in the so-called ”user space”, which must be transformed at some point to the target device’s coordinate space, called the “device space”. The transformation function is yet another Graphics2D property with a default value, but it can be overridden as easily as the painting color with Graphics2D.setTransform().
Note: We don’t need to modify the program to experiment with this transformation function. By setting the sun.java2d.uiScale system property to anything other than the current monitor scale (say, 200%), we can make an existing application’s UI look larger (-Dsun.java2d.uiScale=3) or smaller (-Dsun.java2d.uiScale=1.4).
Thus, g.drawRect(x, y, 1, 1) will paint exactly one pixel only when the device’s scaling factor is 100% and is not overridden by anything in our program or by external factors. Even that guarantee holds only up to a point: The platform’s windowing subsystem may apply further transformations to the resulting image received from our Java program, either enlarging the image for a high-resolution display (likely resulting in blurry visuals) or shrinking it (for example, when an overview of all windows on a desktop is displayed when switching between them).
Wayland intro
Wayland provides several means of delivering window content from the client to the server and, eventually, to the screen. Here, we will concentrate on the most basic one that every Wayland implementation must support: shared memory buffers. But first, let’s look at an overview of the objects and protocols involved.
A window in Wayland is represented by an abstract entity called wl_surface. It has no properties of its own, not even a size. Rather, it serves as a convergence point for most window-related objects. What gives wl_surface its shape and visual image is another entity called a wl_buffer, which is attached to wl_surface through an attach request. Once a buffer gets attached to the window (and committed), the window displays that buffer’s pixels as a static image that does not change.
Wayland coordinate spaces
Wayland supports several ways to scale windows: An integer scale can be assigned to the surface’s buffer through set_buffer_scale, but the preferred way is the much more flexible wp_viewporter, which supports arbitrary transformations, including fractional scaling. The scaling operation is a simple affine transformation mapping one coordinate space to another. Most requests sent to Wayland and events received from Wayland (like mouse pointer movement) operate in the so-called “surface-local coordinate space”. Buffers that contain pixels to display live in their own coordinate space, and wp_viewporter (or buffer scaling) provides mapping between those spaces.
Earlier, we noted that there are two coordinate spaces in Java 2D. The one known as user space in Java 2D roughly corresponds to the surface-local coordinate space (the mapping is 1:1 as long as the system property sun.java2d.uiScale was not used). The device space is precisely the buffer coordinate space.
Buffers
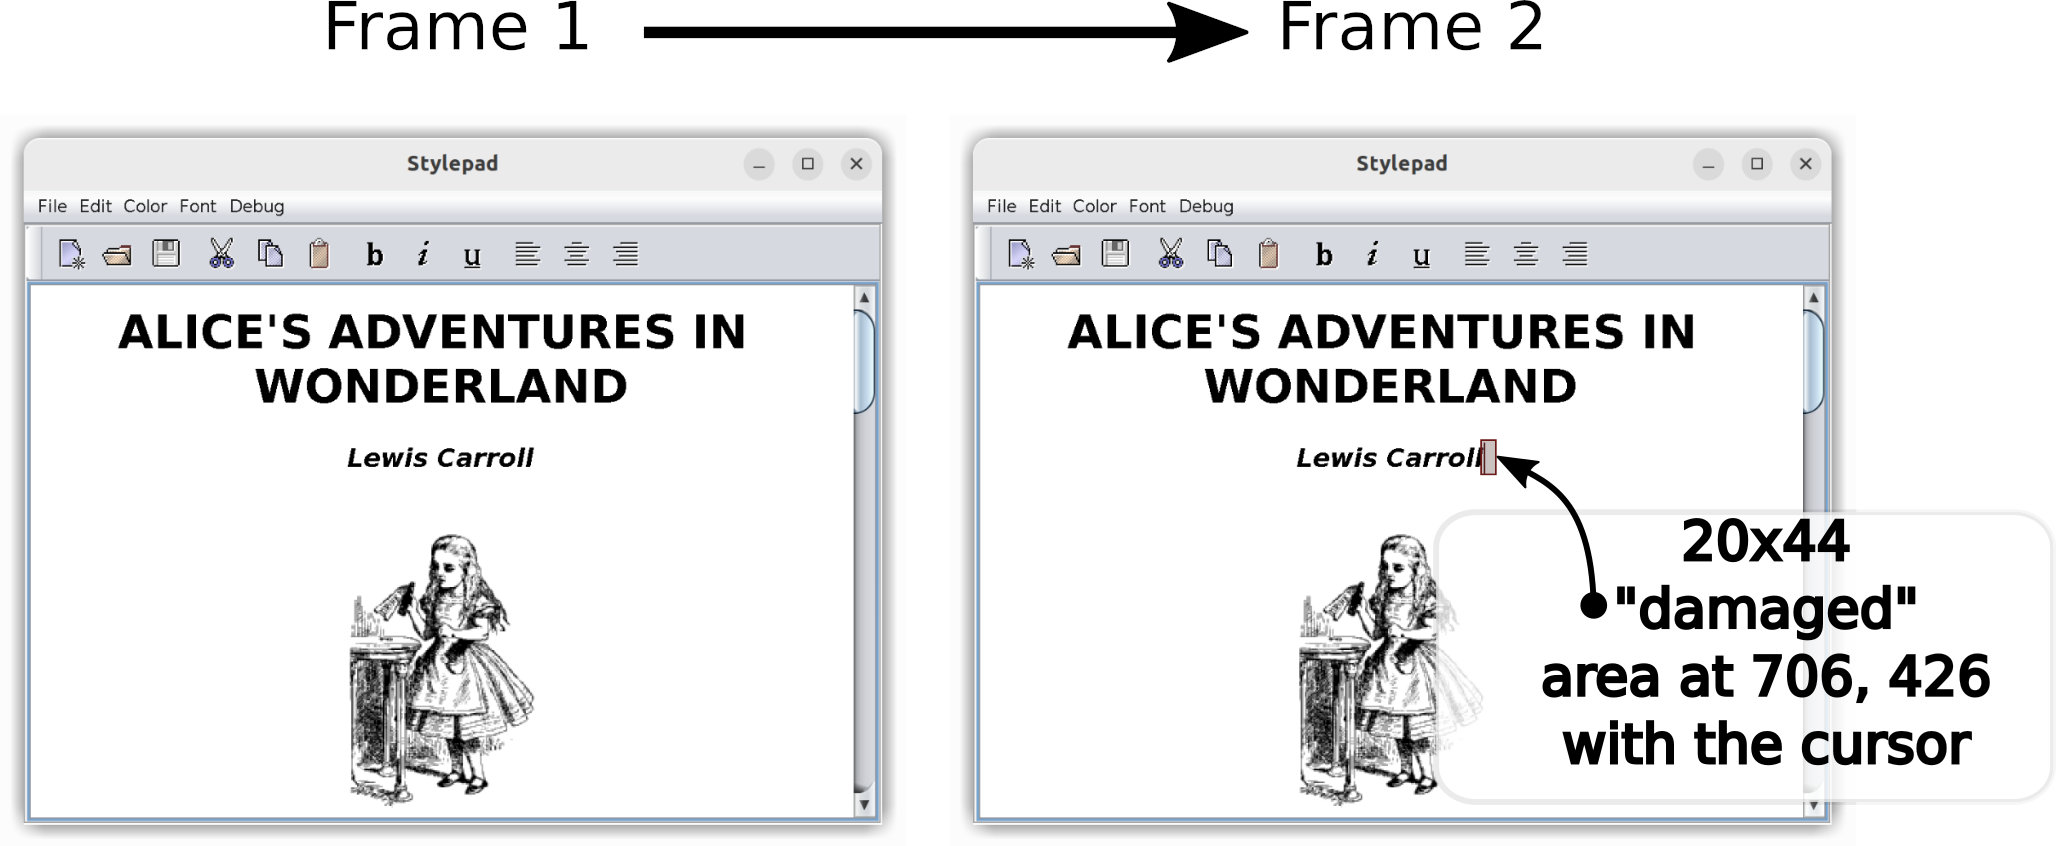
If a buffer cannot change once attached to the window, how can we implement a blinking cursor or scroll the text displayed in a window? The Wayland API provides a straightforward solution: attaching a different buffer that has a modified raster. Delivering the change will obviously involve a lot of memory copying, which can be rather slow. Moreover, it is often the case that only a small portion of the image has changed. So the API needs to accompany the pending buffer with a list of rectangular regions that differ from the previous one, thereby avoiding whole-window repaints and unnecessary memory copying. In Wayland terminology, the changed regions are called “damage”. Nevertheless, even though the damage may be quite limited, an entirely new buffer needs to be created and attached to wl_surface to deliver the change.
There are several wl_buffer implementations available today. JetBrains Runtime uses the POSIX shared memory object allocated through shm_open(3). This is basically a memory segment shared between the Java application and the Wayland server processes. A Java Swing or AWT application maps this segment into its address space and writes pixels to that segment, and the Wayland server subsequently maps the same segment to its own address space, reads the pixels, and displays them on the screen. The server then “returns” the buffer to the client, at which point the client is free to repaint it and resubmit it.
At first, it may seem that having just one such shared memory buffer would be enough. Sure, we will have to block the painting operations until the buffer is returned, but that may be acceptable, and in some cases, even preferred. After all, if we have to postpone the next frame because the server wasn’t ready to display a new one, we can already paint faster than the server can handle, so why waste CPU cycles trying to paint even faster?
However, this approach is not best suited to the Java model. In most cases, painting in Java is done on the same thread that handles all UI-related events. So if painting is blocked, keyboard input is blocked (including from typeahead), the mouse pointer is not tracked, and the entire application freezes and appears unresponsive. Furthermore, besides the more traditional model of reactive painting done by request of the system in a paint(Graphics) method, we can get a Graphics object from any Component and paint to that component on as many threads as we want, with no extra synchronization. Those threads would also block if we chose to have just one buffer and wait for it to be freed by the server.
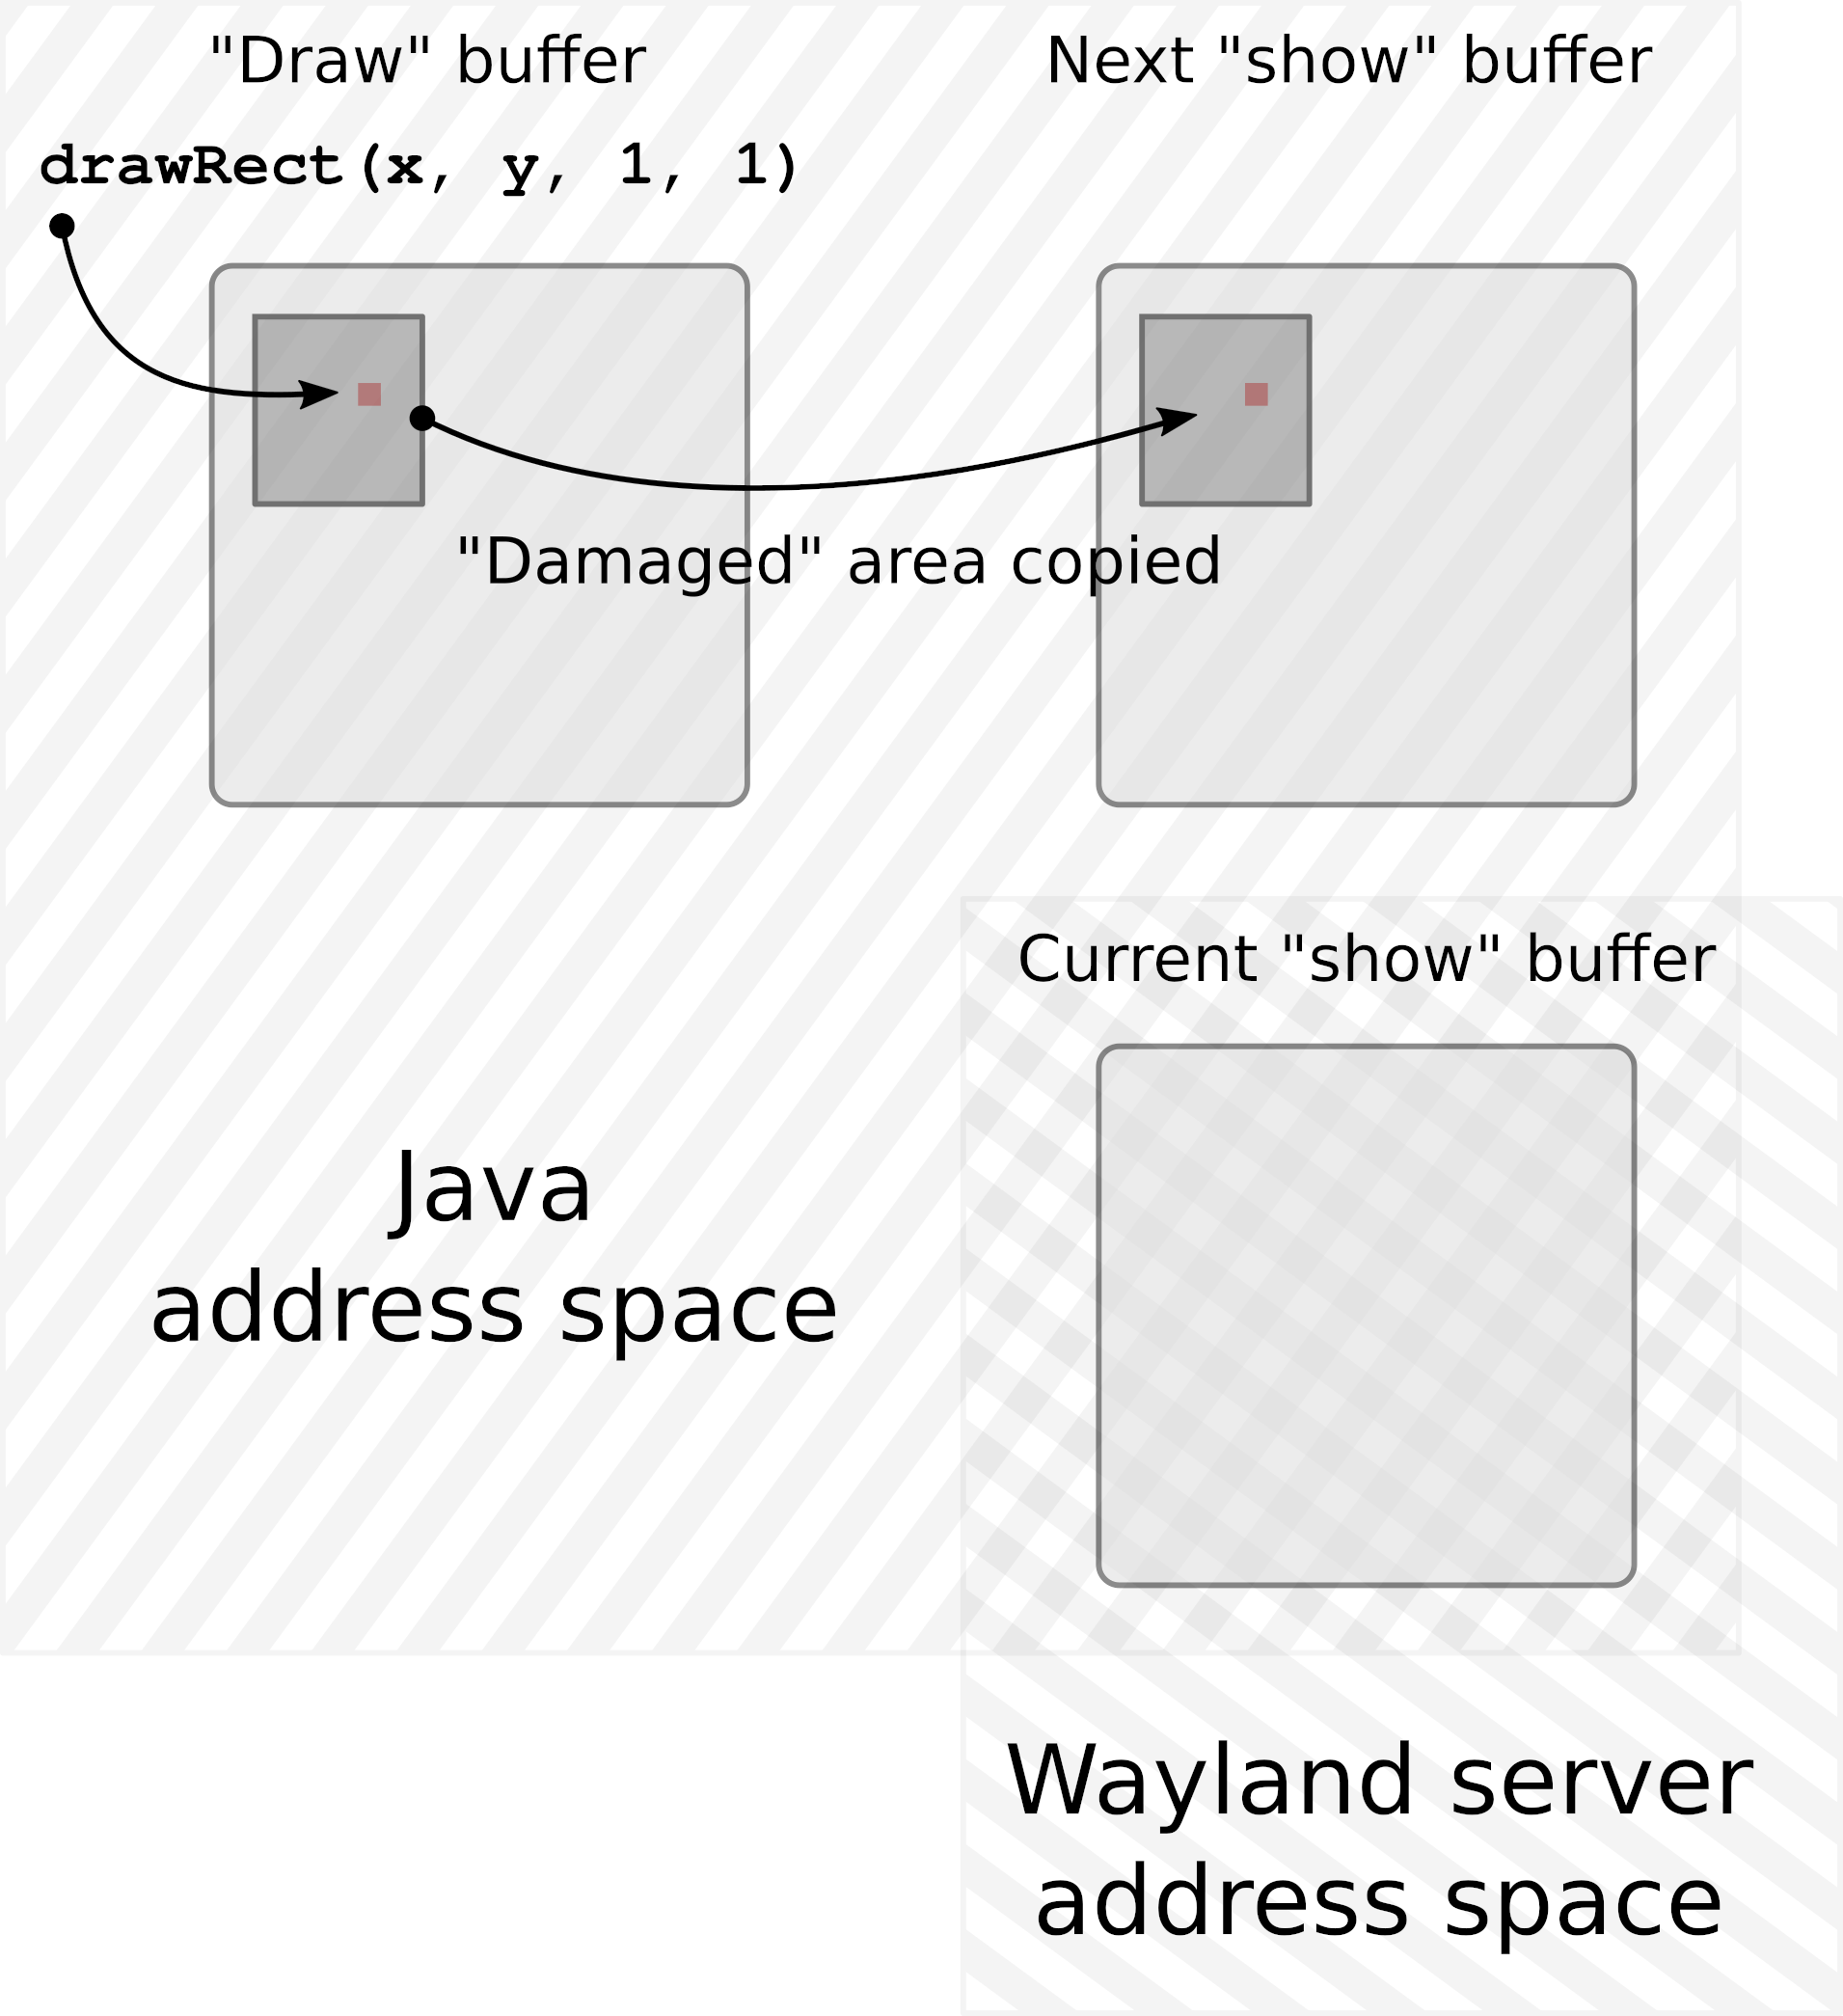
To accommodate the model outlined above, a dedicated “drawing” buffer is created for each window, and this buffer is the target of all painting operations done on the window. Once the new frame has finished painting, that buffer is copied over to another buffer of exactly the same size, called the “show” buffer. This “show” buffer is then shared with the Wayland server.
This way, painting operations do not need to synchronize with the rate at which Wayland can deliver updates to the screen. The “drawing” buffer accumulates the new picture for as long as needed with no extra blocking. That does not mean we can bombard the server with new frames every millisecond. If, by the time the new frame is ready, the “show” buffer is still in use by the server, we must either wait for it to be returned or simply skip this frame, hoping the buffer will be returned the next time we try.
At this point, there are two buffers per window: one that we occasionally share with Wayland and another that we paint to. This is almost always enough. There are, however, Wayland implementations (Weston is one example) that will not return the buffer shared with the server unless and until another buffer is shared, replacing the previous one. Therefore, to accommodate such a scenario, we must have not two, but three buffers per window.
Note: Having more than three buffers might theoretically help if we could generate new frames very quickly and the server could receive them at the same speed but struggle to return the buffers just as fast. However, in practice, increasing the buffer count beyond three has not resulted in an improved frame rate, suggesting this is mostly a hypothetical scenario.
Damage grouping
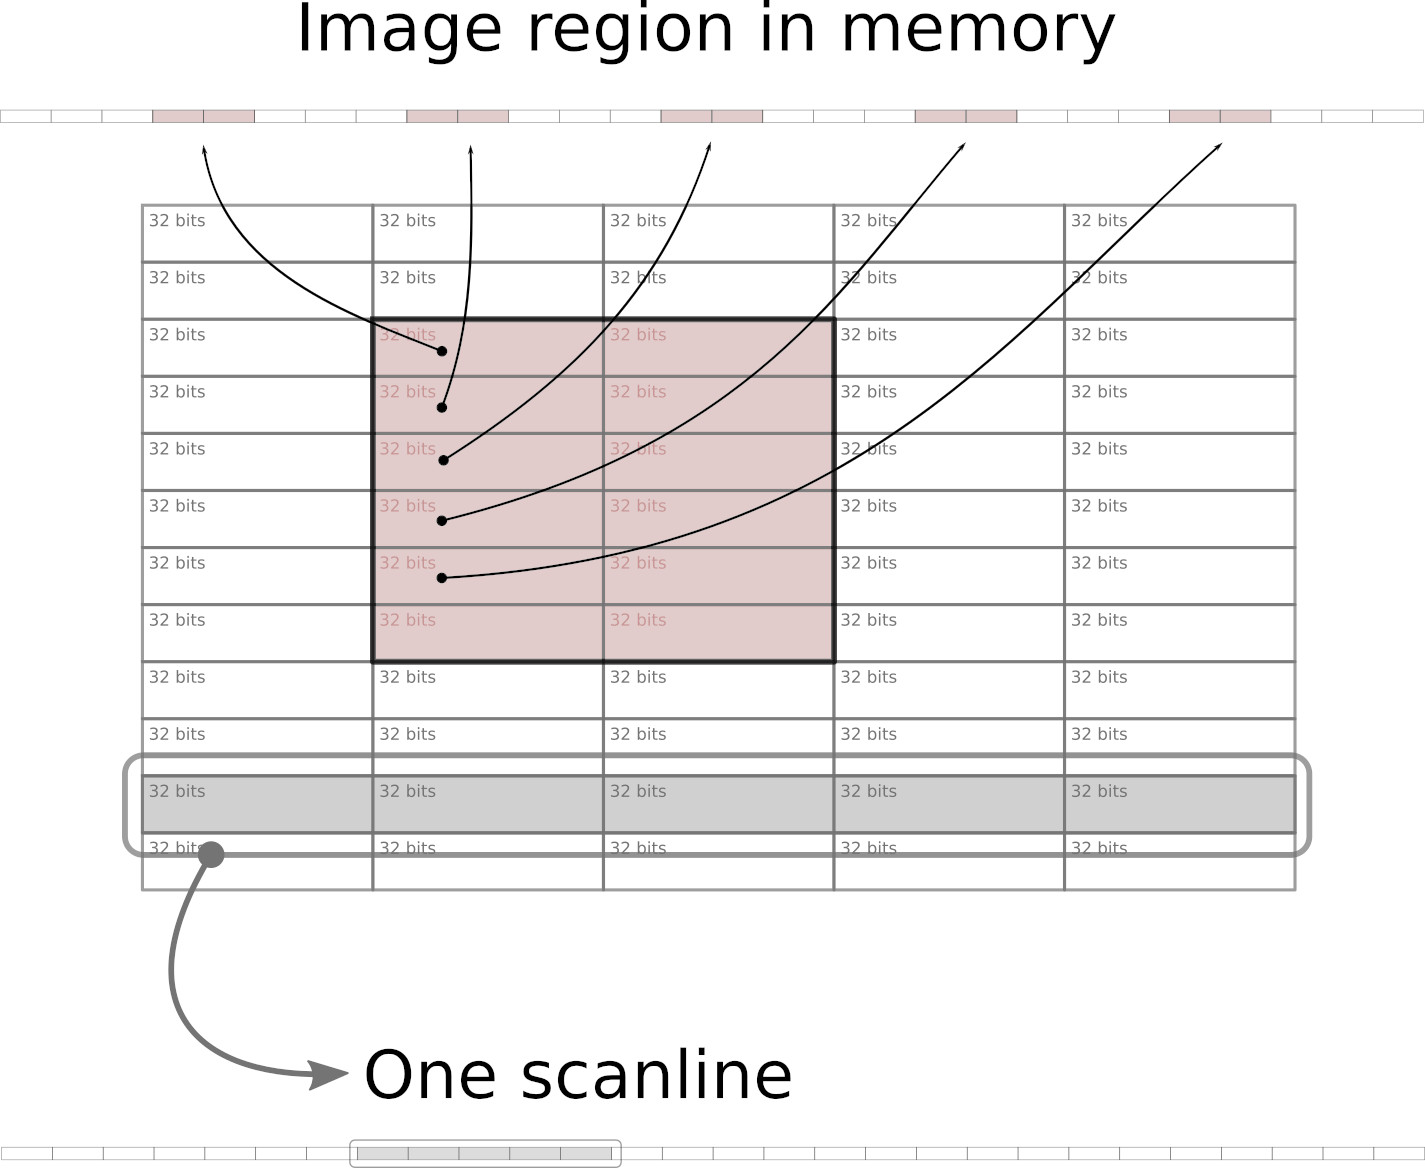
In memory buffers, images are stored as a sequential array of 32-bit integers starting from the topmost scanline (horizontal row of pixels), and proceeding from left to right. This means, among other things, that rectangular areas within an image that do not extend fully from left to right are not sequential in memory. Because of many caching techniques employed at various levels – from memory controllers and CPUs up to operating systems – copying a larger sequential chunk of memory can actually be done faster than copying several much smaller chunks that are located apart from each other in memory.
Earlier, we noticed that various renderers in the graphics pipeline, when painting a new frame to be delivered to the screen, may modify a large number of small adjacent regions. Additionally, when scrolling the file list in the IDE, a narrow vertical rectangle gets damaged, modifying a small portion of almost every scanline in the IDE window with changes located far apart in memory.
The damage grouping algorithm evaluates incoming changes and merges affected rectangles, sometimes deciding in favor of a much larger rectangle that consists of full scanlines. Copying such areas can reduce the overall time required for transferring image updates by a few milliseconds.
The end
And so the newly painted pixel – likely together with many more surrounding pixels – was written into the drawing buffer of the window. Once the painting was completed for the entire window, the updated regions were copied over to one of the available show buffers, and that buffer was then shared with the Wayland server. The damage list included the area occupied by the painted pixel, making sure the server knows what new information to show. The pixel is now halfway through its journey.
It started its life as a data structure describing its visual characteristics (location, size, color, transparency, color space, etc.), was transformed into a sequence of bytes, and then moved around quite a bit. Now it leaves the familiar address space of a Java process to be welcomed by the Wayland server, which will guide it through the desktop compositing to the graphics driver, and finally to the screen.
I was an active AI user from the moment ChatGPT was first released, and I really liked its UX. Chatting is a familiar activity – I chat with my family, friends, and coworkers every day – so the learning curve was almost non-existent. On top of that, engaging with chatbots was already familiar as well, since they have been a hallmark of customer support interactions since well before ChatGPT came onto the scene. Needless to say, AI became a part of my daily routine almost straight away.
However, I care a lot about the code I push – maybe too much. That’s why I never used AI for coding at work or in production. Searching for information, yes. A one-day pet project, for sure. But coding at work? Oh, no, “never”!
The release of Claude Code didn’t change much. While it was indeed better at coding, I was never a VIM user, so interacting with it was tediously inconvenient (a terminal-based TUI in 2025, really?!). I was only really able to use it for one-day projects.
To make the leap, I needed an AI tool that would let me smoothly switch between code exploration and agent results, as well as allow me to review and comment on those results without changing the app. This would save me time spent copy-pasting tons of text to find where changes were made. I also needed a smoother UX for editing prompts, as the only approach available at the time was writing endless Markdown documents for each ad-hoc task in a separate code-editing application. There had to be a better way.
Air
Full disclosure, I’m a developer with the Air team, so I started to use JetBrains’ agentic development environment from day one for the sake of dogfooding – long before the Air Public Preview began this March. As before, I only used it for pet projects initially. But this time, something was different: I wasn’t as frustrated when the agent failed to do something. I was able to read the agent’s output without exhaustion. I was able to fix small things quickly without switching applications and or needing to adjust to a new view. I could even use my mouse for text editing (wow!) and the shortcuts stored in my muscle memory from mass editor and chat apps.
I started to have the same feeling I had with ChatGPT – Air didn’t require me to learn anything new: All I had to do was chat, use known interaction patterns, and wait for the results. Neither the AI chat in every application since 2022, nor Cursor, nor terminal-based agents, nor GitHub or Telegram bots had ever given me that feeling before.
So, I started to use Air for work, beginning with small-scope tasks that I could quickly fix by hand if needed, working in parallel with IntelliJ IDEA. It noticeably affected my productivity; I was able to work on several tasks at the same time, switching between them during the day and delegating some work to the agents. Interacting with agents inside a familiar environment removed any potential friction I might have experienced if I had been working with them in the terminal. Inside Air, there was no feeling of exhaustion or disorientation – everything just came naturally.
After a while, I noticed that I only needed to use IntelliJ IDEA for specialized tasks like using a debugger if the agent wasn’t able to find a bug, or doing some non-trivial interactive rebasing. Air had everything else I could possibly need. I still find agents to be extremely bad at code design, architecture, and following project patterns, but I can quickly do those things myself in Air’s editor and ask the agent to finish the job.
Gemini
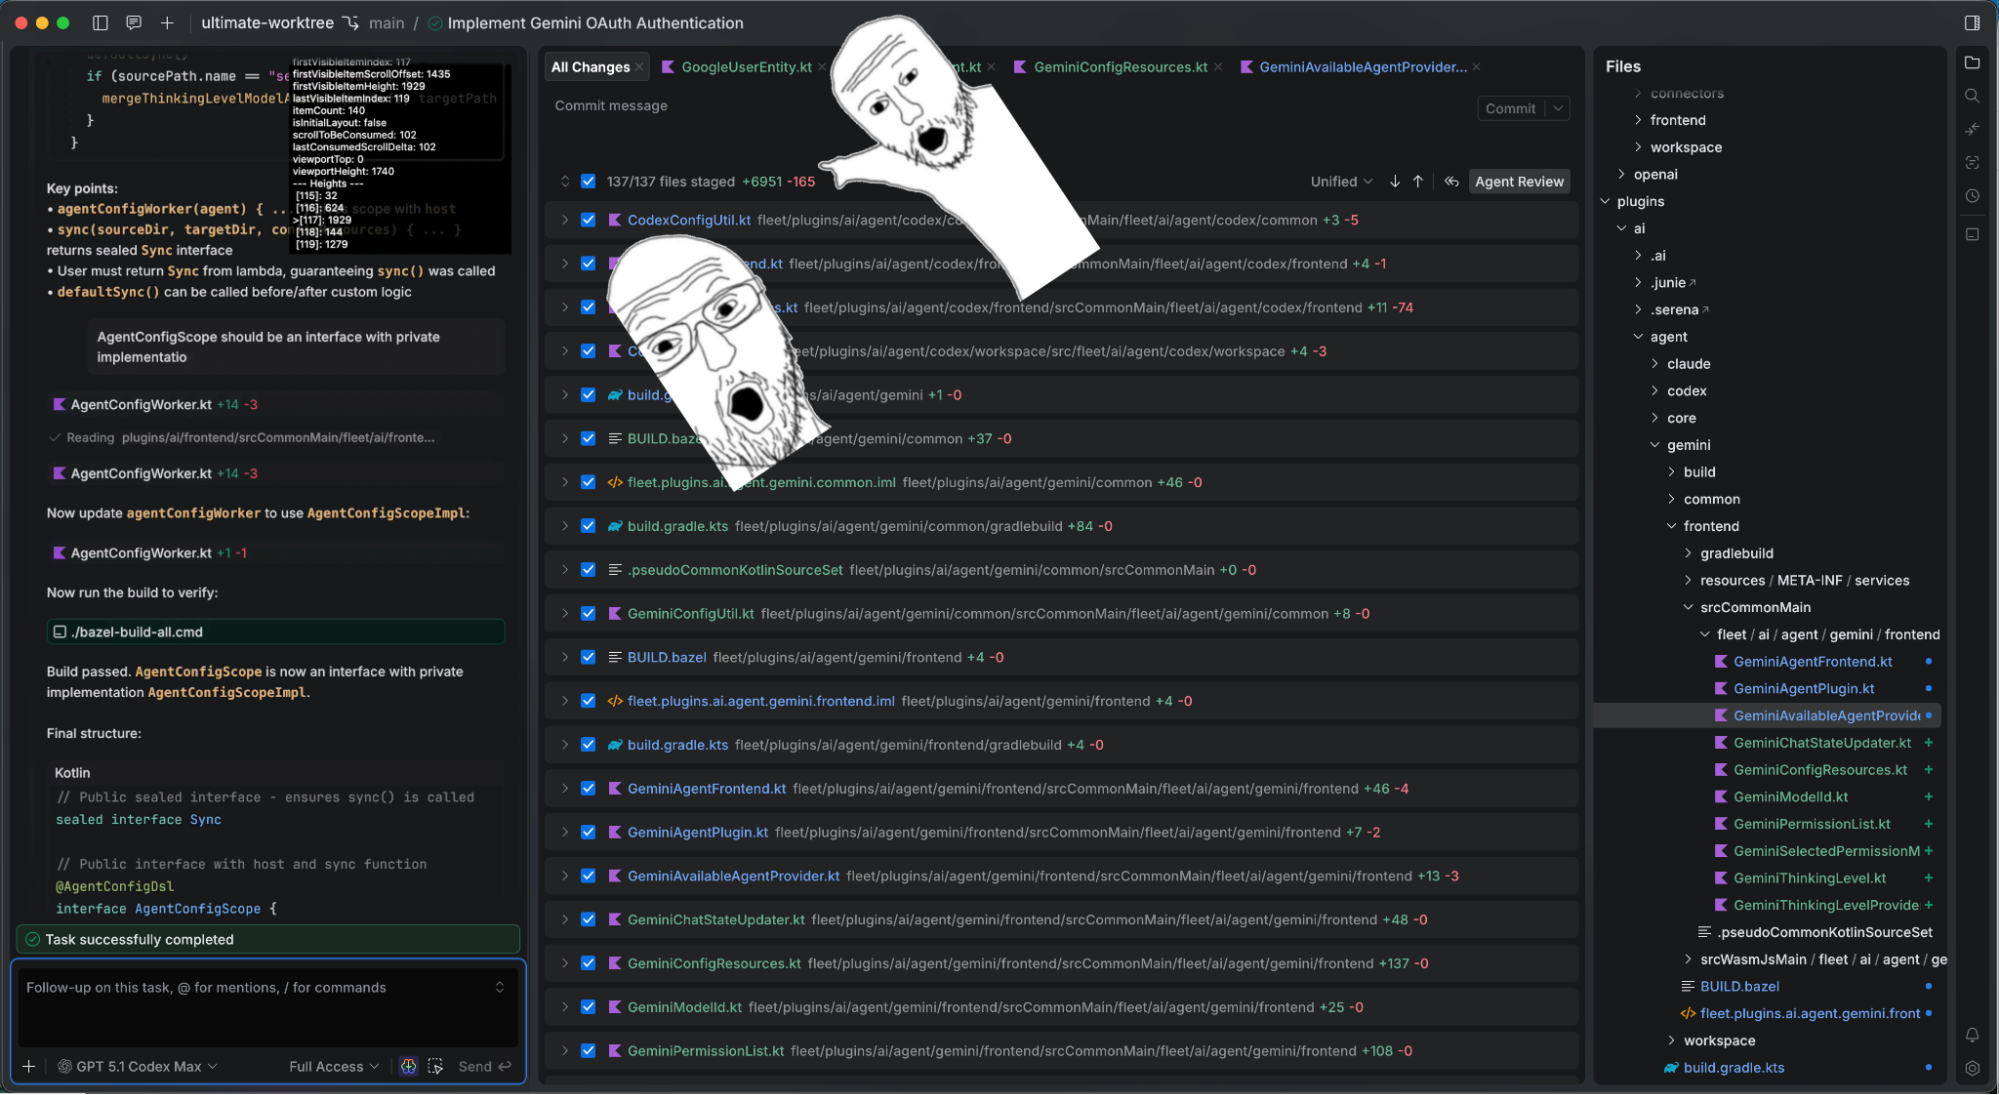
The final turning point was when I needed to implement a Gemini CLI for Air. We had already integrated Claude and Codex by then, and the time for the third agent had come. This sounded exactly like a task for an agent – do something similar to already existing code. No architecture design, no deep thinking – just follow an existing example. So I gave it a try.
It went much less smoothly than I expected. It took me several days, many code reviews, dozens of comments, and a 140-message-long chat exchange, but I ended up with a working, production-ready solution. This might sound like a lot of effort, but while the agent was coding, I was able to work on other things – fix smaller issues, answer Slack messages, and attend meetings.
In the end, Air completed the task much faster than I could have solo, and I didn’t need to use any other tools alongside it. No terminal, no IntelliJ IDEA, nothing. It was just like it used to be before the advent of AI fragmented developers’ workflows: I only needed a single tool once again, and in Air, I finally had it!
The next gamechanger
I can’t wait until we can bring Air to mobile devices, at least as a web app. This will fill the remote development hole that’s still present – prompting me to write a follow-up post while I make myself a coffee and leave the programming to my computer (or the cloud). Oh, what a brave new world we live in!
So, it turned out that I needed to experience AI in an environment I already felt well at home in before I could fully appreciate its benefit. Anyway, thank you for reading this to the end. Now go try Air – it’s free to download and the best way to see what I mean for yourself.