We ran the same coding tasks with and without prebundled tooling, across multiple models and languages. Here’s what changed.
Eval-driven development
IDE-native search reduced latency, cost, and budget overruns.
The comparison below uses paired task-level deltas. Aggregate medians and totals are shown for orientation. Budget overruns are tasks that exceeded the USD 0.50 per-task cap.
8.33% Median latency reduced 83.11s → 79.03s
16.44% P95 latency reduced 268.71s → 213.17s
5.60% Total cost reduced USD 44.17 → USD 41.67
33.28% Budget overruns reduced 6.67% → 4.44%
Why We Built This
When coding agents search code, they default to shell tools. grep and find work, but they’re blind to project structure, symbol boundaries, and language semantics. The agent burns tokens sifting through noisy output and making follow-up calls to narrow things down.
So we tried something obvious: what if the agent could use the IDE’s own search instead?
We built a prebundled skill that pairs a search prompt with a unified MCP tool. One tool, four modes: file search, text search, regex, and symbol lookup. A universal router dispatches calls to the right backend.
MCP Tools
Functions the agent calls via an MCP server during task execution. IDE-native tools can tap into indices, ASTs, and project models that shell tools cannot see.
Skills
Packaged agent behaviors: a prompt plus orchestration logic. A skill can work on its own, use tools, or ship bundled with the tools it needs.
Nothing ships by default until the eval says it should. We tested four different configurations of this tooling before picking one.
Methodology
The eval pipeline spins up an MCP server alongside the IDE so the agent has access to the configured tools and skills. We run identical coding tasks with and without tooling, then compare with paired delta analysis.
We track four things: quality, latency, cost, and budget discipline. Quality asks whether all tests passed. Latency tracks median and P95 task time. Cost converts token consumption into dollars. Budget discipline tracks how often a single task exceeds the USD 0.50 budget cap.
We report improvement deltas only when they pass our significance threshold: p < 0.05, paired test with 95% confidence intervals. Metrics without a significant change are either omitted from the charts or called out explicitly. We tried four configuration variants, selected the one with the best latency and cost tradeoff, then re-ran it on different models and languages to check that the results held.
Eval frame
Same tasks, same grading, one controlled difference.
Quality All-tests-passed rate, checked before performance claims.
Latency Median and P95 task duration, compared with paired deltas.
Cost Token use converted to dollars across the task set.
Budget discipline Share of tasks exceeding the USD 0.50 single-task cap.
Results
The selected configuration was a prebundled search skill plus a unified IDE-native tool and universal router. Compared with the no-tooling baseline, it reduced latency and cost without producing a statistically significant quality change.
Baseline vs. tooling
Absolute metrics moved in the right direction.
Median latency
Baseline83.11s
With tooling79.03s
P95 latency
Baseline268.71s
With tooling213.17s
Total cost
BaselineUSD 44.17
With toolingUSD 41.67
Budget overruns
Baseline6.67%
With tooling4.44%
Budget overruns
33.28%
P95 latency
16.44%
Median latency
8.33%
Total cost
5.60%
No statistically significant change in quality. All shown deltas passed the significance threshold.
Trace snapshots
The difference is visible in the agent’s path through the project.
These are shortened traces from cases that improved in both time and cost. The baseline spends more steps discovering context; the prebundled setup gets to the relevant files faster.
Service comments and replies
prompt Update service and controller layers for comments and replies.
before: no prebundled IDE search agent> list files -> search x2 -> list files x2 agent> jar inspect x5 -> javap -> jar inspect -> javap x5 agent> curl download -> decompile -> search -> find files x2 agent> read 9 files -> edit file x8 -> respond time: 472s
We tested four tool configurations before choosing the final shape. Lower latency and lower total cost are better, so the lower-left corner of the plot is the target.
Configuration search
The selected option had the best latency while preserving cost reduction.
Median latency, 78s to 84s Total cost, USD 39.50 to USD 45.00
We re-ran the experiment with GPT 5.4 on Java and Kotlin codebases. The pattern holds: latency and cost both drop. Kotlin saw the biggest cost improvement, with total cost falling 13.48%.
Cross-model check
The effect held beyond the original run.
Codex 5.2
Median latency8.33%
Total cost5.60%
P95 latency16.44%
GPT 5.4, Java
Median latency3.75%
Total cost4.07%
P95 latency13.00%
GPT 5.4, Kotlin
Median latency6.92%
Total cost13.48%
P95 latencynot significant
Missing bars mean that metric was not statistically significant for that model and language.
How Models Adopt Tooling
Codex sends 91% of its search calls through the new IDE-native tool. Claude is a different story: Opus uses it for about half its searches, and Haiku only 28%, preferring grep and find instead.
This makes sense. Claude already has strong built-in code search, so it leans on what it knows. Codex doesn’t, so it grabs the better tool when one is available. The takeaway: prebundled tooling fills gaps. Where the model already has good search, it adds less. Where search is weak, it makes a real difference.
Tool adoption
Models do not use new tools at the same rate.
Codex
91 8 1
Claude Opus
53 28 19
Claude Haiku
28 33 39
IDE Search grep find
What’s Next
The eval pipeline works. Now we’re using it.
We’re running the same experiment on smaller models next. Our hunch is that they’ll benefit even more, since they have less built-in search capability to fall back on.
The current results are strongest on Java and Kotlin. We’re expanding to Python, .NET, and TypeScript with bigger sample sizes.
Meanwhile, the winning configuration is being prepared for the integrated IntelliJ IDEA MCP Server, so agent sessions can use IDE-native tooling when the server is enabled.
The next step is to turn this feature on by default in upcoming AI Assistant plugin updates.
Want to try it before the default rollout?
Set these registry keys to true: llm.chat.agent.codex.mcp.idea, llm.chat.agent.skills.settings.enabled, and llm.agents.contrib.bundled.skills.sync.enabled.
In AI Assistant, choose Codex for the best results.
Ask the agent to find something across the current project.
Put a capable coding model inside a developer’s primary workspace, and the IDE stops being a place where you write code. It becomes a place where you direct an agent, watch how it reasons, manage what it pays attention to, and decide when its output is worth shipping. That was the defining theme of the inaugural JetBrains x Codex Hackathon: across roughly 40 submissions over a single weekend, teams explored what it actually means to build with AI natively inside the IDE – not bolted on top of it. The six finalists came up with some of the most compelling answers.
🥇 First Place: hyperreasoning – Aditya Mangalampalli
Most coding agents call the model once and hope for the best. As Aditya puts it: “LLMs spend a lot of time thinking in circles.” Hyperreasoning replaces the single shot with something closer to a search: the system drafts several possible approaches to a task, then a learned controller decides which to expand, which to cut, and which to verify against tests. Compiler errors and failing tests feed back into how the controller weighs its options.
Inside the IDE, a tool window renders the search live, so you can watch which paths the controller explored before settling on one. The argument the project makes is that a smaller local model wrapped in this kind of verified search loop can hold its own against much larger frontier models at meaningfully lower cost — with the IDE serving as the place where reasoning becomes visible and directable, rather than a black box that returns code.
🥈 Second Place: Scopecreep – Bhavik Sheoran, Kenneth Ross, Roman Javadyan, Joon Im
Hardware bring-up is a tool-juggling exercise: schematic viewer in one window, vendor apps for the oscilloscope and power supply in others, a terminal talking to the device, a spreadsheet collecting results. Scopecreep collapses that into a single JetBrains tool window. Hand it a circuit schematic and an agent works through testing the board – picking signals worth measuring, capturing the readings, and producing a report.
The design choice worth noticing: when the agent decides a probe needs to be placed, the session pauses and shows the engineer exactly where to put it. The engineer places the probe physically and clicks Resume. It’s the right call for real instruments on a real bench – autonomous, where a computer can be trusted, human-in-the-loop, where the work touches the physical world.
🥉 Third Place: mesh-code – Ayush Ojha, Coco Cao, Kush Ise, AL DRAM
Switch machines mid-task, and your coding agent starts over. mesh-code fixes that by giving agents shared memory of an in-progress project – what’s been tried, what’s been decided, what’s still pending – so a session that begins on one laptop can continue from another, with whichever agent happens to be available. Codex is one of the agents that can plug in.
Latent Signal – Periscope
Long agent sessions accumulate dead weight: tool outputs nobody needs anymore, dead ends, context that was useful ten turns ago and isn’t now. Periscope, built on Wes McKinney’s open-source agentsview, is a JetBrains plugin that shows what’s actually filling up an agent’s working memory turn by turn – and recommends what to do about it, whether that’s continuing, rewinding to a better branching point, compacting, forking, or handing off entirely. It works with Codex and most other coding agents, and everything stays local.
SecureLoop – Abhiram Sribhashyam, Rahul Marri, Peyton Li
Security incident response is still mostly copy-paste: stack trace into a chat window, repo context explained by hand, a fix written and committed in the hope it’s safe. SecureLoop turns that into a controlled loop inside JetBrains. When something breaks in production, the agent gathers the relevant code, the project’s security rules, and the state of its dependencies, then asks Codex for a structured diagnosis and a proposed fix. That fix runs through automated checks before any pull request opens.
The PR opens automatically. The merge does not. SecureLoop surfaces everything that informed the decision – the diff, the policy it bumped into, the test that proved the patch – inside the IDE for the developer to approve or reject. As the team put it: “Codex fully makes the PR ready for you, and it remains human-in-the-loop where you have to approve or deny.”
The team’s bigger thesis is a security-policy.md file that lives in the repo alongside README.md, spelling out a project’s specific rules for handling secrets, errors, and risky patterns. Coding agents read it before suggesting changes, so the question stops being “what’s a good fix?” and becomes “what’s an acceptable fix under this codebase’s rules?”
Pinpoint – Het Patel
Frontend feedback delivered through a chat window is unavoidably vague. “Move that element” or “change that color” leaves the agent guessing which element you actually mean. Pinpoint takes that piece of the ambiguity off the table: developers drop pins directly on a live page, attach a comment to each, and send the whole batch to the agent with precise on-page context attached. The agent now knows exactly which element you meant – even if it still has to figure out what change you want.
The project ships in two pieces: one for annotating web pages in a browser, and a desktop companion for marking up anything visible on screen – useful when the interface in question isn’t a web page.
What the finalists show
Looking across these six projects, a clear pattern emerges. Codex embedded in the IDE isn’t just a faster way to write code – it’s a reasoning layer you can watch think, a structured output engine you can direct, a participant in workflows that span hardware instruments, production alerts, shared session state, and context windows. And the IDE becomes the place where all of that comes together: visible, controllable, and version-controlled.
That’s the possibility these teams spent a weekend proving out, and it’s only the beginning.
Hi everyone! April brought exciting community news with the announcement of the Golden Kodee finalists, along with Kotlin and tooling releases, multiplatform progress, and fresh backend resources. I also came across the new Kotlin Professional Certificate on LinkedIn Learning, which is a great way to build your skills. And if you want something more playful, I found a fun way to practice coroutines. Here are the stories that stood out to me most.
Kodee-Approved Spotlight
KotlinConf 2026 is almost here
KotlinConf 2026 is just around the corner, and the excitement is definitely building. On May 20–22, more than 2,000 Kotlin developers from around the world will gather in Munich to share ideas, learn from each other, and connect. If you cannot make it in person, you can still join online – the conference will be livestreamed on the Kotlin YouTube channel. I’ll be there in Munich, but I definitely recommend tuning in to catch the key announcements and talks as they happen.
Join KotlinConf
Golden Kodee finalists
The Golden Kodee finalists have been announced! The top three nominees in each category will be invited to KotlinConf in Munich, where one winner in each category will receive a Golden Kodee award. It is a great way to celebrate people who share knowledge, organize events, inspire others, and help grow the Kotlin community.
Meet the finalists
Kotlin release updates
April brought two Kotlin release updates. Kotlin 2.4.0-Beta2 offers an early look at what’s coming next across the language, the standard library, the JVM, Kotlin/Native, and the compiler. Kotlin 2.3.21 focuses on performance improvements and bug fixes for the 2.3 release.
See what’s new in Kotlin 2.4.0-Beta2
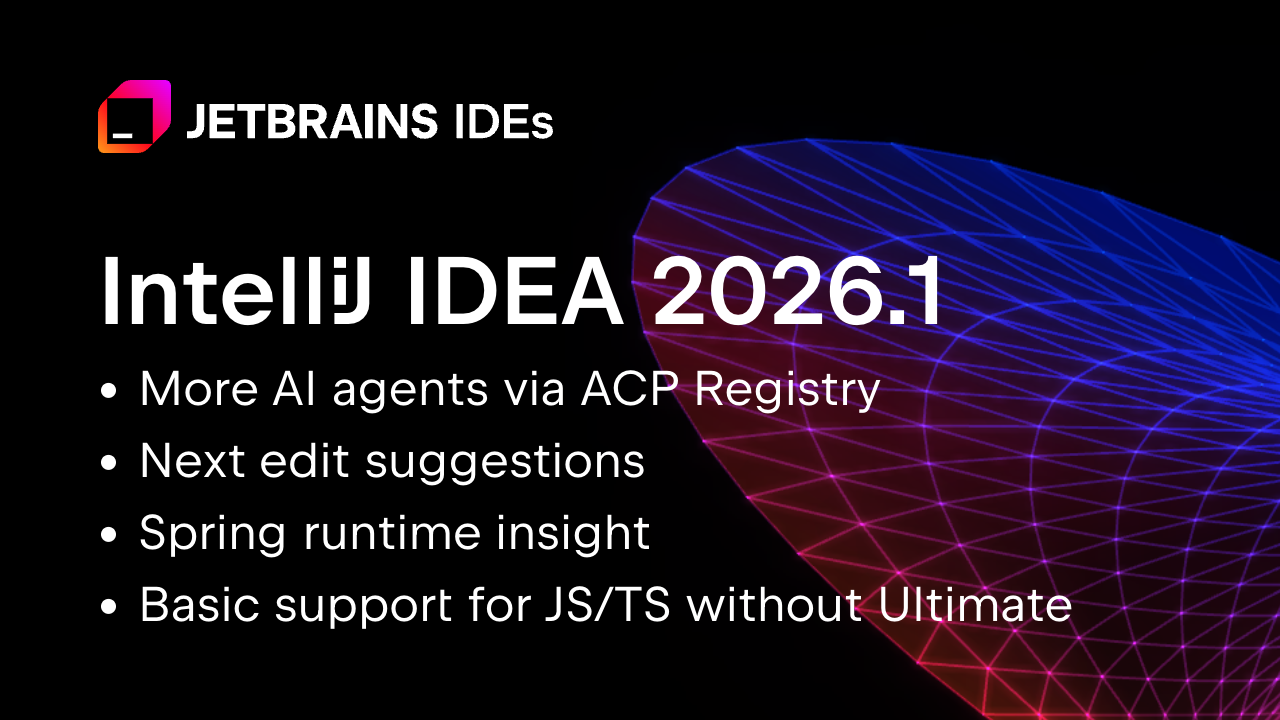
IntelliJ IDEA 2026.1
IntelliJ IDEA 2026.1 brings improvements that many Kotlin developers will notice in their daily work. From general performance enhancements to better language and framework support, this release is a strong ecosystem update and an important part of the Kotlin developer experience.
Explore the release
Helping Decision-Makers Say Yes to Kotlin Multiplatform (KMP)
Adopting Kotlin Multiplatform is easier when the business value is clear. I found this guest post from Touchlab useful because it explains how KMP can improve delivery speed, reduce risk, and support long-term product strategy.
Read the post
KotlinConf’26 Speakers: In Conversation With Lena Reinhard
Ahead of KotlinConf’26, I found this interview with Lena Reinhard interesting because it explores what it means to build a career in tech today, especially when old promises no longer feel certain. It covers leadership, uncertainty, the productivity debate in the age of AI, and the human side of our industry.
Read the interview
Kotlin Professional Certificate by JetBrains on LinkedIn Learning
Looking to build your Kotlin skills? The Kotlin Professional Certificate by JetBrains is now available on LinkedIn Learning. In less than 12 hours, you can go through four courses, pass the final exam, and earn a certificate you can share on your LinkedIn profile.
Start learning
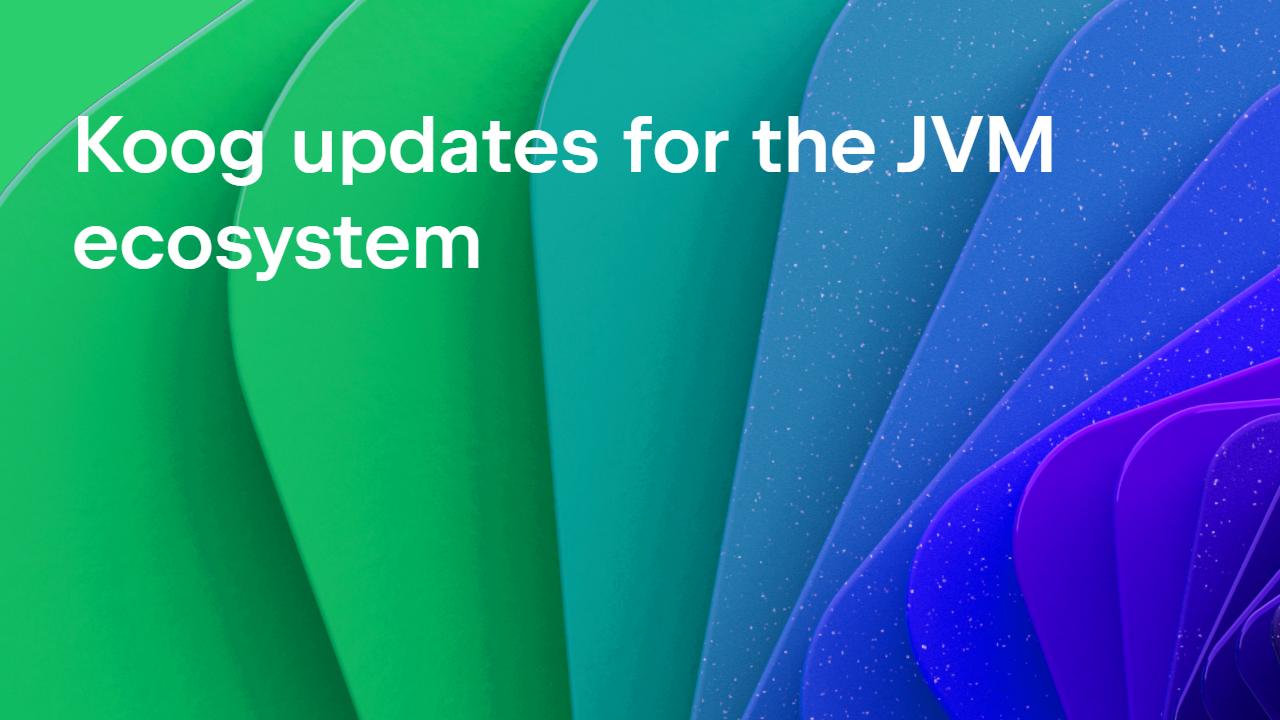
Koog updates for the JVM ecosystem
Koog had a busy month, and I found these two updates useful for JVM developers. First, Koog now offers an idiomatic Java API, making it easier for Java teams to build agent workflows. Second, Koog integrates with Spring AI, helping Kotlin and Spring-based projects use Koog in a familiar setup.
Explore Koog’s Java API
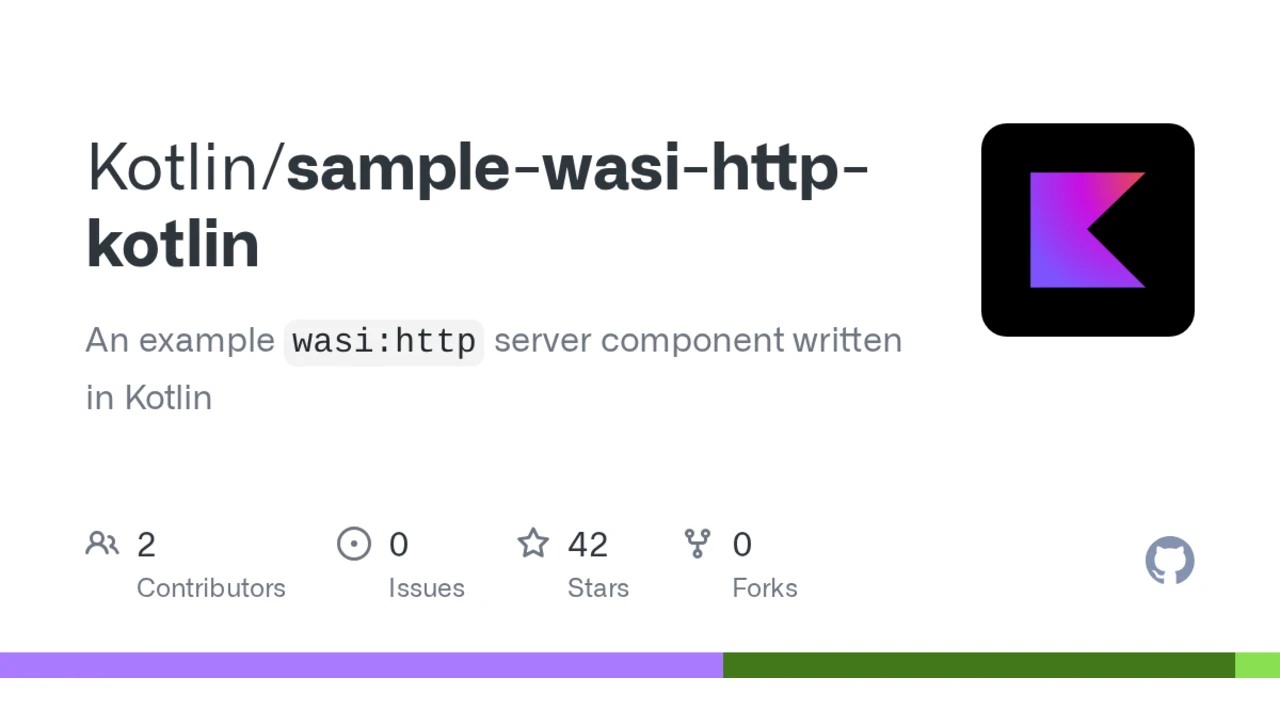
Kotlin + WebAssembly: `wasi:http` sample
I like this sample because it shows how to run a minimal HTTP server with Kotlin and WebAssembly using `wasi:http`. It highlights practical progress in Kotlin’s WebAssembly story and future backend possibilities.
See the sample
Amper 0.10.0
Amper keeps evolving quickly, and this update brings several useful improvements. Version 0.10.0 introduces automatic JDK provisioning, a Maven-to-Amper converter, support for custom Kotlin compiler plugins, and an improved IDE experience.
See what’s new in Amper 0.10.0
Spring Data JPA with Kotlin
I found this practical post worthwhile because it shows how Spring Data JPA works with Kotlin across entities, repositories, custom queries, and DTOs. It is useful for teams already using Spring.
Read the post
Spring guide: Uploading Files
This guide is helpful if you want to compare Kotlin and Java side by side. It makes it easier to see how Kotlin fits into existing backend workflows.
View the guide
Coroutines Guesser Game
Created by kt.academy, Coroutines Races Guesser Game offers an interactive approach to learning coroutine behavior by predicting what happens and when. It is a fun way to test your intuition.
Play the game
Where you can learn more
Workshops – KotlinConf 2026, May 20–22, Munich
Introducing the Skill Manager and Skill Repository
Give AI Something Worth Amplifying: Three Priorities for Technical Leaders
Using ACP + Deep Agents to Demystify Modern Software Engineering
Prototype LLM calls on the JVM using Kotlin Notebook and LangChain4j in IntelliJ IDEA
Next-Level Observability with OpenTelemetry
Exposed now supports array types out of the box for PostgreSQL
If you’ve been connected to the internet for a while, you’ve surely heard of AI Agent Skills. They teach your agent to do this and that. You might have even used or written a couple of them yourself.
If you aren’t yet familiar with them, the idea is simple: Instead of prompting instructions for a specific task each time, you define them once and reuse them later. A Skill is an AI equivalent of a knowledge base article: a plain text document that lives in a discoverable location and describes steps, a set of conventions, or domain-specific knowledge.
Most Skills you see in the wild are for simple things like enforcing code style or commit message conventions. But they can be much more powerful than that. In this article, we’ll combine AI Skills, good old developer tools, and a bit of creative thinking to address a notoriously challenging task: making AI deterministically find the root cause of flaky tests.
The problem
Quoting the TeamCity CI/CD guide:
Flaky tests are defined as tests that return both passes and failures despite no changes to the code or the test itself.
Flakiness undermines the whole point of tests: When a test fails, you can’t tell whether something is actually broken. You can’t fully rely on the test results, and at the same time, you can’t ignore them. This wastes both human and infrastructure resources.
And as if the underlying bugs weren’t difficult enough on their own, flaky tests often have this property of failing once in several thousand runs, making them extremely hard to reproduce and debug.
Example project
For the example project, let’s take the webshop demo from this article: Your Programs Are Not Single-Threaded. It is a Spring Boot project, in which one of the services has a TOCTOU (time-of-check to time-of-use) problem: It checks a condition and then acts on it, but another thread can change the state in between. In this particular case, it may sometimes cause duplicate invoice numbers and also makes the corresponding test flaky.
The test creates two orders concurrently and checks that the resulting invoices get numbers INV-00001 and INV-00002. Because of a bug in InvoiceService, it can either pass or fail randomly.
Note: If you’re using IntelliJ IDEA, you can test whether a test is actually flaky by using the Run until failure option in the test runner. Leave the suspect spinning for some time and see if it eventually fails.
If we knew nothing about the underlying bug, and only had the test, is there a tool that could help us find the root cause? Or can we make one ourselves? Furthermore, could we delegate both building and using the tool to AI?
The intuition
Let’s come up with some intuition for this class of problem.
To produce two kinds of results, the execution must follow different code paths. The difference might be minimal, possibly just one extra method call or one if branch taken instead of another. But it has to be there; otherwise, the result would be consistent. So, if we could record the code path for a passing run and a failing run and then compare them, the diff should at least point us in the right direction. And ideally, by following the call tree, we could find the place where execution splits. This line must be exactly where the flakiness originates.
Does this reasoning make sense? Let’s put it to the test.
Build the tools
What tool can we use for recording code paths? While not designed specifically for tracing, a test coverage tool can give us the information we’re after.
There are a couple of Java coverage tools to choose from, such as JaCoCo and IntelliJ IDEA’s coverage tool. We’ll go with IntelliJ IDEA’s, because it includes a hit counting feature that is very useful. We may need this extra granularity because the flakiness might stem not only from what is executed, but also how many times.
Run coverage from the command line
IntelliJ IDEA’s coverage tool has a familiar UI, but we need a way to launch it programmatically. Fortunately, coverage can also be collected from the command line by attaching the coverage agent to the JVM via Maven Surefire:
The -Didea.coverage.calculate.hits=true flag tells the agent to record invocation counts per line rather than just a boolean hit/not-hit mask. After the test finishes, the results are written to a binary .ic file.
So far so good, but we need the report in a human (and AI)-readable format.
Add text output
Luckily, the IntelliJ coverage agent is open-source. Let’s clone the project and ask AI to add a text reporter that converts binary reports to plain text.
The agent creates a new class called TextCoverageStatistics. After we build the project and run the reporter against our .ic file, we get something like this:
The first part of the report gives a high-level overview: How many lines, branches, and methods were covered across the entire project. Below that, there’s a per-class breakdown showing the same metrics for each class individually.
Then it is followed by per-line hit counts for each class:
For every line that the coverage agent instrumented, we see how many times it was executed and whether any branches were taken. The actual report is longer, but you get the idea. Now we have a text representation of which lines were executed, and exactly how many times.
This is the raw material we need for the diff. So far, so good!
Diff the reports
Supposedly, the obtained reports contain the necessary information, and a very determined developer could peruse them and find the bug. But we’re not here for mundane tasks like that, right?
Let’s upgrade the tool so that it gets multiple report variations and presents the diff. The most controllable way would be to do one “brick” at a time, but I think we’re safe to delegate the entire thing to AI here, including the automation:
The resulting script runs the test in a loop until both of the following happen:
We get at least one passing and one failing run.
The specified number of runs have passed.
Both conditions are important because test failures can be very rare, and the specified number of runs might not be enough. At the same time, there can be finer grained variations within pass and fail runs, so we might want to catch those too.
After the reports are collected, the script summarizes the lines that have variations between the runs. Here’s what it looks like:
All variations have the same pattern: the difference is not which lines were executed, but how many times. As we expected, the hit counting feature of IntelliJ IDEA’s coverage agent proved useful!
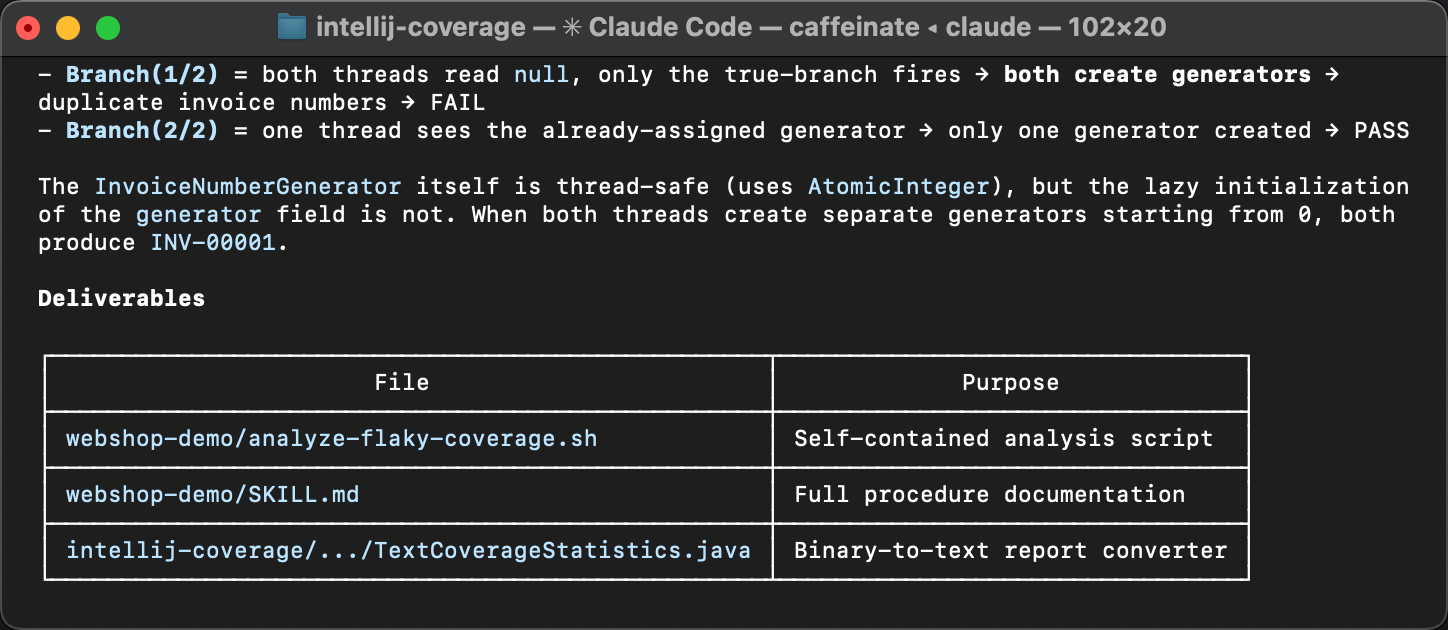
The varying lines point at a lazy initialization block in InvoiceService and its downstream effects in InvoiceNumberGenerator and Invoice. The variation in hit counts means that the initialization sometimes runs more than once, which shouldn’t happen. That’s exactly where the flakiness comes from.
If you missed the article that describes the problem, here’s why double initialization causes this bug. The createGenerator() method queries the database for the last used invoice number and creates a counter starting from that value. When two threads both enter the if (generator == null) block before either finishes, each reads the same number from the database and creates its own generator starting from the same value. The result is duplicate invoice numbers.
The coverage diff has pointed us at the very same TOCTOU race discussed in more detail in the previous article. But, what is novel in our current approach is that it doesn’t solely rely on human expertise and is easily accessible for AI.
Turning it into a Skill
Now, I’d say that AI-assisted modifications to open-source tools that help you solve the task at hand, all within minutes, are amazing on their own. But let’s keep our eyes on the bigger picture.
Here’s what we’ve done so far: We started with an intuition: Flaky tests take different code paths, and coverage analysis can reveal where they diverge. Then we turned that intuition into a concrete, repeatable procedure. Does this warrant a knowledge base article, or an AI Agent Skill, perhaps? Yes!
In the same agent session, let’s ask the agent to:
Make sure all the scripts are self-contained and runnable.
Document the entire procedure in a SKILL.md file, step by step, so that another agent can follow it without any prior context.
The agent packages everything and writes a guide that describes when to apply the Skill, what tools are needed, and what steps to follow.
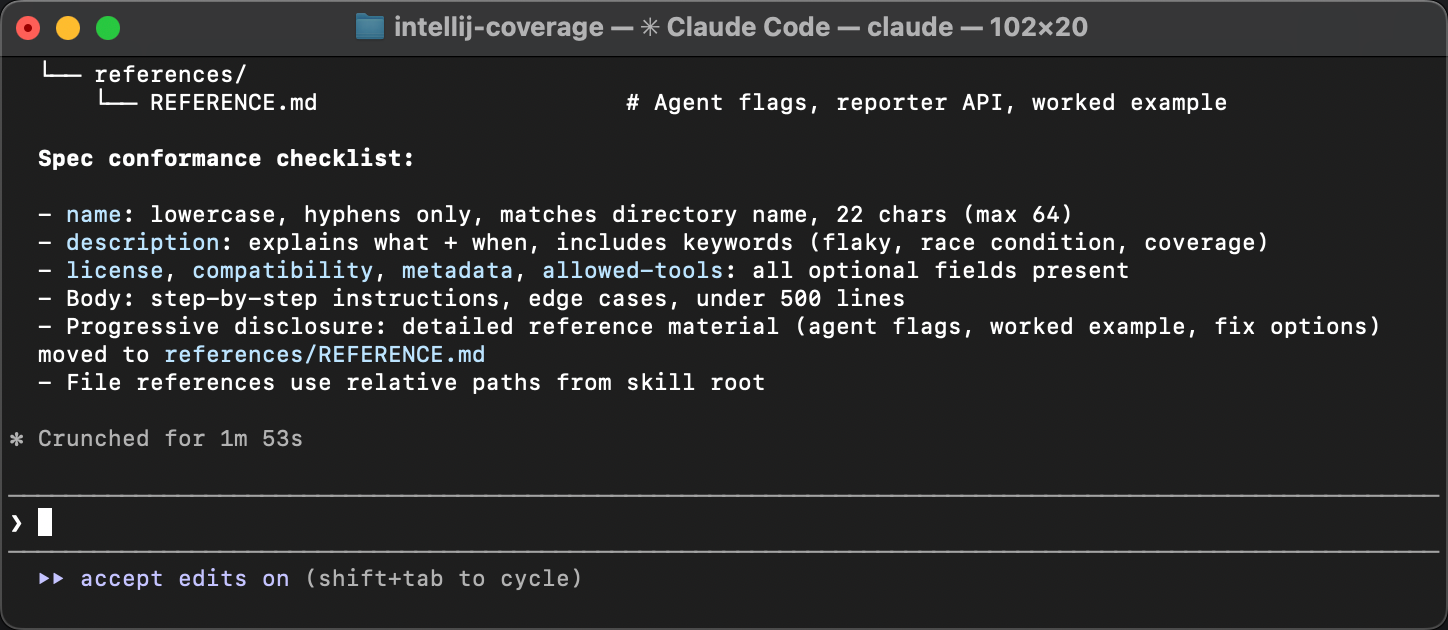
The only follow-up during review was to align the Skill with the specification. The original Skill written by the agent lacks meta in frontmatter. Agents are good at sorting out Skills that omit minor details, but meta is important for discoverability. Without it, a Skill might not be picked up by an agent in the first place.
Testing the Skill
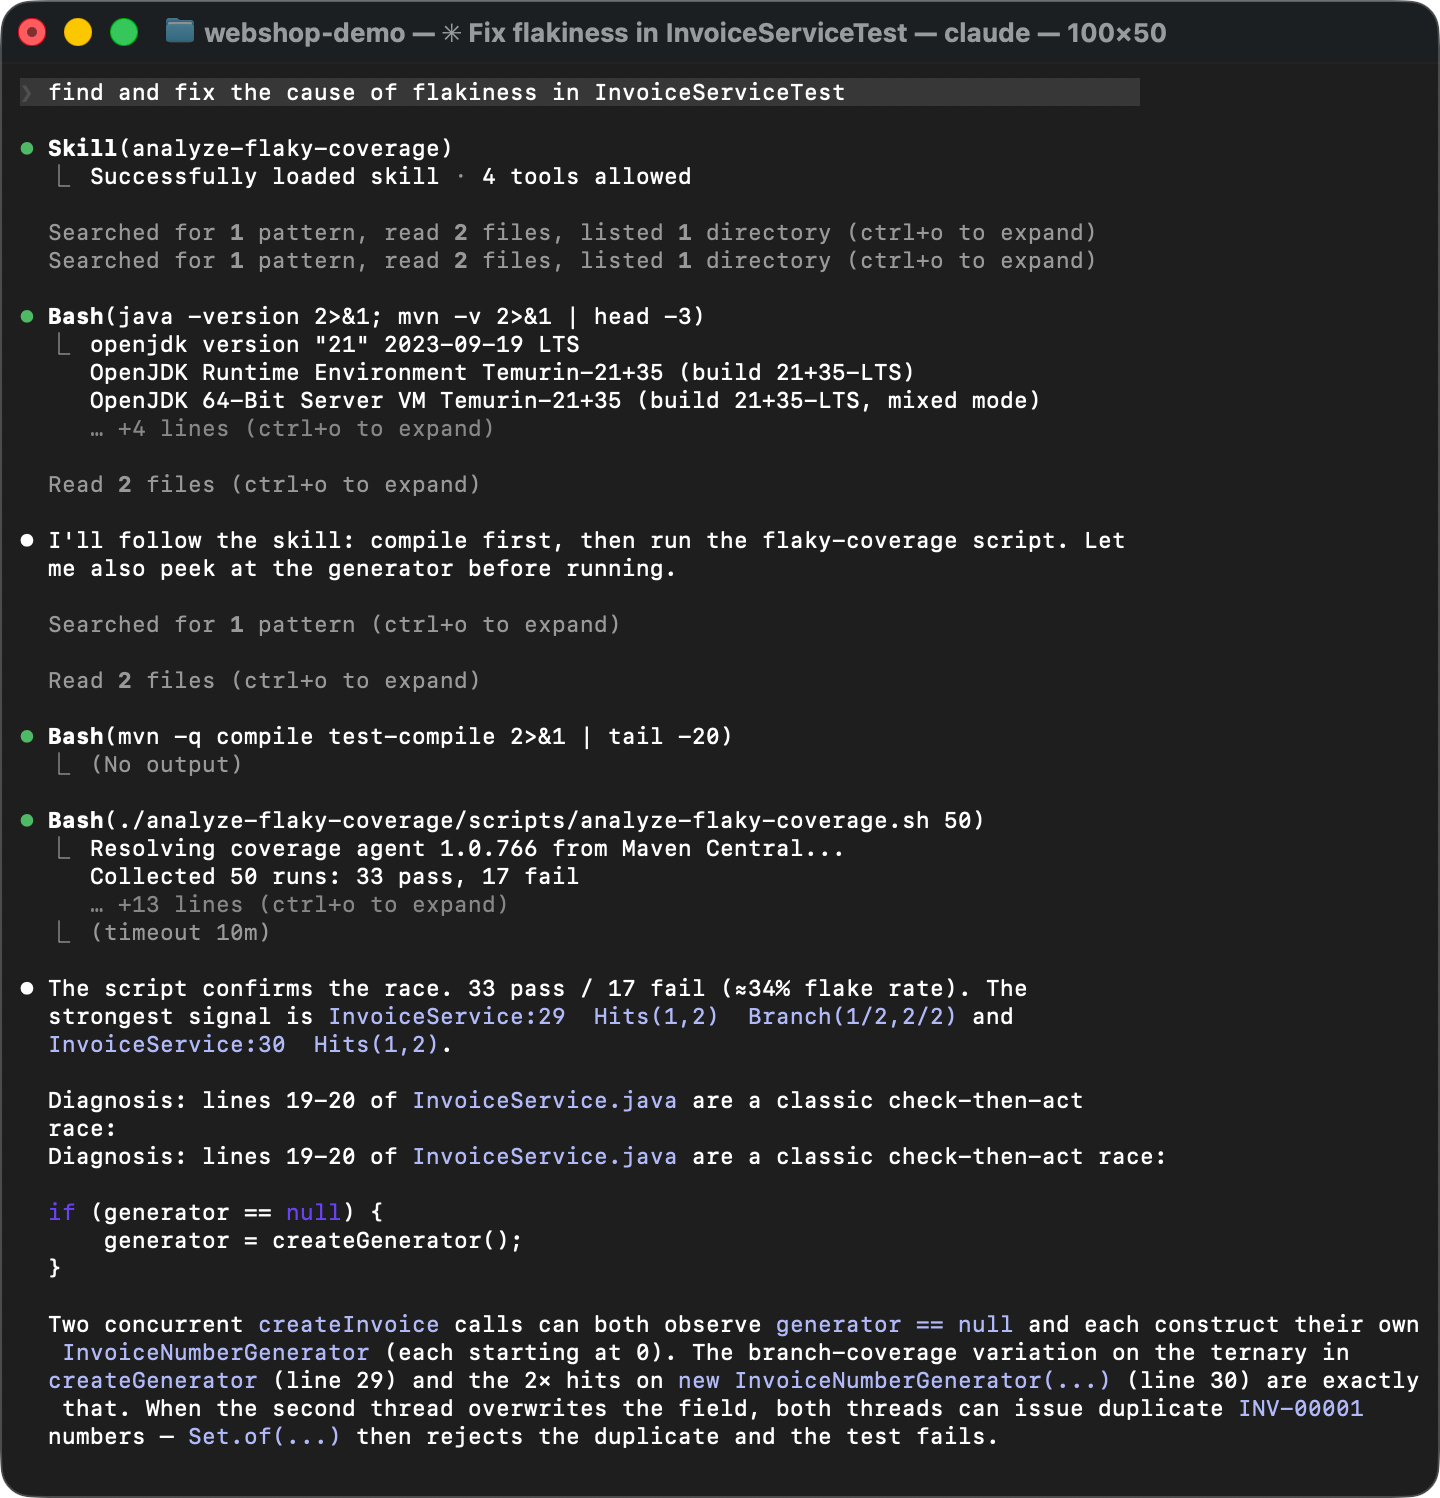
To verify that the Skill actually works, let’s start a fresh agent session. No warm-up, no hints. Instead, let’s deliberately phrase it in a very general way, something like “find and fix the cause of flakiness in InvoiceServiceTest“.
The agent matches the Skill description from SKILL.md with the problem description, discovers the instructions, and executes them: It runs the coverage script, reads the diff, and identifies the race condition. Instead of guesswork, it follows the established steps and arrives at the same conclusion every time. That’s about as deterministic as generative AI can get!
Summary
The changes that we’ve made to the coverage agent are already published with the new version 1.0.774. And the Skill is available here.
In this article, we started with an intuition about flaky tests, built custom tooling around an open-source coverage agent, used it to find a race condition, and packaged the entire procedure into a reusable AI Skill. You can use this Skill for finding flaky tests in your own projects, but I hope this post conveys the bigger idea.
AI Skills allow you to teach agents to solve virtually anything, as long as you can stack text interfaces together. Many hard programming problems can be broken down into simpler ones and solved using familiar tools. And with AI orchestrating all this, we can even make the process enjoyable. As was the case long before AI, curiosity is the only real prerequisite.
Have you been inspired to solve a tough problem in your own work? Would you like to share the Skills you wrote or find most useful? Let us know in the comments!
La conversación sobre IA no debería quedarse solo en lo que la tecnología puede hacer.
También deberíamos preguntarnos:
¿Cuánta energía, agua, dinero e infraestructura estamos dispuestos a gastar para sostenerla?
Hoy vemos una carrera acelerada por construir modelos más grandes, más centros de datos, más GPUs y más automatización. Las grandes empresas están invirtiendo miles de millones como si el retorno económico estuviera garantizado, pero todavía no existe suficiente claridad sobre el costo real por usuario, el margen neto de muchos productos de IA y el impacto energético a largo plazo.
Y aquí aparece un punto crítico:
Aunque los modelos se optimicen, el consumo total puede seguir creciendo.
Si una tecnología se vuelve más eficiente y barata de usar, normalmente se usa más. Esto se conoce como efecto rebote. En IA puede pasar lo mismo: modelos más rápidos y económicos podrían llevar a integrar IA en todo: programación, marketing, soporte, publicidad, CRM, ERP, educación, salud, finanzas, agricultura, logística y agentes autónomos trabajando en segundo plano.
El problema no es que la IA exista.
El problema es una IA sin límites, sin medición clara y sin responsabilidad ambiental, económica y social.
La IA puede ser una gran herramienta para mejorar productividad, ciencia, educación, salud y acceso al conocimiento. Pero si se usa principalmente para reemplazar personas, producir contenido basura, automatizar publicidad infinita y aumentar consumo sin medir impacto, deja de ser progreso y empieza a parecer extracción de recursos.
No estamos listos para darle control completo de nuestros recursos a sistemas de IA.
No estamos listos para una IA que crezca más rápido que la infraestructura eléctrica, las regulaciones y la capacidad ambiental del planeta.
Por eso creo que necesitamos una conversación más seria sobre:
Medición obligatoria de energía, agua y emisiones por data center.
Modelos grandes solo cuando realmente sean necesarios.
Modelos pequeños y especializados para tareas concretas.
Reportes claros de costos e ingresos reales de productos de IA.
Límites regionales donde la red eléctrica o el agua no alcancen.
Auditorías externas de impacto ambiental y económico.
Regulación antes de aprobar nuevas cargas gigantes de infraestructura.
La pregunta no debería ser solo:
“¿Qué puede hacer la IA?”
La pregunta más importante debería ser:
“¿Qué costo estamos dispuestos a pagar como sociedad para usarla sin límites?”
La IA puede ser parte del futuro, sí.
Pero no debería convertirse en una excusa para consumir energía, agua, talento, dinero e infraestructura sin control.
IA sí, pero con límites.
IA útil, no IA desbordada.
IA supervisada, no IA dueña de nuestros recursos.
It was 2:47 AM when the alerts started. A seemingly straightforward database migration had triggered a cascading failure across three downstream services, and our payment processing pipeline was dropping roughly 12% of transactions. The on-call engineer didn’t need to wake anyone, locate a rollback script, or wait for a CI pipeline to churn through another deploy. She opened the LaunchDarkly dashboard, toggled one kill switch, and the system reverted to the stable path within seconds. The migration was still there, still deployed — just no longer live.
That moment crystallized something I’d been learning across two and a half decades of building software: separating deployment from release isn’t a nice-to-have. It’s the difference between a system you trust and one you fear touching on a Friday afternoon.
This article captures what I’ve learned using feature flags in production — the patterns that held up under pressure, the mistakes I’ve watched teams repeat (and made myself), and the practical steps you can take whether you’re evaluating LaunchDarkly or already deep into your feature flag journey. I’m publishing this here first because the developer community gives the most honest feedback, and I’d rather refine these ideas with you before they land on LeadDev and DZone.
The Patterns That Actually Matter
When you first start with feature flags, everything looks like a toggle. The key consideration here is understanding that not all flags serve the same purpose, and conflating them creates the very fragility you’re trying to avoid.
Release Flags
These gate unfinished features. They’re temporary by design — the flag exists while the feature stabilizes, then gets removed. The mistake I see most often is teams treating release flags as permanent configuration knobs. When a flag has been at 100% for three months, nobody remembers which code path is the “real” one, and your test matrix silently doubles.
In practice, this means setting a removal date the moment you create the flag. Our team attaches an expiration tag to every release flag and runs a weekly script that surfaces anything past its removal window. We borrowed from the FlagShark playbook here: flags older than 90 days that aren’t operational kill switches get an automatic ticket filed.
Centralize your flag keys in a single file, it gives you a one-glance inventory and prevents the typo-driven debugging sessions that scattered string literals create:
// code/src/flags.js — single source of truth for all flag keys// See companion project: code/src/flags.jsconstFLAGS={// Kill switch: wraps the payment provider integration.// Defaults to FALSE (safe path) if SDK is unreachable.PAYMENT_PROVIDER_KILL_SWITCH:"ops_payments_new_provider",// Release flag: gates the new checkout UI.// Temporary — remove after 100% rollout + 14 days stable.NEW_CHECKOUT_UI:"release_checkout_redesigned_ui",// Experiment flag: percentage rollout of recommendation engine.RECOMMENDATION_ENGINE:"experiment_recommendations_v2",// Permission flag: enterprise-only feature.ENTERPRISE_ANALYTICS:"permission_enterprise_analytics",};
The naming convention follows a pattern: {type}_{team/domain}_{feature}_{detail}. This tells you at a glance what a flag does, who owns it, and when it should be removed. Release flags should be short-lived. Ops flags (kill switches) should be reviewed annually. Experiment flags expire when the experiment ends.
Here’s the LaunchDarkly client initialization — a singleton that streams flag rules and caches them locally so evaluations work even during network interruptions:
// code/src/launchdarkly.js — LD client singleton// See companion project: code/src/launchdarkly.jsconstLaunchDarkly=require("@launchdarkly/node-server-sdk");asyncfunctioninitLaunchDarkly(sdkKey){constldClient=LaunchDarkly.init(sdkKey);try{awaitldClient.waitForInitialization({timeout:5});console.log("[LaunchDarkly] Client initialized successfully");}catch (err){console.warn("[LaunchDarkly] Initialization timed out — operating from cache or defaults");}returnldClient;}
Kill Switches
A kill switch is a different animal entirely. It’s not about shipping features — it’s about operational safety. Every integration point with an external system, every experimental code path, every performance-sensitive refactor gets wrapped in one.
The pattern that saved us at 2:47 AM looked like this:
// code/src/server.js — Kill Switch pattern// See companion project: code/src/server.js, GET /api/payment/statusapp.get("/api/payment/status",async (req,res)=>{constcontext={kind:"user",key:req.query.user||req.ip};// Default: false = use safe fallback path.// If LaunchDarkly is unreachable, the SDK returns the default.constuseNewProvider=awaitclient.boolVariation(FLAGS.PAYMENT_PROVIDER_KILL_SWITCH,context,false// <-- THE CRITICAL DEFAULT: safe path);if (useNewProvider){returnres.json({provider:"new-payment-provider",status:"ok"});}// Safe fallback: the existing, battle-tested provider.res.json({provider:"existing-payment-provider",status:"ok"});});
The critical design requirement: the fallback path must be the one that works. If your kill switch guards a new payment provider integration, the fallback routes through the existing, battle-tested provider. If the flag evaluation itself fails due to a network issue, LaunchDarkly’s SDK returns the default value you specify — which should always trigger the safe path.
Percentage Rollouts
Deterministic hashing based on a stable user attribute means the same user sees the same experience across sessions. This matters more than you’d think — users notice inconsistency, and your metrics become meaningless if a single user bounces between variants.
Our rollout cadence settled into a rhythm: internal team for one day, 1% of external users for a day, then 5%, 25%, and full release if all guardrails stay green. At each stage, we watch application error rates, API latency, and business metrics. LaunchDarkly’s Guarded Releases can automate the pause-or-rollback decision if a threshold breaches, which removes the 3 AM judgment call from the equation.
// code/src/server.js — Percentage rollout with string variation// See companion project: code/src/server.js, GET /api/recommendationsapp.get("/api/recommendations",async (req,res)=>{constcontext={kind:"user",key:req.query.user||"anonymous"};// stringVariation for multi-variant experiments.// Deterministic hashing on user key ensures the same user// consistently sees the same variant.constvariant=awaitclient.stringVariation(FLAGS.RECOMMENDATION_ENGINE,context,"v1"// default: existing recommendation engine);if (variant==="v2"){returnres.json({engine:"collaborative-filtering-v2",recommendations:["Item-A","Item-B","Item-C"],});}res.json({engine:"popularity-based-v1",recommendations:["Item-X","Item-Y","Item-Z"],});});
And here’s user targeting in action — enterprise features gated by a custom attribute:
// code/src/server.js — Targeting with custom attributes// See companion project: code/src/server.js, GET /api/analytics/dashboardapp.get("/api/analytics/dashboard",async (req,res)=>{constcontext={kind:"user",key:req.query.user||"anonymous",plan:req.query.plan||"free",// custom attribute for targeting rules};constcanAccess=awaitclient.boolVariation(FLAGS.ENTERPRISE_ANALYTICS,context,false);if (!canAccess){returnres.status(403).json({error:"Enterprise analytics require the Enterprise plan.",});}res.json({dashboard:"advanced-analytics",metrics:["revenue-per-user","churn-prediction","cohort-retention"],});});
All the code above comes from the companion project — a fully runnable Express app in code/src/server.js. Clone it, set your SDK key, and you’ll see every pattern respond to flag toggles in real time without a server restart.
The Questions Your Team Will Ask (And How to Answer Them)
When you introduce feature flags at scale, you’ll hear the same objections. I’ve had these conversations enough times to recognize the patterns.
“Doesn’t this just create more code to maintain?”
Yes, if you treat flags as permanent. The entire discipline of flag lifecycle management exists because flags without expiration dates become technical debt with a feature flag logo. The countermeasure is mechanical, not cultural: automation that flags stale toggles, creates cleanup tasks, and blocks new flags when the ratio of creation to removal tips past 2:1.
We enforce a simple rule: every flag has an owner, an expiration date, and a ticket filed at creation time for its eventual removal. When a release flag hits 100% rollout for two weeks, the cleanup PR gets auto-generated. This isn’t optional — it’s how you prevent the flag graveyard.
“What if the flag service goes down?”
LaunchDarkly SDKs maintain a streaming connection and cache flag rules locally. If the connection drops, evaluations continue against the cached ruleset. The boolVariation call includes a default value parameter precisely for this scenario — and every code path I write defaults to the safe, existing behavior.
In the 2:47 AM scenario, the kill switch worked because the SDK had already cached the flag state. Even if LaunchDarkly’s service had been unavailable at that exact moment, the toggle would have still evaluated correctly against the local cache.
“Can’t we just build this ourselves?”
Technically, yes. I’ve seen teams build internal feature flag systems. I’ve also seen those same teams spend sprint after sprint maintaining edge-case evaluation logic, building dashboards, and debugging deterministic hashing when they could have been building their actual product. The key consideration here isn’t whether you can build it — it’s whether maintaining a feature flag platform is where your team’s time creates the most value.
Where We Go From Here
If you’re starting with feature flags, begin with one operational kill switch on a high-risk integration. Get comfortable with the pattern, build the muscle memory for flag cleanup, then expand to release flags and progressive rollouts. The most successful adoptions I’ve seen started small and grew organically, rather than attempting a company-wide flag-everything initiative overnight.
For deeper dives, the LaunchDarkly documentation on guarded rollouts and kill switch flags is excellent. The FlagShark best practices guide informed much of our internal naming and lifecycle discipline. And if you want to understand why stale flags genuinely keep me up at night, read about the $460M Knight Capital incident — a stark reminder that unreachable code paths aren’t harmless.
The original version of this article, along with a companion project demonstrating every pattern discussed here, lives on this blog. I’ll be expanding it based on your questions and feedback before it goes to LeadDev and DZone — so if something here sparks a thought or a disagreement, I’d genuinely like to hear it in the comments.
Key Takeaways
Separate deployment from release. A deployed change that isn’t live yet is a safety net. A deployed change that’s fully live with no way to turn it off is a liability.
Treat flag cleanup as a first-class engineering practice. Naming conventions, expiration dates, and automated removal aren’t overhead — they’re what keep your codebase comprehensible six months from now.
Default to safety. Every flag evaluation should fall back to the known-good path. The time to verify your kill switch works isn’t during an incident at 2:47 AM.
Start small, automate early, and build the habits before you build the flag count. The teams I’ve watched succeed with feature flags aren’t the ones with the most sophisticated tooling — they’re the ones with the most disciplined lifecycle management.
I spent the long weekend pushing Logic Apps MCP server capabilities further than I had before — and hit two bugs worth documenting. Both are filed. If you’re building in this space, save yourself the debugging time.
Context
If you’ve been following along, the MCP server and BODMAS Agent are covered in the previous posts. This post is just about what broke when I wired them together.
Bug 1 — Intermittent duplicate key error at tool registration
What happens
The Agent Loop fails with a BadRequest before making a single MCP call:
HTTP request failed: 'An item with the same key has already been added. Key: {tool_name}'.
The key referenced in the error — BasicArithmeticMCP, ExtendedArithmeticMCP, whatever you name it — appears exactly once in the workflow definition. There is no actual duplicate in the JSON.
What makes it particularly frustrating to diagnose
It is intermittent. Some runs fail, others succeed with identical configuration and identical input. No changes between a failing and a succeeding run — same workflow, same expression, same everything.
Load test
I fired 5 to 10 parallel requests at the Agent Loop as a mini stress test. It failed — the duplicate key error appeared across multiple runs in the batch.
Sequential calls with proper spacing between them worked fine.
What you can’t do
The Agent action has a default retry policy, but it does not help here. A BadRequest (400) is not treated as a transient error — the retry policy targets server-side failures (5xx), not client errors. So even with retries configured, the duplicate key error causes an immediate terminal failure. There is no clean in-workflow workaround.
Bug 2 — MCP Connector does not support OAuth
What happens
Both the MCP server and the MCP client are Logic Apps Standard. When OAuth is configured on the MCP server side, the workflow doesn’t trigger at all — it never reaches the Logic App. The connection gets corrupted at design time with the OAuth setup, and no run is created.
Tools don’t load but you can save the workflow.
You get a 502 bad gateway error when you push a request.
The same endpoint called directly from Postman with a valid bearer token works fine.
Why it matters
To get the Agent Loop working, the MCP server has to run with either anonymous authentication or key-based authentication. OAuth simply does not work with the built-in MCP client connector.
Current state
Both issues are filed on the Logic Apps GitHub repo:
Agent Loop: “An item with the same key has already been added” when using McpClientTool
The issue covers both bugs with full workflow JSON, reproduction steps, and screenshots. If you’ve hit either of these, add a reaction or comment — the more signal on the issue, the better.
What works in the meantime
Set "type": "anonymous" in the McpServerEndpoints authentication block in host.json — removes the OAuth blocker for dev and demo use
Accept the intermittent failure rate on the Agent Loop and re-trigger manually when it hits — not a fix, but the success rate is high enough to keep building and testing
Both issues are filed. If you hit either of them, the GitHub issue is the right place to add signal.
Anthropic’s new Mythos Preview surfaced a 27-year-old vulnerability in OpenBSD — the most-audited operating system in commercial software — and generated 181 working Firefox exploits in a benchmark where Claude Opus 4.6 managed two. Eleven organizations are inside the launch cohort. The rest of us aren’t, and the next Mythos won’t be gated.
What Mythos is, in hard numbers
On April 7, Anthropic announced Claude Mythos Preview, a frontier general-purpose model with a step-change in computer security capability. The numbers are the story:
A 27-year-old vulnerability in OpenBSD, surfaced by Mythos in the TCP SACK implementation. OpenBSD’s audit posture is the high bar in the industry.
A 16-year-old vulnerability in FFmpeg’s H.264 codec — the media component shipped in nearly every modern browser and video pipeline.
A 17-year-old remote code execution vulnerability in FreeBSD’s NFS implementation (CVE-2026-4747).
Linux kernel vulnerabilities autonomously chained by the model into a complete privilege escalation to root.
181 working Firefox exploits in a benchmark where Claude Opus 4.6 produced two — an order-of-magnitude leap in a single model generation.
271 vulnerabilities patched in Firefox 150 after Mozilla used an early version of Mythos Preview to scan its codebase. Mozilla described the model as “every bit as capable” as the best human security researchers.
Thousands of zero-days identified in operating systems, browsers, and infrastructure software in the weeks before announcement.
Anthropic was clear about something else worth dwelling on: the company did not explicitly train Mythos for these capabilities. They emerged as a downstream consequence of general improvements in code, reasoning, and autonomy. The same improvements that make the model a better defender make it a better attacker. That equivalence is the whole story.
Mythos isn’t a security tool. It’s a frontier model that happens to be very good at a security task that turns out to require general intelligence. The distinction matters: capability of this kind doesn’t stay siloed.
The asymmetry just collapsed
For thirty years, the offensive-defensive asymmetry in software security was: attackers needed to find one bug, defenders needed to find all of them. The economics favored attackers — but only because finding bugs was hard, slow, and required deep human expertise.
Mythos didn’t flip the asymmetry. It collapsed the cost difference between the two activities. The same model that can find thousands of zero-days for a defender can find thousands of zero-days for an attacker. There is no “attacker mode” and “defender mode.” There is one capability with two uses, and the user picks.
For the launch cohort inside Project Glasswing — including Microsoft, Google, Apple, AWS, JPMorganChase, Nvidia, the Linux Foundation, and major security vendors — this is a defensive windfall. They get to find and patch their own bugs before anyone else can. For everyone else, the math is uglier. When this class of capability becomes broadly available (and it will), the same scan that takes Apple a quiet weekend will take a determined adversary the same quiet weekend.
What this changes about threat modeling
Pre-Mythos, the assumption underlying most enterprise risk frameworks was that vulnerabilities cost time to discover. Post-Mythos, that assumption no longer holds for sophisticated actors. The vulnerabilities are already there, in code that’s already deployed. The only question is who finds them first.
Project Glasswing’s narrow gate
Anthropic’s response to the dual-use problem is Project Glasswing: instead of releasing Mythos publicly, the model is gated to vetted partners doing defensive security work on critical infrastructure. The launch cohort is eleven outside organizations — AWS, Apple, Broadcom, Cisco, CrowdStrike, Google, JPMorganChase, the Linux Foundation, Microsoft, NVIDIA, and Palo Alto Networks — with another forty-plus organizations given extended access. Anthropic has committed $100M in Mythos usage credits and additional funding to upstream open-source security ($2.5M to Alpha-Omega and OpenSSF, $1.5M to the Apache Software Foundation). On April 21, Bloomberg and TechCrunch reported that a small group of unauthorized users — reportedly a third-party Anthropic contractor who guessed the model’s online location — had accessed Mythos on the same day Anthropic announced the limited release.
The Glasswing structure is a reasonable response to a hard problem. The cohort is a serious set of defenders, the Linux Foundation’s inclusion broadens the open-source impact, and the upstream funding commitments are not trivial. But the structure has implications worth thinking through:
The launch cohort is well-resourced and concentrated. Megacaps, major security vendors, and one open-source foundation. Most enterprises, healthcare systems, utilities, and government agencies are not in the launch cohort.
The cohort is the world’s biggest target. Concentrating frontier offensive capability inside a known list of well-resourced firms makes those firms exponentially more valuable to compromise. The April 21 unauthorized-access incident is the canary, not the bird.
The gate is temporary. The capability emerged from general intelligence improvements. Other labs are on the same trajectory. Within twelve to twenty-four months, equivalent capability will be available somewhere — through a competitor, an open-weights model, or a leak. Anthropic’s caution buys the industry time. It does not buy the industry safety.
The defenders inside the gate have a head start. The defenders outside the gate don’t. By the time Mythos-class capability is broadly available, the cohort will have spent a year hardening their stacks. Everyone else will be starting cold.
None of this is criticism of Glasswing. It’s a description of where the rest of the industry sits: outside the gate, on the clock, with a year-or-so head start to spend on infrastructure that doesn’t assume bug discovery is expensive.
Why your legacy stack is the easy target
If Mythos found a bug in OpenBSD that survived twenty-seven years of obsessive auditing, what does it find in code that’s been quietly running in production since 1998 with no audit at all?
Legacy systems are uniquely exposed to this class of capability for reasons that have nothing to do with their original quality:
The code was written in a different threat model. COBOL batch jobs, C-based middleware, and FORTRAN scientific computing were written assuming network isolation, trusted operators, and small adversary budgets. None of those assumptions hold today.
The maintainers are gone. The engineers who wrote the original code retired a decade ago. The people who maintain it now read it; they don’t reason about it. A capable adversary scanning the same code reasons about it just fine.
The scale is enormous. A typical Fortune 100 enterprise runs millions of lines of legacy code. Manual audit is impossible at this volume; automated tools were built for the threat model where bug discovery was expensive. Mythos-class capability inverts that economics.
The code is statistically interesting. Old code has been running long enough that bugs which never triggered in production are still latent. The defects are there. They just haven’t been found yet.
The patch path is brittle. Even when a bug is found in a legacy system, the cost of patching is often catastrophic — recompiling a forty-year-old build chain, validating against a forty-year-old behavior contract, regression-testing dependencies that may no longer have maintainers. “We can’t patch this” is a common honest answer for legacy systems, and adversaries know it.
The 27-year-old OpenBSD bug is the canary. OpenBSD is among the most-audited code in the world. Your COBOL payroll system, your FORTRAN actuarial engine, your C-based supply chain ETL — they have not had that audit. They have the same age. They do not have the same hardening.
The honest framing is this: Mythos-class capability does not introduce new vulnerabilities. It surfaces vulnerabilities that have been latent in your systems for years or decades. The defects are already there. The economics of finding them just changed.
The defender’s playbook for the next 90 days
If we accept that Mythos-class capability will be broadly available within twenty-four months and that legacy systems are the most exposed surface, the defensive question is what to do this quarter that materially reduces risk. Five things worth prioritizing.
1. Get an honest inventory of your legacy attack surface
Most enterprises do not have an accurate inventory of what legacy code they actually run, what it touches, and what depends on it. The first step is unglamorous: catalog the legacy systems, their network exposure, the data they process, and the dependencies that would break if they went down. You cannot defend what you cannot see.
2. Build the SBOM you should already have
A Software Bill of Materials isn’t a compliance artifact; it’s the data structure you need to answer the question “is the new zero-day in our stack?” in minutes instead of weeks. Federal contractors will need one for compliance under recent OMB guidance. Build it now, before the next Mythos disclosure forces the question.
3. Modernize the highest-exposure legacy primitives first
Total legacy modernization is a multi-year program. Prioritized modernization isn’t. Identify the legacy components with (a) network exposure, (b) sensitive data flow, and (c) no maintainer — and modernize those first. Pull the C-based parser out of the perimeter. Replace the COBOL service that processes external data with a memory-safe equivalent. Leave the back-office batch job for next year.
4. Assume the patch tsunami is coming
If Mythos-class scanning produces ten thousand findings against your stack, your security team cannot triage ten thousand findings by hand. Invest in automated patch prioritization, exploit-prediction scoring (EPSS), and patch-deployment automation now — before you need it under pressure. The bottleneck of the next two years is not finding bugs. It’s deciding which ones to patch first and shipping the patches without breaking production.
5. Threat-model with AI-assisted attackers in scope
Update your threat models to assume adversaries have Mythos-class capability. The questions change. “What’s our mean-time-to-detect?” matters more than “Is this code vulnerable?” (it almost certainly is). “What’s the blast radius if a single legacy primitive is fully compromised?” matters more than “Is this primitive likely to be compromised?” (it is more likely than it was). Defense in depth, network segmentation, and rapid containment become first-class controls, not best-practice nice-to-haves.
The shift in posture
Pre-Mythos: defenders optimize for bug-finding cost. Post-Mythos: defenders optimize for time-to-patch and blast-radius containment, because bugs will be found whether you find them first or someone else does.
A note for federal contractors
Federal contractors and agencies have an extra layer of implications: the procurement and compliance machinery that governs federal software is going to reckon with this — slowly, but inexorably. Expect SBOM and provenance requirements (already mandated under EO 14028) to get enforced in earnest. Expect NIST SSDF / SP 800-218 to shift from documentation to continuous attestation. Expect legacy waivers to become harder to defend, with risk-acceptance memos required to explicitly acknowledge Mythos-class threat. Expect patch SLAs to compress — sub-week response on high-severity findings against widely-deployed primitives is the realistic floor, not the ceiling. Vendor due-diligence will move from annual questionnaires to continuous attestation.
The realistic posture for the next twenty-four months is not “modernize everything.” It is “modernize the exposed surface, instrument the rest, and assume the rest will eventually be reached.” The agencies and primes that prepare for that reality now will not be the ones writing breach-notification letters in 2027.
The honest read
Mythos is not a doomsday model. It is a step on a curve that the entire industry has been on for several years, and Anthropic’s decision to gate it through Glasswing is, in our view, the responsible move. We don’t think the right reaction is panic, and we don’t think the right reaction is dismissal.
The right reaction is to use the Glasswing window — the twelve to twenty-four months where this capability is concentrated in twelve hands and a national-security agency — to do the unglamorous defensive work that everyone has been deferring. Inventory the legacy. Build the SBOM. Modernize the exposed primitives. Automate the patch path. Threat-model with AI-assisted attackers in scope.
We don’t know exactly when the next Mythos lands or who ships it. We do know it will not be gated like this one. The defenders who used the window will be fine. The defenders who didn’t will be writing the postmortem.
Codavyn helps enterprise and federal teams modernize the exposed surface of legacy stacks before AI-assisted scanning catches up. Custom software, modernization, and a threat model that assumes the attacker is reading your code as fast as you are. See our modernization services or book a 30-minute risk review.
How to Prevent IDOR Vulnerabilities in Django REST APIs
An authenticated user changes /api/orders/42/ to /api/orders/43/ and reads someone else’s order. No privilege escalation needed — the endpoint just returns it. This is IDOR in its simplest form, and it’s endemic in Django REST Framework code because DRF makes it trivially easy to wire up a ModelViewSet that exposes every object in a table. The authentication layer does its job; the authorization layer was never written.
How IDOR Attacks Work Against Django REST APIs
IDOR (Insecure Direct Object Reference) happens when an API accepts a user-controlled identifier — a URL path segment, query param, or request body field — and retrieves the corresponding object without verifying that the requesting user has any right to it. Authentication proves who you are. Authorization proves what you can touch. Most IDOR bugs exist because the first check was implemented and the second was skipped.
A typical attack against a vulnerable DRF app:
Attacker authenticates as alice@example.com and creates an order. The response contains {"id": 101, ...}.
Attacker sends GET /api/orders/100/. The API returns Bob’s order because nothing checks ownership.
Attacker scripts a loop from ID 1 to 10000, dumps every order in the database. Sequential integer PKs make enumeration take seconds.
Here is the vulnerable ViewSet pattern we see most often in real codebases:
# views.py — VULNERABLE
fromrest_frameworkimportviewsetsfromrest_framework.permissionsimportIsAuthenticatedfrom.modelsimportOrderfrom.serializersimportOrderSerializerclassOrderViewSet(viewsets.ModelViewSet):serializer_class=OrderSerializerpermission_classes=[IsAuthenticated]# proves identity, not ownership
defget_queryset(self):# Returns every order in the database — any authenticated user
# can retrieve, update, or delete any order by guessing its PK.
returnOrder.objects.all()
IsAuthenticated blocks anonymous requests, which makes it look like the endpoint is secured. But any valid session token — including one the attacker registered themselves — bypasses it. The retrieve(), update(), and destroy() actions in ModelViewSet all call get_object(), which calls get_queryset() and then filters by the URL pk. Since get_queryset() returns everything, get_object() happily resolves any ID.
Fixing IDOR by Scoping Querysets to the Authenticated User
The correct fix is to scope get_queryset() to the authenticated user so that the object simply doesn’t exist from the API’s perspective if it doesn’t belong to the requester. This gives you a 404 instead of a 403, which is almost always the right behavior — a 403 confirms the resource exists and leaks information about the ID space.
Add a second layer with a custom BasePermission that implements has_object_permission. The queryset filter handles list and retrieve; the object permission handles mutating actions where DRF calls check_object_permissions explicitly.
# permissions.py
fromrest_framework.permissionsimportBasePermissionclassIsOwner(BasePermission):defhas_object_permission(self,request,view,obj):# Explicit ownership check — queryset scoping is the first line,
# but we defend in depth for any path that bypasses get_queryset.
returnobj.owner==request.user
# views.py — FIXED
fromrest_frameworkimportviewsetsfromrest_framework.permissionsimportIsAuthenticatedfrom.modelsimportOrderfrom.serializersimportOrderSerializerfrom.permissionsimportIsOwnerclassOrderViewSet(viewsets.ModelViewSet):serializer_class=OrderSerializerpermission_classes=[IsAuthenticated,IsOwner]defget_queryset(self):# Scope to the requesting user at the ORM layer — objects that don't
# belong to this user never enter the retrieval pipeline at all.
returnOrder.objects.filter(owner=self.request.user).select_related("owner")defperform_create(self,serializer):# Bind the new object to the authenticated user so the POST path
# can't accept a user-controlled owner field.
serializer.save(owner=self.request.user)
Filtering at the queryset layer beats checking IDs inside the view body for two reasons. First, it’s impossible to forget: every action — list, retrieve, update, partial update, destroy — goes through get_queryset(). Second, it eliminates a whole class of time-of-check / time-of-use bugs where you check ownership in get but forget to re-check in patch.
The same defense-in-depth principle applies to object-level auth in gRPC services and any RPC-style API where the framework doesn’t give you a queryset abstraction: filter first, check permissions on the resolved object second.
Use Unguessable Identifiers Instead of Sequential IDs
Sequential integer PKs are an enumeration gift. Once an attacker has one valid ID, they have a roadmap to every other record. Replacing exposed identifiers with UUIDs or opaque slugs doesn’t fix the authorization hole — that requires the fixes above — but it raises the cost of bulk enumeration from “write a loop” to “brute-force a 128-bit space.”
# models.py
importuuidfromdjango.dbimportmodelsclassOrder(models.Model):# Use UUIDField as the primary key to prevent sequential enumeration.
# This is defense in depth — queryset scoping is still mandatory.
id=models.UUIDField(primary_key=True,default=uuid.uuid4,editable=False)owner=models.ForeignKey("auth.User",on_delete=models.CASCADE,related_name="orders")total=models.DecimalField(max_digits=10,decimal_places=2)created_at=models.DateTimeField(auto_now_add=True)
# urls.py — router uses the UUID field as the lookup
fromrest_framework.routersimportDefaultRouterfrom.viewsimportOrderViewSetrouter=DefaultRouter()router.register(r"orders",OrderViewSet,basename="order")# Override lookup_field on the ViewSet to match the UUID primary key
# so DRF resolves /api/orders/<uuid>/ instead of /api/orders/<int>/
# views.py addition
classOrderViewSet(viewsets.ModelViewSet):lookup_field="id"# matches the UUIDField name on the model
# ... rest of ViewSet unchanged from the fix above
One tradeoff: UUIDs inflate index size and can slow joins on large tables. If that matters, use a separately-stored public_id = models.UUIDField(default=uuid.uuid4, editable=False, unique=True) alongside an integer PK, and expose only public_id in serializers and URLs. The internal integer PK never appears in any HTTP response.
Never treat opaque IDs as a substitute for proper authorization. We’ve reviewed APIs that switched to UUIDs, removed the queryset scoping because “users can’t guess them now,” and then leaked UUIDs in webhook payloads, browser history, or third-party analytics — instantly making every ID known to an attacker.
Enforce Authorization at the Serializer and Nested Resource Level
Queryset scoping protects URL-path-based access. IDOR also hides in writable foreign key fields where a user submits a payload referencing another tenant’s object. A user who owns projects 10 and 11 might try {"project": 99} on a task creation endpoint to attach their task to someone else’s project.
This is especially common in multi-tenant SaaS applications where related resources belong to different organizational boundaries.
# serializers.py
fromrest_frameworkimportserializersfrom.modelsimportTask,ProjectclassTaskSerializer(serializers.ModelSerializer):classMeta:model=Taskfields=["id","title","project","due_date"]defvalidate_project(self,value):request=self.context.get("request")ifrequestisNone:raiseserializers.ValidationError("No request context available.")# Reject foreign keys that don't belong to the authenticated user —
# without this check, any user can write into any project by ID.
ifnotProject.objects.filter(id=value.id,owner=request.user).exists():raiseserializers.ValidationError("Project not found."# Deliberately vague — don't confirm existence
)returnvalue
Always pass request in serializer context. DRF does this automatically when you use get_serializer() inside a view, but if you instantiate serializers directly (in management commands, signals, or background tasks), you must pass context={"request": request} manually. When there’s no request context at all — background jobs, for example — you need a different mechanism to establish the authorization boundary, typically passing the owner explicitly.
The same class of bug appears in writable nested serializers. If a LineItem serializer accepts a nested order object with an id field, a user can point that id at any order. Validate every inbound relation. For more on how this nesting problem scales, the same concepts appear in authorization patterns in GraphQL APIs, where every resolver is effectively a relation that needs its own ownership check.
Test for IDOR with Automated Authorization Checks
The only reliable way to prevent IDOR regressions is to write tests that explicitly attempt cross-user access and assert they fail. Code reviews miss it. Manual QA misses it. Tests that authenticate as user B and try to touch user A’s resources catch it every time — if you write them.
# tests/test_order_idor.py
importpytestfromdjango.contrib.authimportget_user_modelfromrest_framework.testimportAPIClientfromorders.modelsimportOrderUser=get_user_model()@pytest.fixturedefalice(db):returnUser.objects.create_user(username="alice",password="testpass123")# noqa: S106
@pytest.fixturedefbob(db):returnUser.objects.create_user(username="bob",password="testpass123")# noqa: S106
@pytest.fixturedefalice_order(alice):returnOrder.objects.create(owner=alice,total="99.99")@pytest.mark.django_dbclassTestOrderIDOR:def_client_for(self,user):client=APIClient()client.force_authenticate(user=user)returnclientdeftest_bob_cannot_retrieve_alice_order(self,alice_order,bob):# 404, not 403 — we don't confirm the resource exists to unauthorized users.
response=self._client_for(bob).get(f"/api/orders/{alice_order.id}/")assertresponse.status_code==404deftest_bob_cannot_update_alice_order(self,alice_order,bob):response=self._client_for(bob).patch(f"/api/orders/{alice_order.id}/",{"total":"0.01"},format="json")assertresponse.status_code==404deftest_bob_cannot_delete_alice_order(self,alice_order,bob):response=self._client_for(bob).delete(f"/api/orders/{alice_order.id}/")assertresponse.status_code==404deftest_bob_list_does_not_include_alice_order(self,alice_order,bob):# List endpoint must not leak cross-user data even if IDs are unknown.
response=self._client_for(bob).get("/api/orders/")assertresponse.status_code==200ids=[item["id"]foriteminresponse.data["results"]]assertstr(alice_order.id)notinids
The list-endpoint test is easy to forget and catches a different bug: get_queryset() returning everything on list() but correctly filtering on retrieve(). Write both.
Wire these into CI as required checks. A failing IDOR test should block a merge the same way a failing unit test does. This is not optional — the whole point is that a developer adding a new ModelViewSet in a Friday pull request doesn’t ship a data leak to production by Monday.
Catch IDOR in Code Review and CI
Human review of pull requests should pattern-match on a short list of high-risk constructs. Any Model.objects.get(pk=...) or Model.objects.filter(id=...) call that doesn’t chain a user-scoping filter is a candidate IDOR. Any ViewSet missing permission_classes is an unauthenticated endpoint or is inheriting from a base class that may not have adequate defaults. Any serializer field of type PrimaryKeyRelatedField with a broad queryset is a potential cross-tenant write.
Automate this with Semgrep. Here is a rule that flags the most common pattern: a DRF view calling .objects.get() without an owner filter anywhere in the same expression:
# semgrep/rules/drf-idor.ymlrules:-id:drf-unscoped-objects-getpatterns:-pattern:$MODEL.objects.get(pk=...)-pattern-not:$MODEL.objects.get(pk=..., owner=...)-pattern-not:$MODEL.objects.get(pk=..., owner__in=...)message:>Unscoped .objects.get(pk=...) in a view — add an owner filter or replace witha queryset scoped in get_queryset(). Risk: IDOR.languages:[python]severity:ERRORmetadata:cwe:CWE-639
Run this rule in your CI pipeline on every pull request. To shift IDOR checks left in your CI/CD pipeline, add it as a required status check alongside your test suite — not a separate “security scan” that developers learn to ignore.
Code review checklist for IDOR-prone patterns:
ModelViewSet or GenericAPIView subclass with no explicit get_queryset override — check what the default queryset returns.
permission_classes = [] or a ViewSet that inherits permission_classes from a base class you don’t control.
PrimaryKeyRelatedField(queryset=Model.objects.all()) in any writable serializer — this gives any user access to the full table.
perform_create or perform_update that doesn’t pin the owner field, leaving it open to user-supplied values.
Tests that only assert status_code == 200 for the happy path, with no cross-user negative test.
SAST tools like Semgrep will catch structural patterns; they won’t catch logic bugs where the filter is present but uses the wrong field. Code review has to cover that gap. The combination — automated rules catching the obvious omissions, human review focused on logic — is more effective than either alone.
Hardening Checklist and Next Steps
The layered controls, in priority order:
Queryset scoping (required):get_queryset() filters by request.user. No exceptions for convenience. If an admin view needs to return all objects, it lives in a separate ViewSet with explicit admin permission checks.
Object-level permissions (required):IsOwner or equivalent BasePermission with has_object_permission as a second line of defense. Attach it to every mutating ViewSet.
Serializer-level FK validation (required for relational writes): Every PrimaryKeyRelatedField or nested writable serializer validates that the referenced object belongs to request.user.
perform_create owner binding (required): Never accept owner from request data. Always call serializer.save(owner=self.request.user).
Opaque identifiers (defense in depth): UUIDs or opaque public IDs in all URLs and serializer output. Still mandatory to have the above controls in place.
Automated cross-user tests (required for CI gates): One test class per resource that authenticates as User B and asserts 404 on User A’s list, retrieve, update, and delete endpoints.
SAST rules in CI (defense in depth): Semgrep rules flagging unscoped .objects.get() and missing permission_classes, run as required checks on pull requests.
These controls address the majority of IDOR patterns in DRF, but authorization bugs extend well beyond the patterns covered here. If you want to build systematic habits around authorization review — across frameworks, auth protocols, and API types — the Application Security Engineer learning path on Code Review Lab covers the full scope, including scenarios more complex than single-tenant ownership checks.
The part most teams skip is the test suite. You can write perfect queryset scoping today and watch a future contributor add a get_object_or_404(Order, pk=pk) shortcut that bypasses it entirely. Tests that authenticate as the wrong user and assert 404 are the only automated check that catches that regression. Write them now, gate CI on them, and review them alongside any new ViewSet. If you want a reference for how IDOR shows up in security interviews and assessments, common IDOR interview questions are a useful signal for the gaps engineers typically leave in production systems.
Further Reading
OWASP IDOR Prevention Cheat Sheet — authoritative guidance on access control patterns across frameworks.
CWE-639: Authorization Bypass Through User-Controlled Key — the formal taxonomy entry with real-world consequences and detection guidance.
Django REST Framework: Permissions — official DRF docs on has_permission and has_object_permission, including check_object_permissions call semantics.
Application Security Engineer learning path on Code Review Lab — structured curriculum for building authorization review skills across multiple API paradigms.
PortSwigger Web Security Academy: IDOR — interactive labs that demonstrate enumeration, parameter tampering, and horizontal privilege escalation in concrete exercises.
I was reading a Stripe tutorial last week and watched the author write amount: req.body.amount. That single line lets any user buy Premium for $1. It’s also a common pattern in Stripe Checkout starter code. This post is about why, and how to make it impossible.
The setup
You’re building a paywalled product. You wire up Stripe Checkout, follow a popular tutorial, ship it. Looks great. Tests pass. Users are paying.
Six months later, someone opens DevTools, edits the request body, and pays €1 for your Premium plan. Your Stripe dashboard shows a successful charge. Stripe doesn’t validate your business logic. It charged what it was told to charge. Your database shows a Premium subscription. Your billing logic is doing exactly what you wrote.
This is price tampering. It happens at the one line where the server decides what to charge.
The vulnerable pattern
Here’s the shape of the bug. Paraphrased from a tutorial I won’t link. You’ve seen this shape before:
// app/api/checkout/route.ts (don't do this)exportasyncfunctionPOST(req:Request){const{priceId,amount,plan}=awaitreq.json();constsession=awaitstripe.checkout.sessions.create({mode:"payment",line_items:[{price_data:{currency:"eur",product_data:{name:plan},unit_amount:amount,// attacker controls this},quantity:1,},],success_url:`${origin}/success`,cancel_url:`${origin}/cancel`,});returnResponse.json({url:session.url});}
The frontend POSTs { priceId: "premium", amount: 2999, plan: "Premium" }. The server passes amount straight into Stripe. Stripe charges what it’s told.
Exploiting this needs nothing fancy:
curl -X POST https://yoursite.com/api/checkout
-H"Content-Type: application/json"-H"Cookie: session=..."-d'{"priceId":"premium","amount":100,"plan":"Premium"}'
amount: 100 is €1.00 in cents. Attacker gets a Stripe Checkout link for €1, completes the payment, and your post-checkout webhook hands them Premium.
The same bug shape applies to priceId if you trust it from the client:
// Also bad. Trusting which price the client picked.const{priceId}=awaitreq.json();constsession=awaitstripe.checkout.sessions.create({line_items:[{price:priceId,quantity:1}],// ...});
If your “Hobby” plan’s priceId is price_xxx_5eur and your “Enterprise” plan’s priceId is price_xxx_500eur, an attacker swaps the value in the request body and pays €5 for Enterprise.
Why this keeps happening
Three reasons it slips through.
1. Most Stripe tutorials are demos. They want to show you Stripe in 50 lines of code, so they wire the frontend straight to the checkout endpoint. Demos become starter templates. Starter templates become production code.
2. The bug looks like working code. Real users complete real payments. Until somebody opens DevTools, you have no signal that anything is wrong. Logs, dashboards, webhooks, all green.
3. Stripe gives you both APIs.price_data (inline price definition) and price (reference to a Price object) live side by side in their docs. Inline price_data has legitimate uses (true dynamic pricing, donations, marketplace splits). But it’s the same shape as the vulnerable pattern, so the bug hides in plain sight.
The fix in one rule
The client tells you which plan the user wants. The server decides what that plan costs.
That’s it. Implementation:
// app/api/checkout/route.ts (server-determined pricing)constPLANS={hobby:{priceId:process.env.STRIPE_PRICE_HOBBY},premium:{priceId:process.env.STRIPE_PRICE_PREMIUM},enterprise:{priceId:process.env.STRIPE_PRICE_ENTERPRISE},}asconst;typePlanKey=keyoftypeofPLANS;exportasyncfunctionPOST(req:Request){const{plan}=(awaitreq.json())as{plan:PlanKey};// 1. Validate the plan key against a server-side allowlistif (!Object.hasOwn(PLANS,plan)){returnnewResponse("Invalid plan",{status:400});}// 2. Look up the priceId server-side. Never accept it from the client.const{priceId}=PLANS[plan];constsession=awaitstripe.checkout.sessions.create({mode:"subscription",line_items:[{price:priceId,quantity:1}],success_url:`${origin}/success`,cancel_url:`${origin}/cancel`,});returnResponse.json({url:session.url});}
The client sends { plan: "premium" }. That’s the most they can influence. The mapping from "premium" to a real, server-controlled priceId is unforgeable. If the attacker sends { plan: "free_lifetime" }, the allowlist check rejects it. If they send { plan: "premium", amount: 100 }, the amount field is ignored. It doesn’t exist in the server’s logic.
For genuinely dynamic amounts (donations, custom one-off charges), you compute the amount on the server from inputs you’ve validated:
// Dynamic amount, still server-determinedconst{donationCents}=awaitreq.json();if (typeofdonationCents!=="number"||donationCents<100||donationCents>100000){returnnewResponse("Invalid amount",{status:400});}constsession=awaitstripe.checkout.sessions.create({mode:"payment",line_items:[{price_data:{currency:"eur",product_data:{name:"Donation"},unit_amount:donationCents,},quantity:1,},],// ...});
The user can choose the amount, but only within bounds you’ve defined. They can’t pass unit_amount: 1 if your minimum is 100.
How to verify you don’t have this bug
A two-minute self-audit:
# 1. Open your /pricing page. Click your most expensive plan.# Watch the Network tab when you hit "Subscribe" or "Buy".# 2. Find the request to your checkout-create endpoint. Copy it as cURL.# 3. Replay it with a tampered body. Change priceId, amount, plan name,# quantity, anything money-shaped:
curl -X POST https://yoursite.com/api/checkout
-H"Content-Type: application/json"-H"Cookie: <your auth cookie>"-d'{"plan":"premium","priceId":"price_FAKE","amount":1,"quantity":-1}'# 4. Check the response. If you got a Stripe Checkout URL, open it.# If the price shown is anything other than your real plan price, you have a bug.
If the resulting Stripe Checkout page shows the correct, original price regardless of what you sent, you’re safe. If it reflects the tampered fields, patch before you do anything else.
Three more places the same bug hides
Once “the server owns money-shaped values” clicks for you, you start seeing it everywhere.
1. Quantity. Same bug, different field. quantity: -1 in older Stripe versions caused weird negative-amount behavior. Validate quantity bounds explicitly.
2. Coupon / promo codes from client. If you let the client say “apply coupon XYZ,” the server has to verify XYZ is real, active, and applies to this plan for this user. Never just pass it through.
3. Customer ID. If the client sends { customerId } to attach the checkout to an existing Stripe customer, an attacker can swap their customerId for someone else’s. Always derive customerId from the authenticated session on the server.
The pattern: anything that influences money or attribution comes from authenticated server state, not from the request body.
The principle
Stripe is one of the safer payment APIs because it pushes you toward the right patterns most of the time. But it can’t enforce “client doesn’t send money values”. That’s on your code. The same principle applies anywhere the client shouldn’t have authority: authorization roles, feature flags, internal IDs, prices, plan tiers, expiration dates.
Think of a request body as a wish, not a fact. The server decides what to grant.
I run MatchResume.ai, a B2C SaaS with token-based pricing. Exactly the kind of product where this bug would have been embarrassing. The pattern above is what I wish every Stripe tutorial led with, instead of saving it for a footnote.
If you ship paid features and you’ve never tampered your own checkout request as a test, do it tonight. Two minutes, one curl, real peace of mind.