For any app, the database is the backbone of performance and reliability. As your user base grows and data accumulates, your database can become slow and inefficient. This is where database optimization comes in. Knowing when and why your app needs database optimization is crucial for maintaining speed, scalability, and a great user experience.
This article explains the signs that your app needs database optimization , the benefits it brings, and best practices for getting started.
“Database optimization isn’t just a technical chore—it’s a strategic move that keeps your app fast, reliable, and ready to scale.”
What Is Database Optimization?
Database optimization refers to the process of improving the efficiency and performance of your database. This can include tuning queries, adding indexes, cleaning up unused data, and adjusting configuration settings.
The goal is to ensure your app responds quickly, uses resources efficiently, and can handle growth without performance issues.
When Does Your App Need Database Optimization?
Here are the most common signs that your app needs database optimization :
Slow Query Response: Users notice delays when loading data or submitting forms.
High Resource Usage: Your database server uses excessive CPU or memory.
Frequent Timeouts: Queries fail or time out during peak usage.
Scaling Challenges: Your app struggles to support more users or larger datasets.
Increased Hosting Costs: High resource usage leads to higher cloud or server bills.
If you see any of these signs, it’s time to consider database optimization.
“Waiting for your app to slow down before optimizing is like waiting for your car to break down before changing the oil.”
Why Optimize Your Database?
There are many reasons why database optimization is essential for your app:
Improved Performance: Faster queries mean a smoother user experience.
Greater Scalability: Optimized databases handle more users and data efficiently.
Reduced Costs: Efficient databases use fewer resources, lowering hosting and infrastructure costs.
Better Reliability: Fewer timeouts and errors mean more stable app operation.
Enhanced Security: Clean, well-organized databases are easier to secure and maintain.
By optimizing your database, you ensure your app remains competitive and responsive as it grows.
Here are the main benefits of database optimization for your app:
Speed: Users experience faster load times and more responsive features.
Scalability: Your app can grow without performance bottlenecks.
Cost Savings: Efficient databases reduce server and cloud costs.
User Satisfaction: A fast, reliable app keeps users happy and engaged.
Easier Maintenance: Well-optimized databases are simpler to manage and troubleshoot.
“A well-optimized database is the foundation of a high-performing, scalable app.”
Best Practices for Database Optimization
Here are proven strategies for database optimization :
Indexing: Add indexes to frequently queried columns for faster searches.
Query Tuning: Rewrite slow queries to be more efficient.
Regular Maintenance: Clean up unused data, update statistics, and defragment tables.
Configuration Tuning: Adjust database settings for your workload and hardware.
Monitoring: Use tools to track performance and spot issues early.
Scaling: Use sharding, replication, or cloud scaling to handle growth.
Following these practices helps your app stay fast and reliable.
How FlexyTasks.dev Supports Database Optimization
FlexyTasks.dev provides tools for managing database optimization tasks and tracking progress. Whether you’re tuning queries, scheduling maintenance, or monitoring performance, FlexyTasks helps you stay organized and efficient.
With FlexyTasks, you can:
Assign and track optimization tasks.
Monitor database performance metrics.
Collaborate with team members on optimization projects.
It’s a valuable tool for keeping your database healthy and your app running smoothly.
Frequently Asked Questions (FAQs)
When should I optimize my app’s database?
Optimize your database when you notice slow queries, high resource usage, or scaling challenges.
Why is database optimization important for apps?
Database optimization improves app speed, reliability, scalability, and user experience.
What are the signs my database needs optimization?
Slow query response, high CPU or memory usage, and frequent timeouts indicate optimization is needed.
How does database optimization help app scalability?
Optimized databases handle more users and data efficiently, supporting growth without performance drops.
Can database optimization reduce hosting costs?
Yes, efficient databases use fewer resources, lowering hosting and infrastructure costs.
Conclusion
Database optimization is essential for keeping your app fast, reliable, and scalable. By understanding when and why your app needs database optimization , you can proactively address performance issues and deliver a better experience for your users.
Tools like FlexyTasks.dev make it easier to manage optimization tasks and track progress, ensuring your database remains healthy and efficient.
Look, I’ll be real with you. JavaScript’s Date object is a disaster.
Every time I needed to format a date, I’d find myself Googling “javascript format date” for the hundredth time. Every time I needed to do date math, I triple-checked the math because I didn’t trust how it handled months. Don’t even get me started on trying to add days to a date without accidentally mutating the original.
After years of this nonsense, I finally went for it. I was working on a project that needed a lot of date manipulation, and I realized I was spending more time wrestling with dates and building composable functions than actually building features. So I did what any self-respecting developer would do: I built my own solution.
Enter WristWatch
WristWatch is my answer to JavaScript’s date problems. It’s a tiny library (less than 10KB) with zero dependencies that wraps the native Date API in a way that actually makes sense (at least to me).
Here’s the thing: I didn’t want to build some massive framework like Moment.js. I just wanted something that would let me:
Format dates without checking the docs every time
Do date math without crying
Remember function names without a PhD in JavaScript archaeology
Not accidentally mutate dates and break everything
The Fun Parts
Months That Make Sense
This was the first thing I fixed. Native Date.getMonth() returns 0-11. This is because it’s based on Java’s old date API and I’m actually cool with that. However, I still needed to account for the zero-based months in my code. In WristWatch, months are 1-12 like a normal human would expect:
constdate=newWristWatch('2025-12-05');date.getMonth();// 12 (December, not 11!)
Formatting That Doesn’t Suck
Want to format a date? Just tell it what you want:
Everything’s immutable, so you can’t accidentally mess up your original date. And it handles all the annoying edge cases like “what happens when I add a month to January 31st?” (Answer: you get February 28th, not March 3rd.)
Comparisons That Don’t Make You Think
Need to check if one date is before another? Just do it:
if (tomorrow.isAfter(today)){console.log('Tomorrow is in the future!');}if (date.isBetween(start,end)){console.log('Date is in range!');}
No timestamp subtraction, no mental math, just straightforward comparisons.
The Technical Bits
Zero Dependencies
I hate bloat. WristWatch has exactly zero dependencies. It’s just a thin wrapper around the native Date API, which means it’s fast, reliable, and won’t break when some random dependency decides to deprecate itself. F*ck yeah.
Fully Typed
Written in TypeScript from the ground up. Every function, every parameter, everything is typed. F*ck yeah.
Tree-Shakeable
Only import what you need. Want just the formatting functions? Import just those. F*ck yeah.
I didn’t want to recreate the original, I wanted to iterate on it. Wrist-Watch is a wrapper so it still reminds you of the old ways. I also didn’t want to try to compete with popular methods. I just made what I need. F*ck yeah.
Actually Tested
I used property-based testing with fast-check to make sure everything works. Hundreds of random test cases running through every function. The code is also open, so test anything I missed. F*CK YEAH.
The Real Talk
Here’s the thing about building a date library: everyone tells you not to do it. “Just use Moment!” they say. “Just use date-fns!” they say.
But Moment is deprecated. date-fns is great but it’s huge. And honestly? Sometimes you just want something simple that does exactly what you need without importing half of npm.
WristWatch isn’t trying to be everything to everyone. It’s trying to be the library I wish existed. Small, focused, and actually pleasant to use.
Want to Try It?
npm install @lukelowers/wrist-watch
The GitHub repo has full docs and examples. PRs welcome if you find something broken or want to add a feature.
Did I over-complicate this? IDK, probably. Did I enjoy building it? Definitely. Will I use it in every project from now on? F*ck yeah.
Sometimes you just need to scratch your own itch. This was mine.
Every Go application uses resources, such as files, network connections, HTTP responses, and database query results. But when a resource is left unclosed, it can cause a leak, which drains memory, exhausts system limits, introduces subtle bugs, and eventually brings even the most robust service to failure. Recently, we’ve introduced resource leak analysis in GoLand to address this problem and help you detect unclosed resources before they cause leaks in production.
What is a resource leak?
A resource is any entity that holds an external system handle or state that must be explicitly closed when it’s no longer needed. In Go, such types typically implement the io.Closer interface, which defines a single Close() method for cleaning up underlying resources.
Here are some common implementations of io.Closer:
*os.File: an open file descriptor obtained via functions like os.Open and os.Create.
net.Conn: a network connection (TCP, UDP, etc.) created by net.Dial, net.Listen.Accept, or similar functions.
*http.Response: the response object returned by http.Get, http.Post, and similar functions. Its Body field is a resource because it implements io.ReadCloser.
*sql.Rows and *sql.Conn: database query results and connections.
A resource leak occurs when one of these resources isn’t properly closed after use. In such cases, they continue to occupy memory and other limited system resources such as file descriptors, network sockets, or database connections. Over time, all the open resources may lead to performance degradation, instability, or even application failure.
The more you know…
Can’t Go’s garbage collector handle this? After all, it automatically frees unused memory, so why not resources, too? Go’s garbage collector (GC) is designed specifically to reclaim memory, not to manage external resources like open files or network connections. In some rare cases, it can help. For example, in the standard library, a finalizer can be set to call Close() when a file becomes unreachable. However, this technique is used only as a last resort to protect developers from resource leaks, and you can’t rely on it completely. Garbage collection is non-deterministic. It might occur seconds or minutes later, or not at all, leading to system limits being reached. That’s why the only safe and reliable way to avoid leaks is to explicitly close every file or connection as soon as you’re done with it.
Tips to prevent resource leaks
What can you do to prevent resource leaks in Go applications? A few consistent habits can help you minimize them.
Tip 1: Use defer to close resources
The defer statement ensures that cleanup happens even if a function returns early or panics. As shown in the example below, we close the created resource right after successfully opening it using defer f.Close(), which is one of the simplest and most effective ways to avoid resource leaks.
Since the defer statement executes after the surrounding function’s return, you must handle errors first and only then defer the resource closure. This ensures that you don’t defer operations on invalid or uninitialized resources. Also, avoid placing defer inside loops that create many resources in succession, as this can lead to excessive memory usage.
Tip 2: Test your application under load
Most resource leaks affect your application only under high load, so it’s a good idea to run load and stress tests to see how it behaves. For example, if you’re developing a backend service, you can use load-testing tools likek6,wrk, Vegeta, or others. This testing helps you uncover not only potential resource leaks but also performance bottlenecks and scalability issues before they affect your users.
Tip 3: Use static code analysis tools
Static analysis tools can also help you automatically detect unclosed resources in your code. For instance, golangci-lint includes linters such as bodyclose and sqlclosecheck, which track HTTP response bodies and SQL-related resources to ensure you haven’t forgotten to close them.
Resource leak analysis in GoLand 2025.3 takes this a step further. It scans your code as you write it, verifies that resources are properly closed across all execution paths, and highlights any potential issues in real time. Getting this feedback right in your IDE helps you catch leaks early. Moreover, it works with any type that implements io.Closer, including your custom resource implementations.
When one missing Close() breaks everything
Are resource leaks really that critical? Let’s take a look at two common cases to see how a single missing Close() call can cause serious issues or even break your application over time.
Case 1: Leaking HTTP response bodies
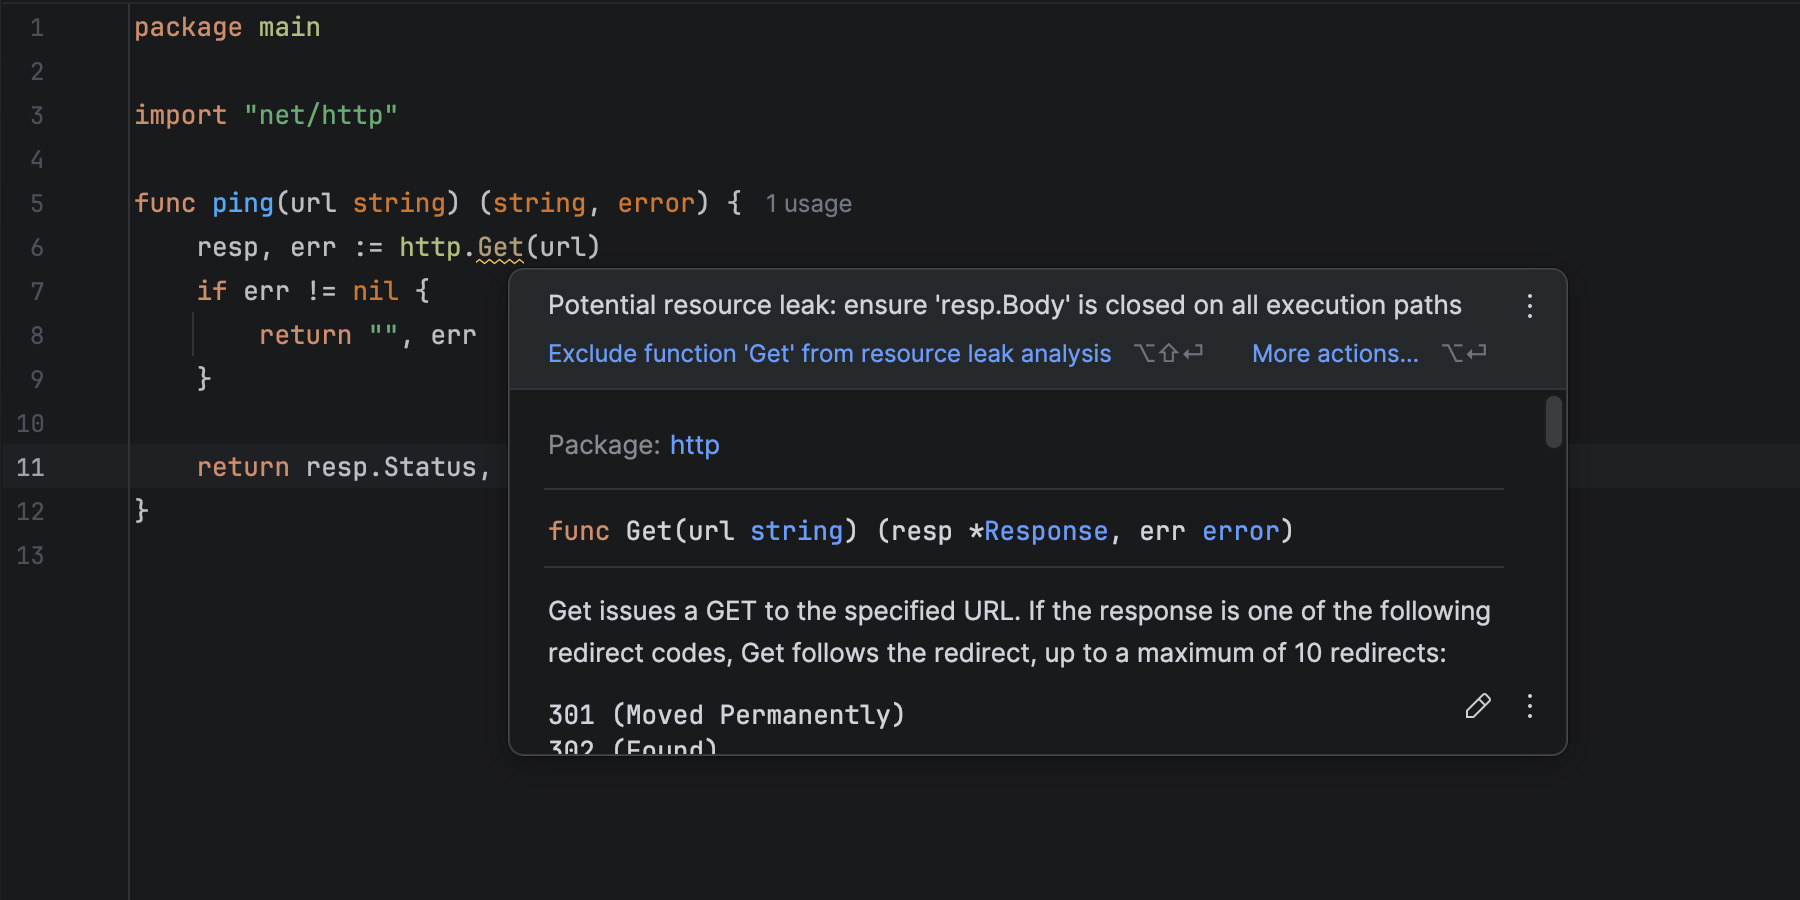
Sending HTTP requests is a common practice in Go, often used to fetch data from external services. Suppose we have a small function that pings an HTTP server:
When you write code like this, GoLand warns you about a potential resource leak because of an unclosed response body. But why does it do that? We aren’t even using the body in this example!
Well, let’s try running this code and see what happens. To simulate high-load conditions, we can call our function in a loop like this:
var total int
for {
   _, err := ping("http://127.0.0.1:8080/health")
   if err != nil {
      slog.Error(err.Error())
      continue
   }

   total++
   if total%500 == 0 {
      slog.Info("500 requests processed", "total", total)
   }
   time.Sleep(10 * time.Millisecond)
}
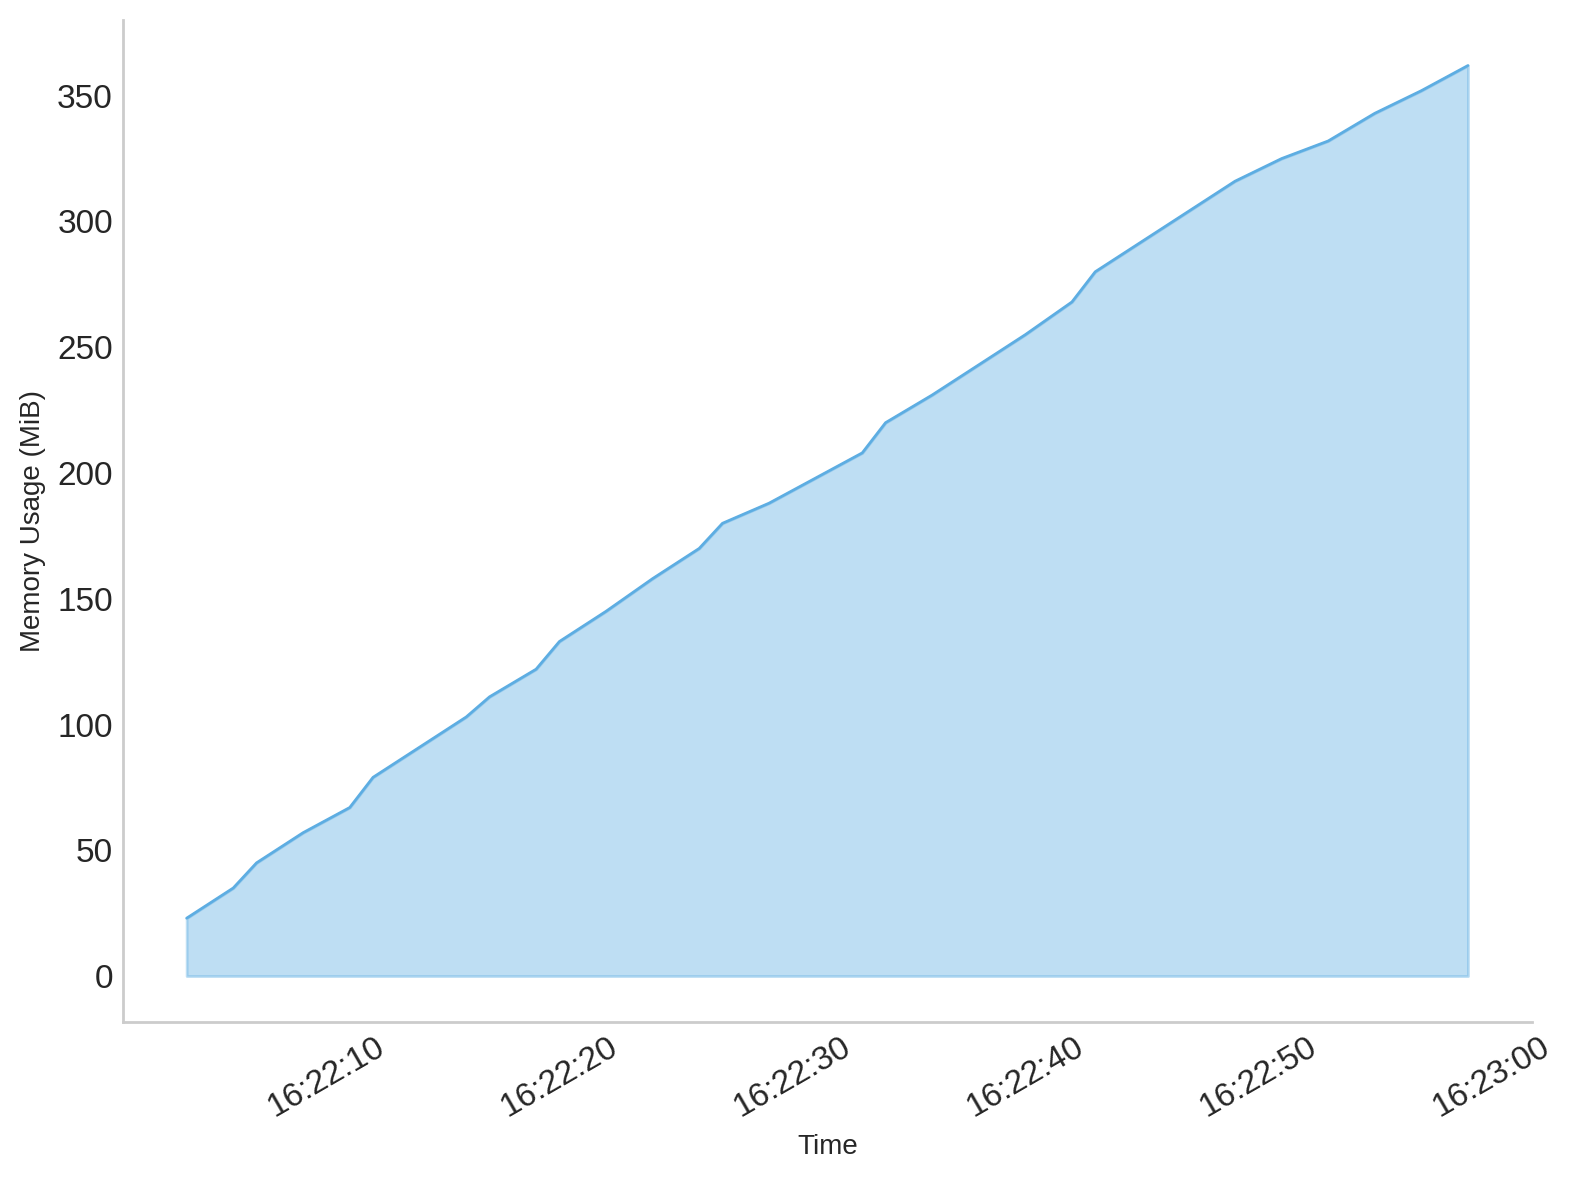
At first glance, everything seems fine – the client sends requests and receives responses as expected. However, if you monitor memory usage, you’ll notice that it gradually increases with every request the program sends, which is a clear indicator that something is wrong:
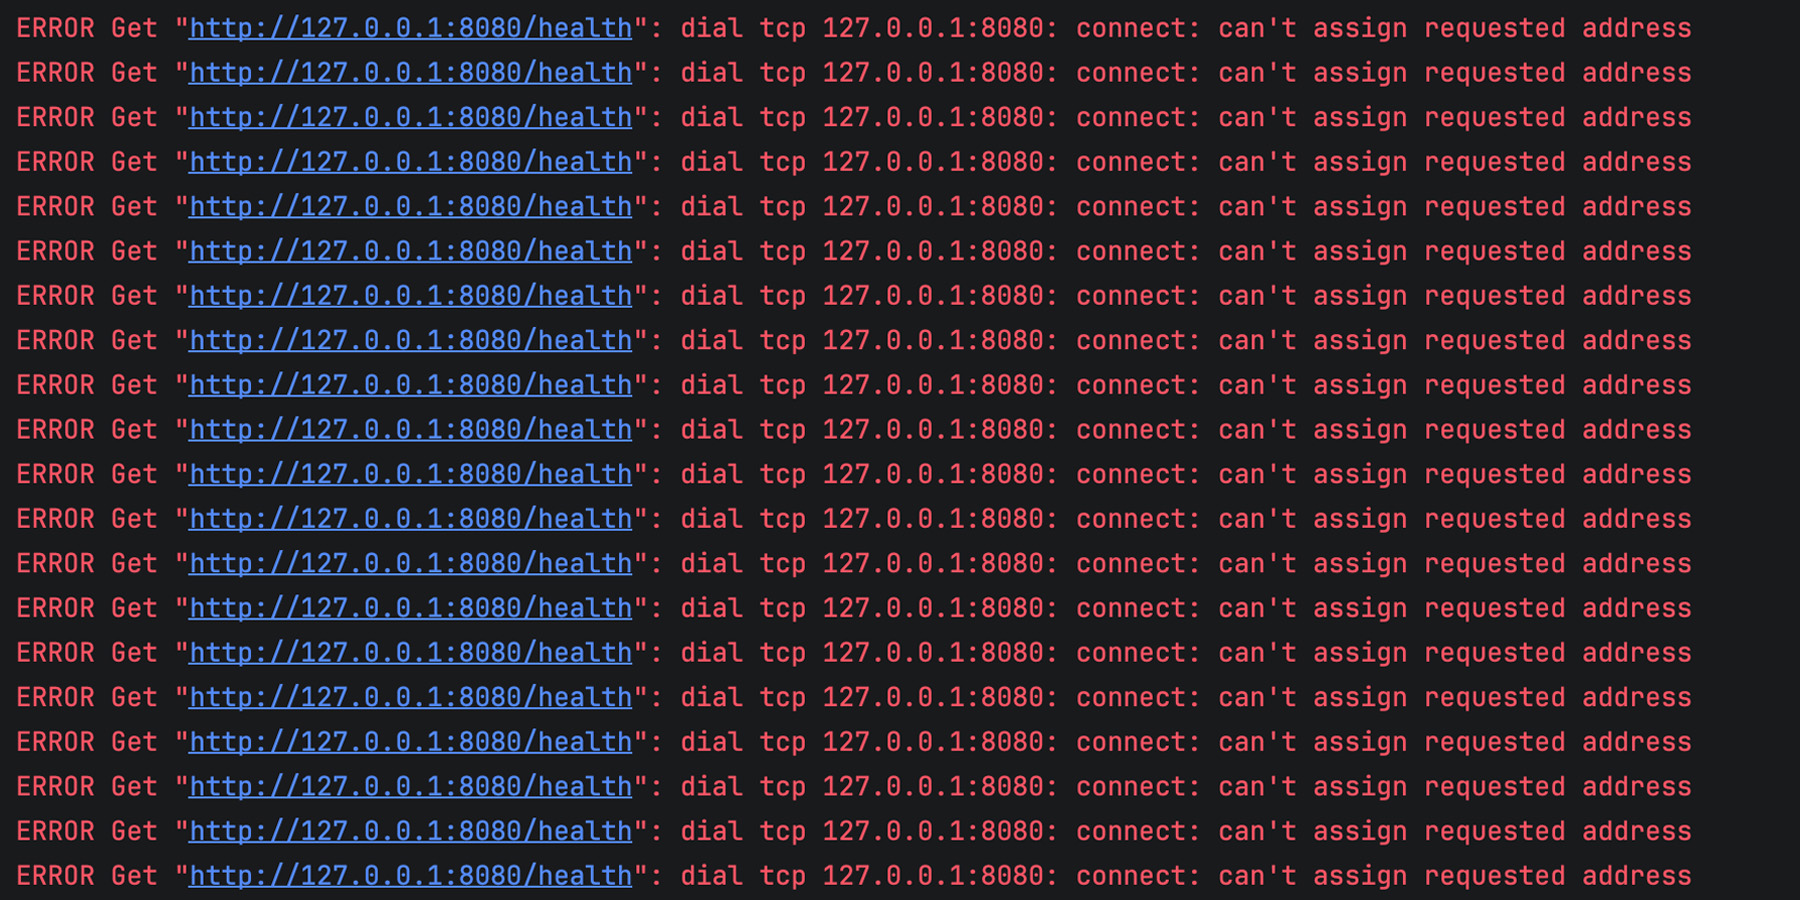
After some time, the client becomes completely unable to send new requests, and the logs start filling up with errors like this:
Why does this happen? When you make an HTTP request in Go, the client sets up a TCP connection and processes the server’s response. The headers are read automatically, but the body remains open until you close it.
Even if you don’t read or use the body, Go’s HTTP client keeps the connection alive, waiting for you to signal that you’re finished with it. If you don’t close it, the TCP connection stays open and cannot be reused. Over time, as more requests are sent, these unclosed connections accumulate, leading to resource leaks and eventually exhausting the available system resources.
That’s exactly what happens in our example. Each iteration of ping() leaves an open response body behind, memory usage grows steadily, and after a while, the client can no longer open new connections, resulting in the can’t assign requested address error.
Let’s correct the mistake and run the code again:
func ping(url string) (string, error) {
    resp, err := http.Get(url)
    if err != nil {
        return "", err
    }
    defer resp.Body.Close() // Important: close the response body

    return resp.Status, nil
}
After applying this fix, the memory footprint remains minimal, and you’ll no longer see the previous errors.
It’s worth mentioning that the code snippet above uses Go’s default http.Client for simplicity, which is generally not recommended in production. By default, it has no request timeout, so a slow or unresponsive server can cause requests to hang indefinitely, potentially leading to stalled goroutines and resource exhaustion. A better practice is to create a custom http.Client with reasonable timeouts to keep your application responsive and resilient under poor network conditions.
Case 2: Forgetting to close SQL rows
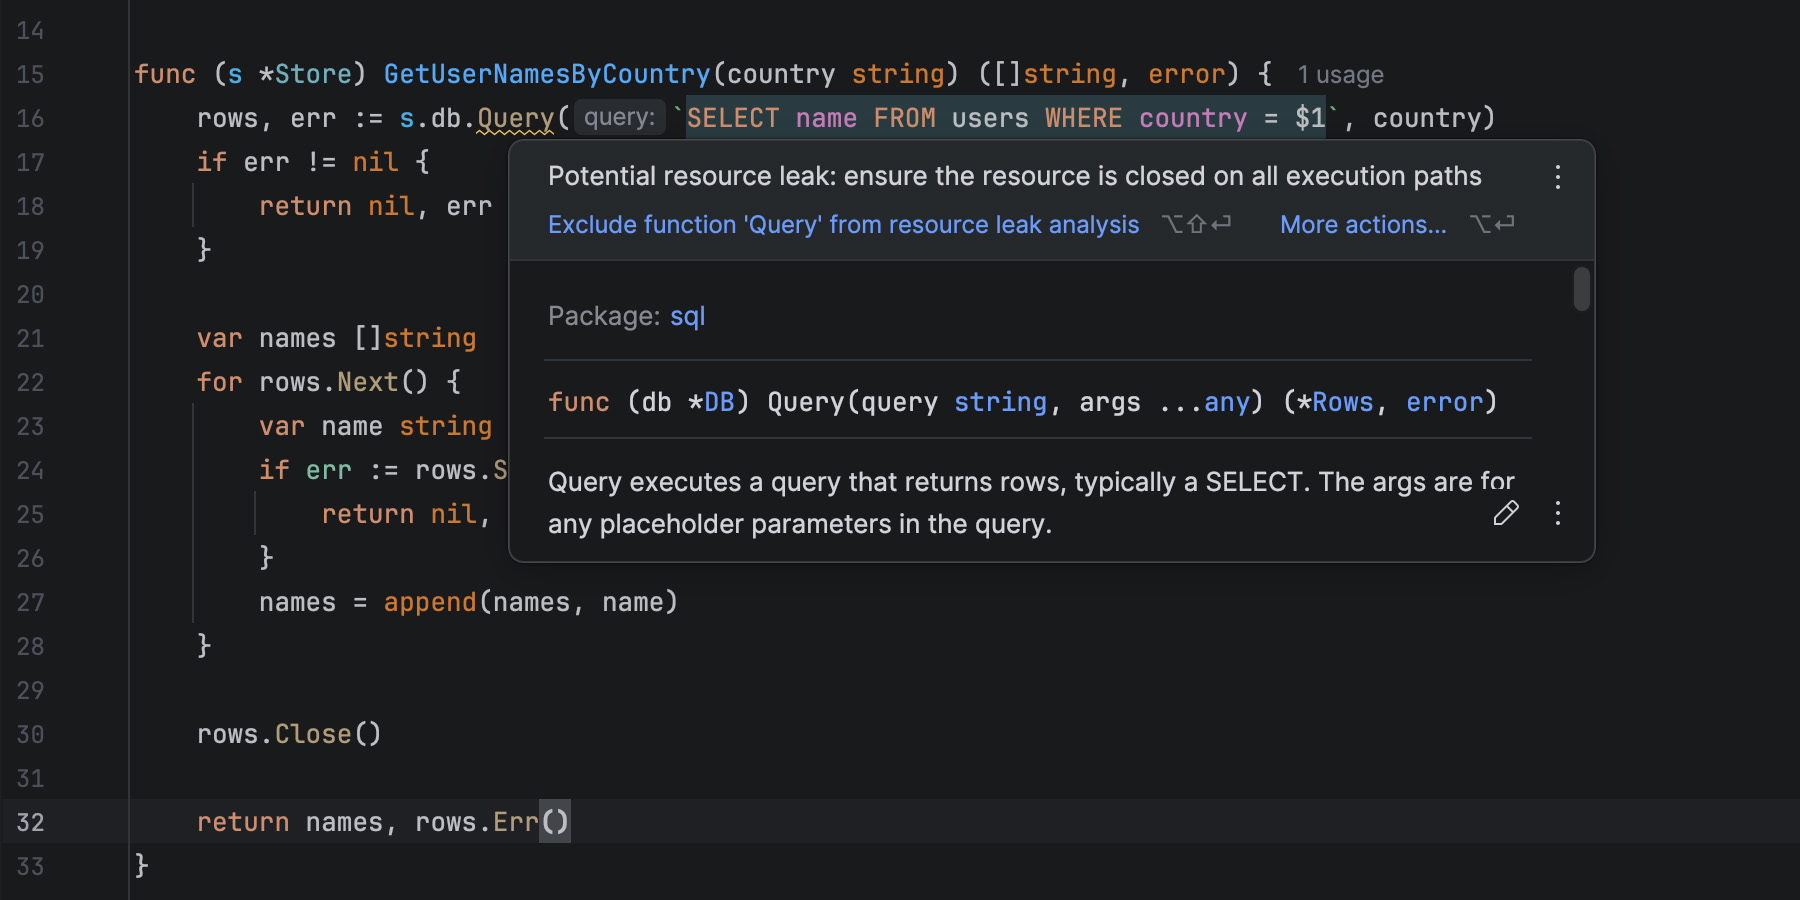
Another common and destructive source of leaks in Go applications involves database resources, particularly when using the standard database/sql package. Let’s take a look at a simple function that retrieves user names by country from a database:
func (s *Store) GetUserNamesByCountry(country string) ([]string, error) {
    rows, err := s.db.Query(`SELECT name FROM users WHERE country = $1`, country)
    if err != nil {
        return nil, err
    }

    var names []string
    for rows.Next() {
        var name string
        if err := rows.Scan(&name); err != nil {
            return nil, err
        }
        names = append(names, name)
    }

    rows.Close()

    return names, rows.Err()
}
Even though we call rows.Close() explicitly, GoLand still warns us about a possible leak. But why?
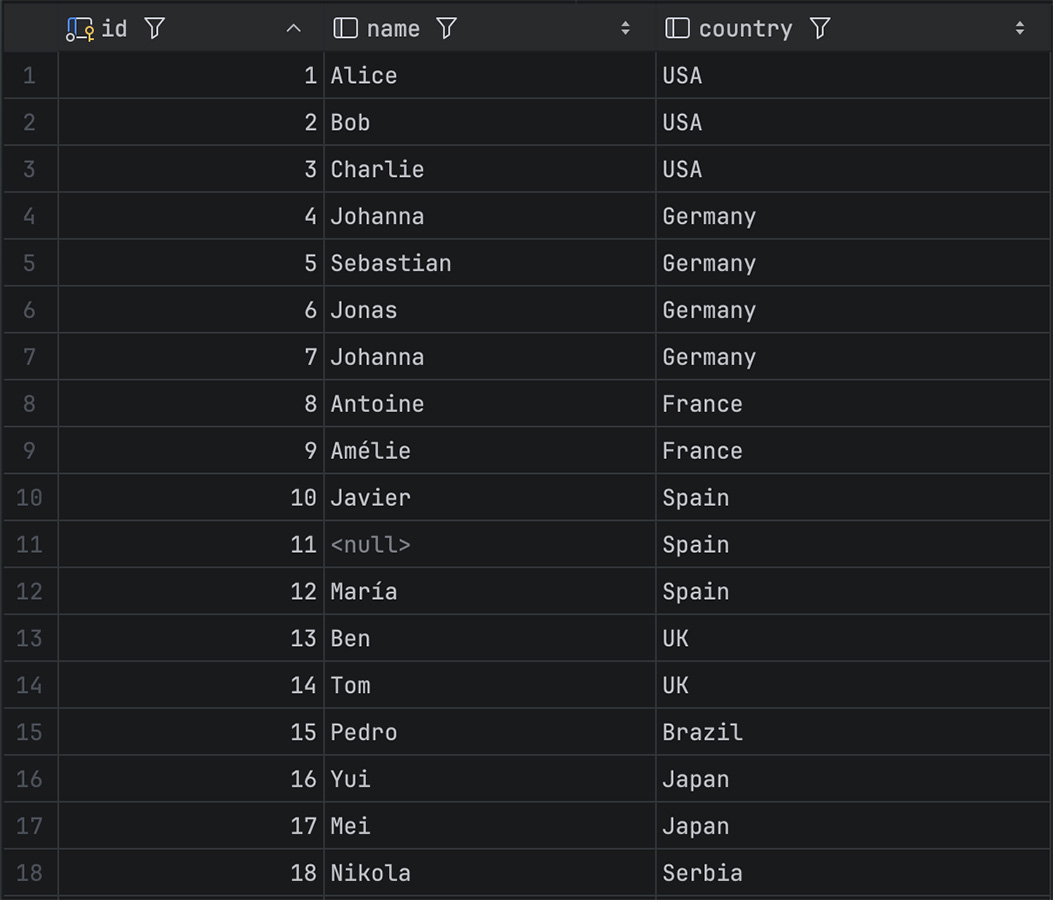
Let’s say our table looks something like this:
Have you spotted the problem? That’s right, there’s a user without a name. Мore precisely, there is a NULL instead of a string, and the GetUserNamesByCountry function doesn’t handle such cases properly. When rows.Scan tries to assign a NULL to a Go string variable, it returns an error. Issues like this can happen to anyone, and that nameless user probably ended up in our table by mistake. Still, it may seem that such a small issue couldn’t cause any dramatic consequences. After all, that’s exactly why we tried to handle errors properly, right?
Let’s simulate real conditions by calling the function with different input parameters in a loop:
var total int
for {
    for _, country := range countries {
        _, err := s.GetUserNamesByCountry(country)
        if err != nil {
            slog.Error(err.Error())
            continue
        }

        total++
        if total%100 == 0 {
            slog.Info("100 queries processed", "total", total)
        }
        time.Sleep(10 * time.Millisecond)
    }
}
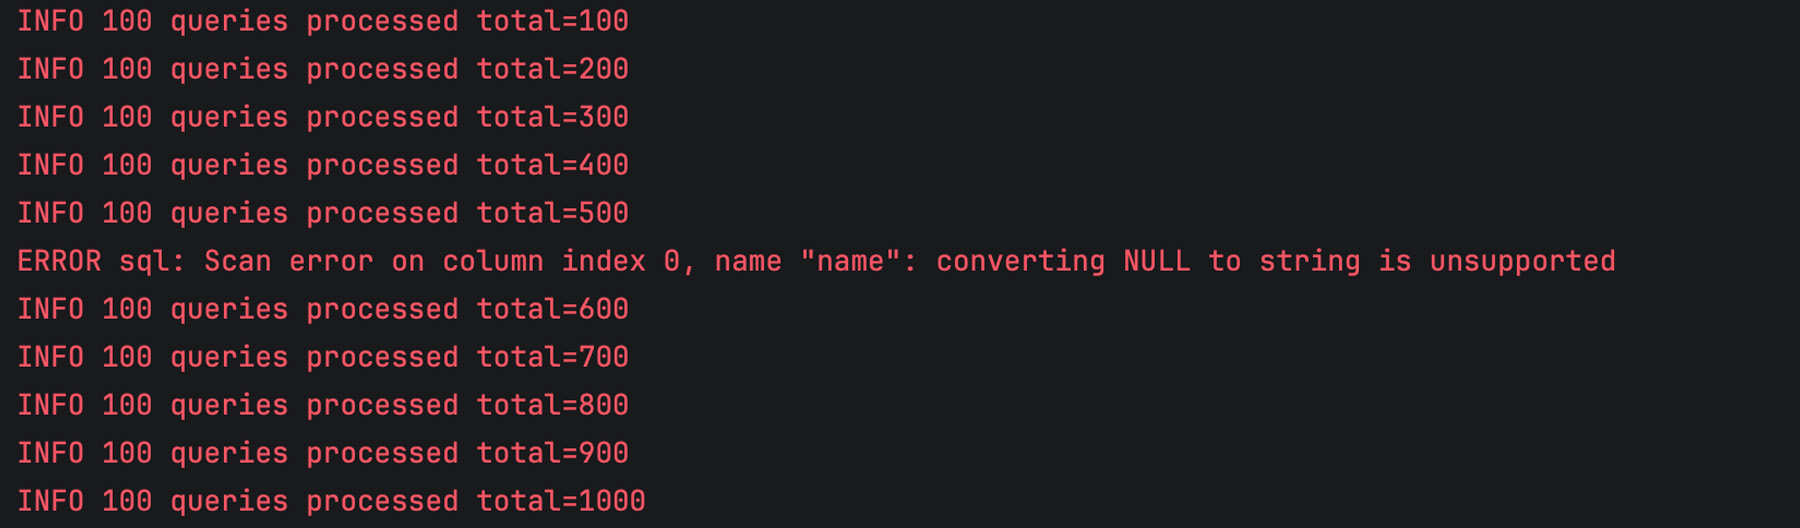
When we launch the program, everything seems fine, and we only get occasional errors as expected:
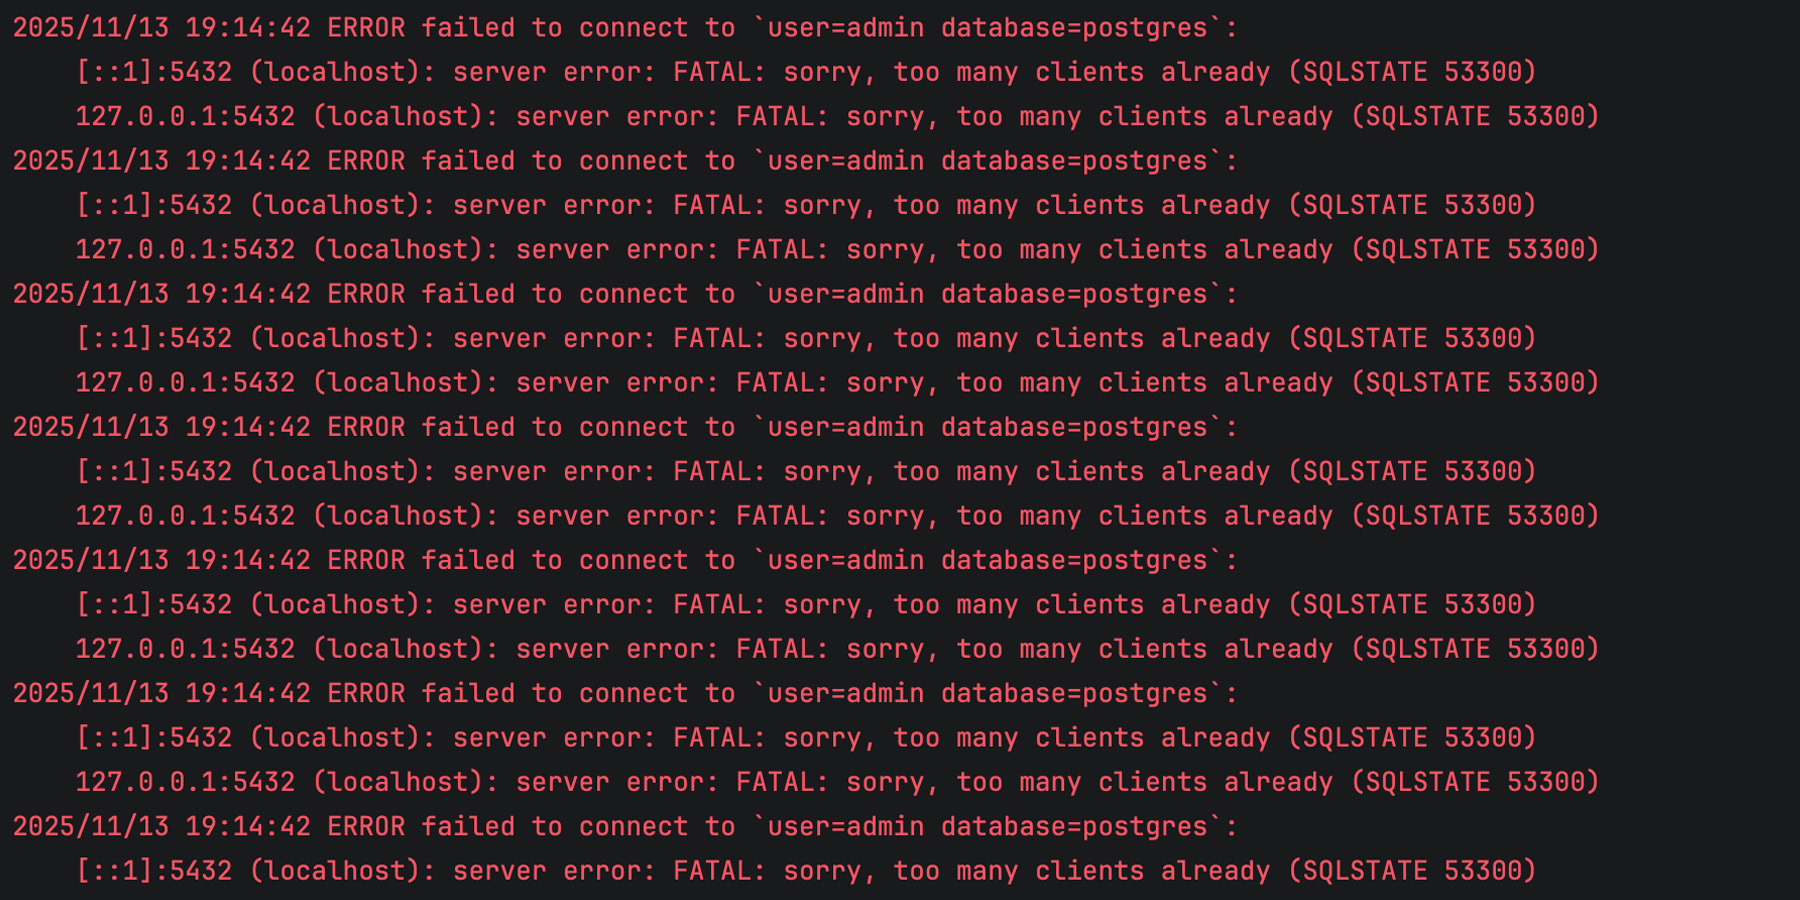
However, after running and processing SQL queries for some time, our program completely breaks down, and the logs are full of errors like this:
We’ve run out of client connections, and our application is unable to retrieve any data from the database!
The issue is that one of the execution paths in GetUserNamesByCountry leaves the query result unclosed when an error occurs during scanning. If rows is not closed, the corresponding database connection remains in use. Over time, this reduces the number of available connections, and eventually, the connection pool becomes exhausted. That’s exactly what happened in our case.
Surprisingly, just one incorrect row in our table is enough to take down the entire application, simply because we forgot to close the resource properly.
The best way to prevent this mistake is to use defer. As we discussed previously, this should be your preferred way of handling resources whenever possible:
func (s *Store) GetUserNamesByCountry(country string) ([]string, error) {
    rows, err := s.db.Query(`SELECT name FROM users WHERE country = $1`, country)
    if err != nil {
        return nil, err
    }
    defer rows.Close() // Important: close the rows using 'defer'

    var names []string
    for rows.Next() {
        var name string
        if err := rows.Scan(&name); err != nil {
            return nil, err
        }
        names = append(names, name)
    }

    return names, rows.Err()
}
Making the invisible visible
There are many ways a resource leak can creep into your program, and the examples above are just the tip of the iceberg. Such mistakes are easy to make and hard to trace. Your code compiles, tests pass, and everything appears to work, until your service slows down or starts failing under load. Finding the root cause can be time-consuming, especially in large codebases.
GoLand’sresource leak analysis makes these issues visible right where they start, as you write code. It tracks how resources are used across all execution paths and warns you if something might remain unclosed. This early feedback helps you quickly identify resources in your code and fix potential leaks right away.
The feature is especially helpful for beginners who are still learning the language and might not yet know which resources require explicit cleanup. Experienced developers benefit as well, since it saves time when working with unfamiliar codebases and custom types that implement io.Closer.
In essence, resource leak analysis turns a subtle, hard-to-detect problem into something you can catch instantly, helping you write more reliable and maintainable Go code.
Keeping your Go applications leak-free
Resource leaks are among the most subtle yet destructive bugs in Go applications. They rarely cause immediate crashes, but over time, they can silently degrade performance, create instability, and even bring down production environments.
By using defer consistently, testing under realistic load, and taking advantage of GoLand’s new resource leak analysis, you can catch these issues early and keep your applications stable and reliable. Try out the new feature in the latest GoLand release and let us know what you think!
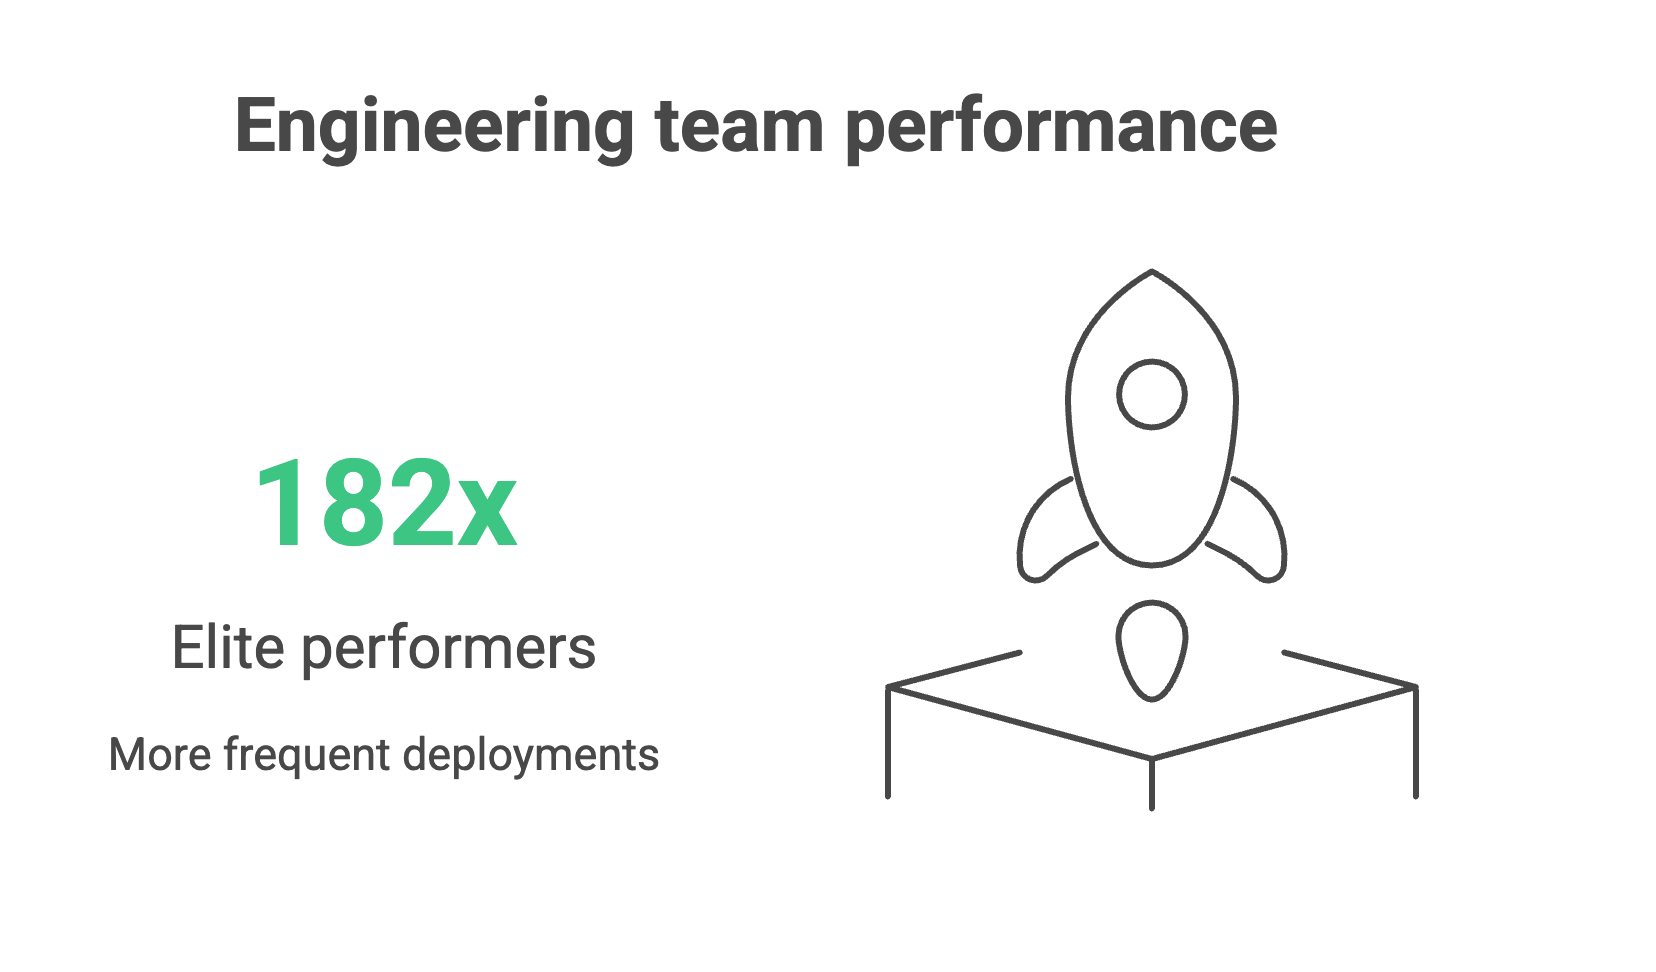
Every engineering leader would love to work with a team of elite performers who deploy 182x more frequently, recover from failures 2,293x faster, and achieve 127x faster lead times than low performers. (Yes, that’s the actual difference in performance of real teams from the 2024 DORA research report).
But how do you improve your team’s performance if you’re nowhere near the elite?
If you’re benchmarking against the four DORA metrics – deployment frequency, lead time for changes, change failure rate, and mean time to recovery – you’ll notice that bottlenecks tend to come from a combination of three things: people, processes, and tooling.
While teams tend to tackle process issues first, and rightly so, engineering leaders should ask whether their teams have the right tools to do their job well.
In fact, the root cause of several process and culture issues often stems from your tooling.
Your CI/CD platform shapes how teams work and how they feel about that work, which in turn affects your organization’s capacity for innovation and risk management. Manual configurations, brittle plugin ecosystems, and limited observability make it difficult to achieve strong DORA scores, regardless of how talented or motivated your teams are.
Teams can spend up to half of their effort maintaining tooling instead of delivering value, creating a “technical debt tax” that grows with every release cycle.
Modern CI/CD platforms with built-in automation, intelligent resource management, and comprehensive observability free engineers to focus on business logic and innovation, creating a compound advantage over time.
This article unpacks how your tooling affects each of the DORA metrics to help you determine whether your CI/CD setup is helping or hindering your team’s performance.
Deployment frequency: The velocity indicator
Deployment frequency measures how often application changes are deployed to production. In other words, how quickly can your teams get value into the hands of customers?
Organizations deploying multiple times per day can respond to customer feedback in hours, not quarters. They can experiment with features, validate market hypotheses, and pivot based on real user behavior while competitors plan their next monthly release.
Even if you don’t deploy daily, small, frequent deployments also reduce risk and build customer trust through continuous improvement rather than disruptive “big bang” releases.
Tooling’s impact on deployment
Legacy CI/CD systems create an invisible ceiling on deployment velocity because their architecture introduces scaling bottlenecks. They were designed around static servers, long-lived agents, and plugin ecosystems, which is fine for a handful of apps but fragile when hundreds of pipelines and contributors pile on.
As you scale, build jobs start queuing behind overloaded agents, plugin dependencies break under version mismatches, and pipelines stall while engineers debug infrastructure instead of shipping code. Even as you add more developers, deployment throughput plateaus because the underlying tool can’t keep pace.
Environmental management limitations amplify the problem. Legacy systems typically operate on static environments, which suffer from configuration drift and resource contention as more teams share them.
Conflicts that should be isolated instead spill across projects, forcing serialized releases and rework. What should be a smooth, automated pipeline turns into an error-prone coordination exercise.
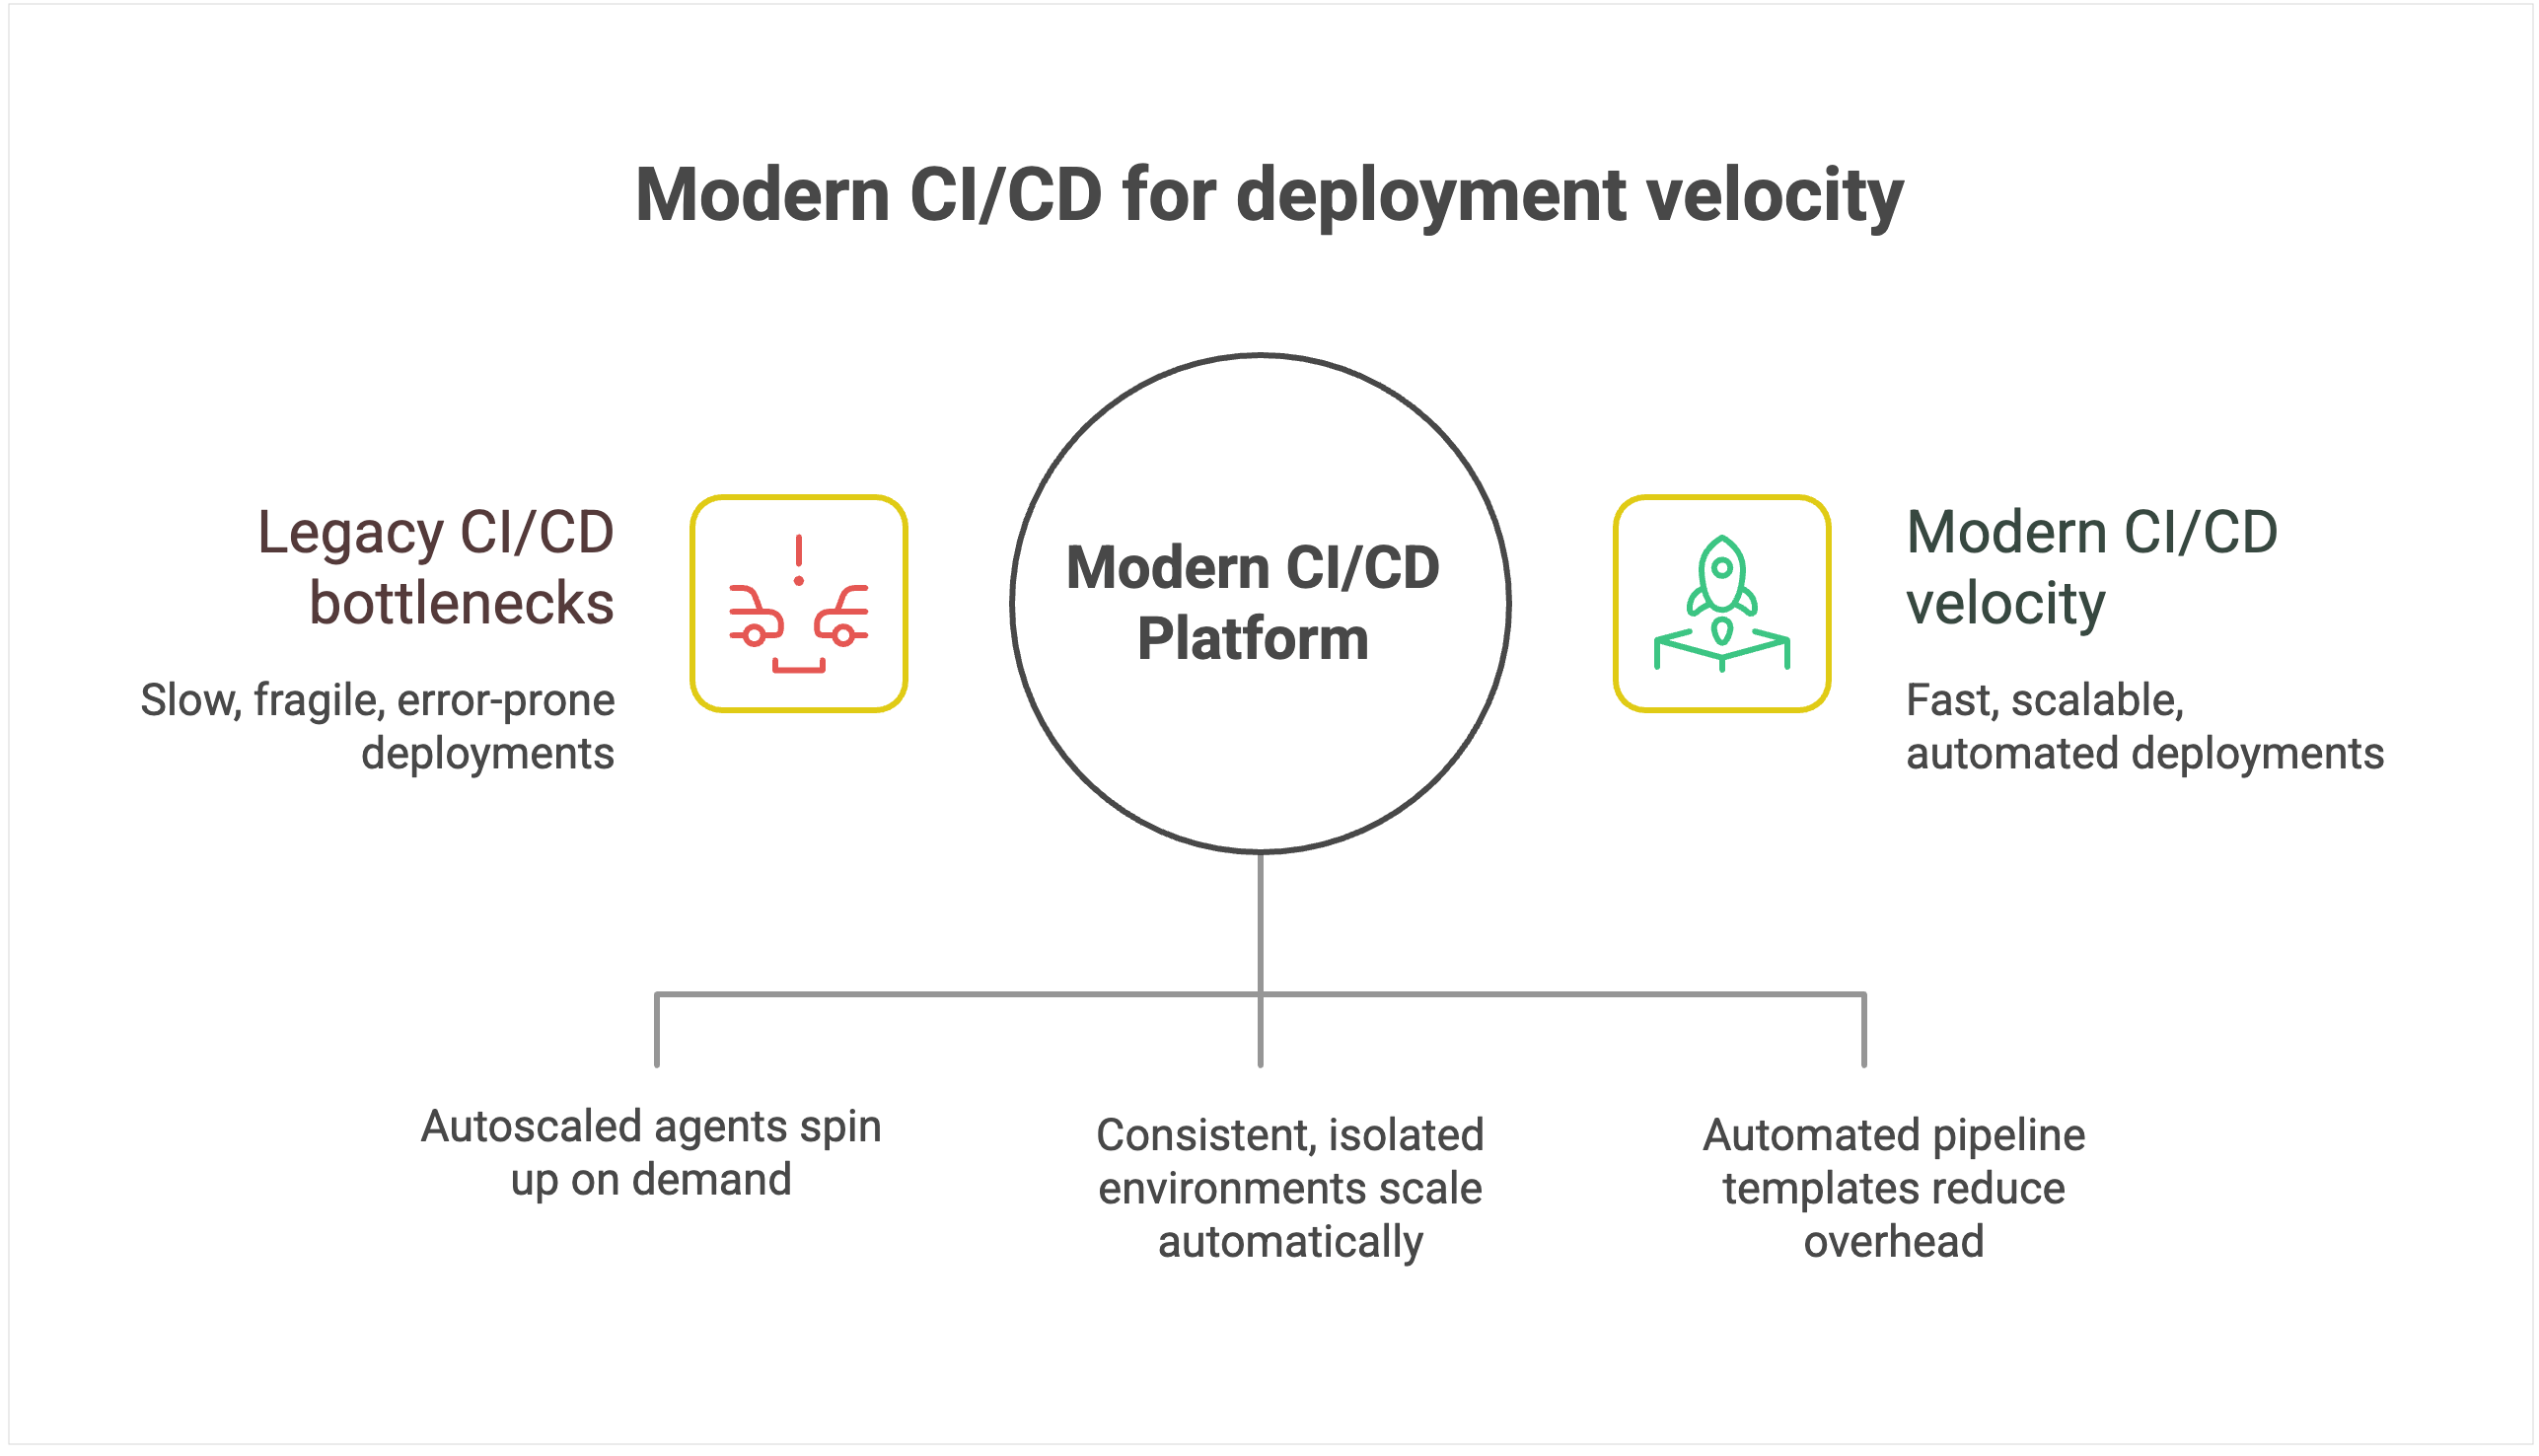
Modern CI/CD platforms with configuration as code and automated pipeline templates dramatically reduce maintenance overhead, allowing teams to provision new deployment pipelines in minutes rather than days.
For instance, TeamCity offers ephemeral, autoscaled build agents that spin up on demand in containers or cloud instances, then shut down cleanly when idle.
Intelligent environment orchestration with containerization support eliminates resource contention. Teams get on-demand access to consistent, isolated environments that scale automatically.
For example, TeamCity runs each build in an isolated container, with configuration declared in version-controlled Kotlin DSL, eliminating drift and ensuring consistency across runs.
Furthermore, smart resource allocation and parallel processing can optimize utilization during peak periods, while built-in scalability handles enterprise growth without degrading performance. This enables the platform to scale transparently while maintaining deployment velocity.
Lead time for changes: From code to customer value
While deployment frequency tells you how often you deliver, lead time for changes shows you how fast. It measures the duration from the moment the code is committed to when it’s running in production.
Why it matters
Elite performers achieve lead times of less than one hour, while low performers require between one week and one month to get code from commit to production.
Reduced lead time means faster time to market for new features and immediate response to competitive pressures. When a critical bug is discovered or a market opportunity emerges, organizations with hourlong lead times can respond the same day, while those with weeklong lead times watch opportunities pass by.
For development teams, shorter lead times create a virtuous cycle of productivity. Developers get faster feedback on their changes, can iterate more quickly, and spend less time context-switching between different features.
Tooling’s impact on lead time
CI/CD systems with manual configuration management create delays and increase the chances of human error. Each deployment often requires someone to manually verify settings, update configurations, and troubleshoot inevitable issues that arise from inconsistent environments.
Heavy reliance on custom scripts and plugins stretches lead time even further. New features or compliance requirements often demand bespoke scripts, which then have to be debugged, reviewed, and maintained.
Pipelines break whenever dependencies change or plugins fall out of sync, forcing developers to stop feature work and fix tooling instead. Instead of commits flowing quickly into production, changes queue up behind brittle automation, extending lead time and making delivery unpredictable.
The lack of intelligent resource allocation compounds these problems. Build queues grow during peak usage periods, forcing teams to wait for available resources. Without smart scheduling and parallel processing capabilities, even simple changes can sit idle for hours while the system processes other jobs sequentially.
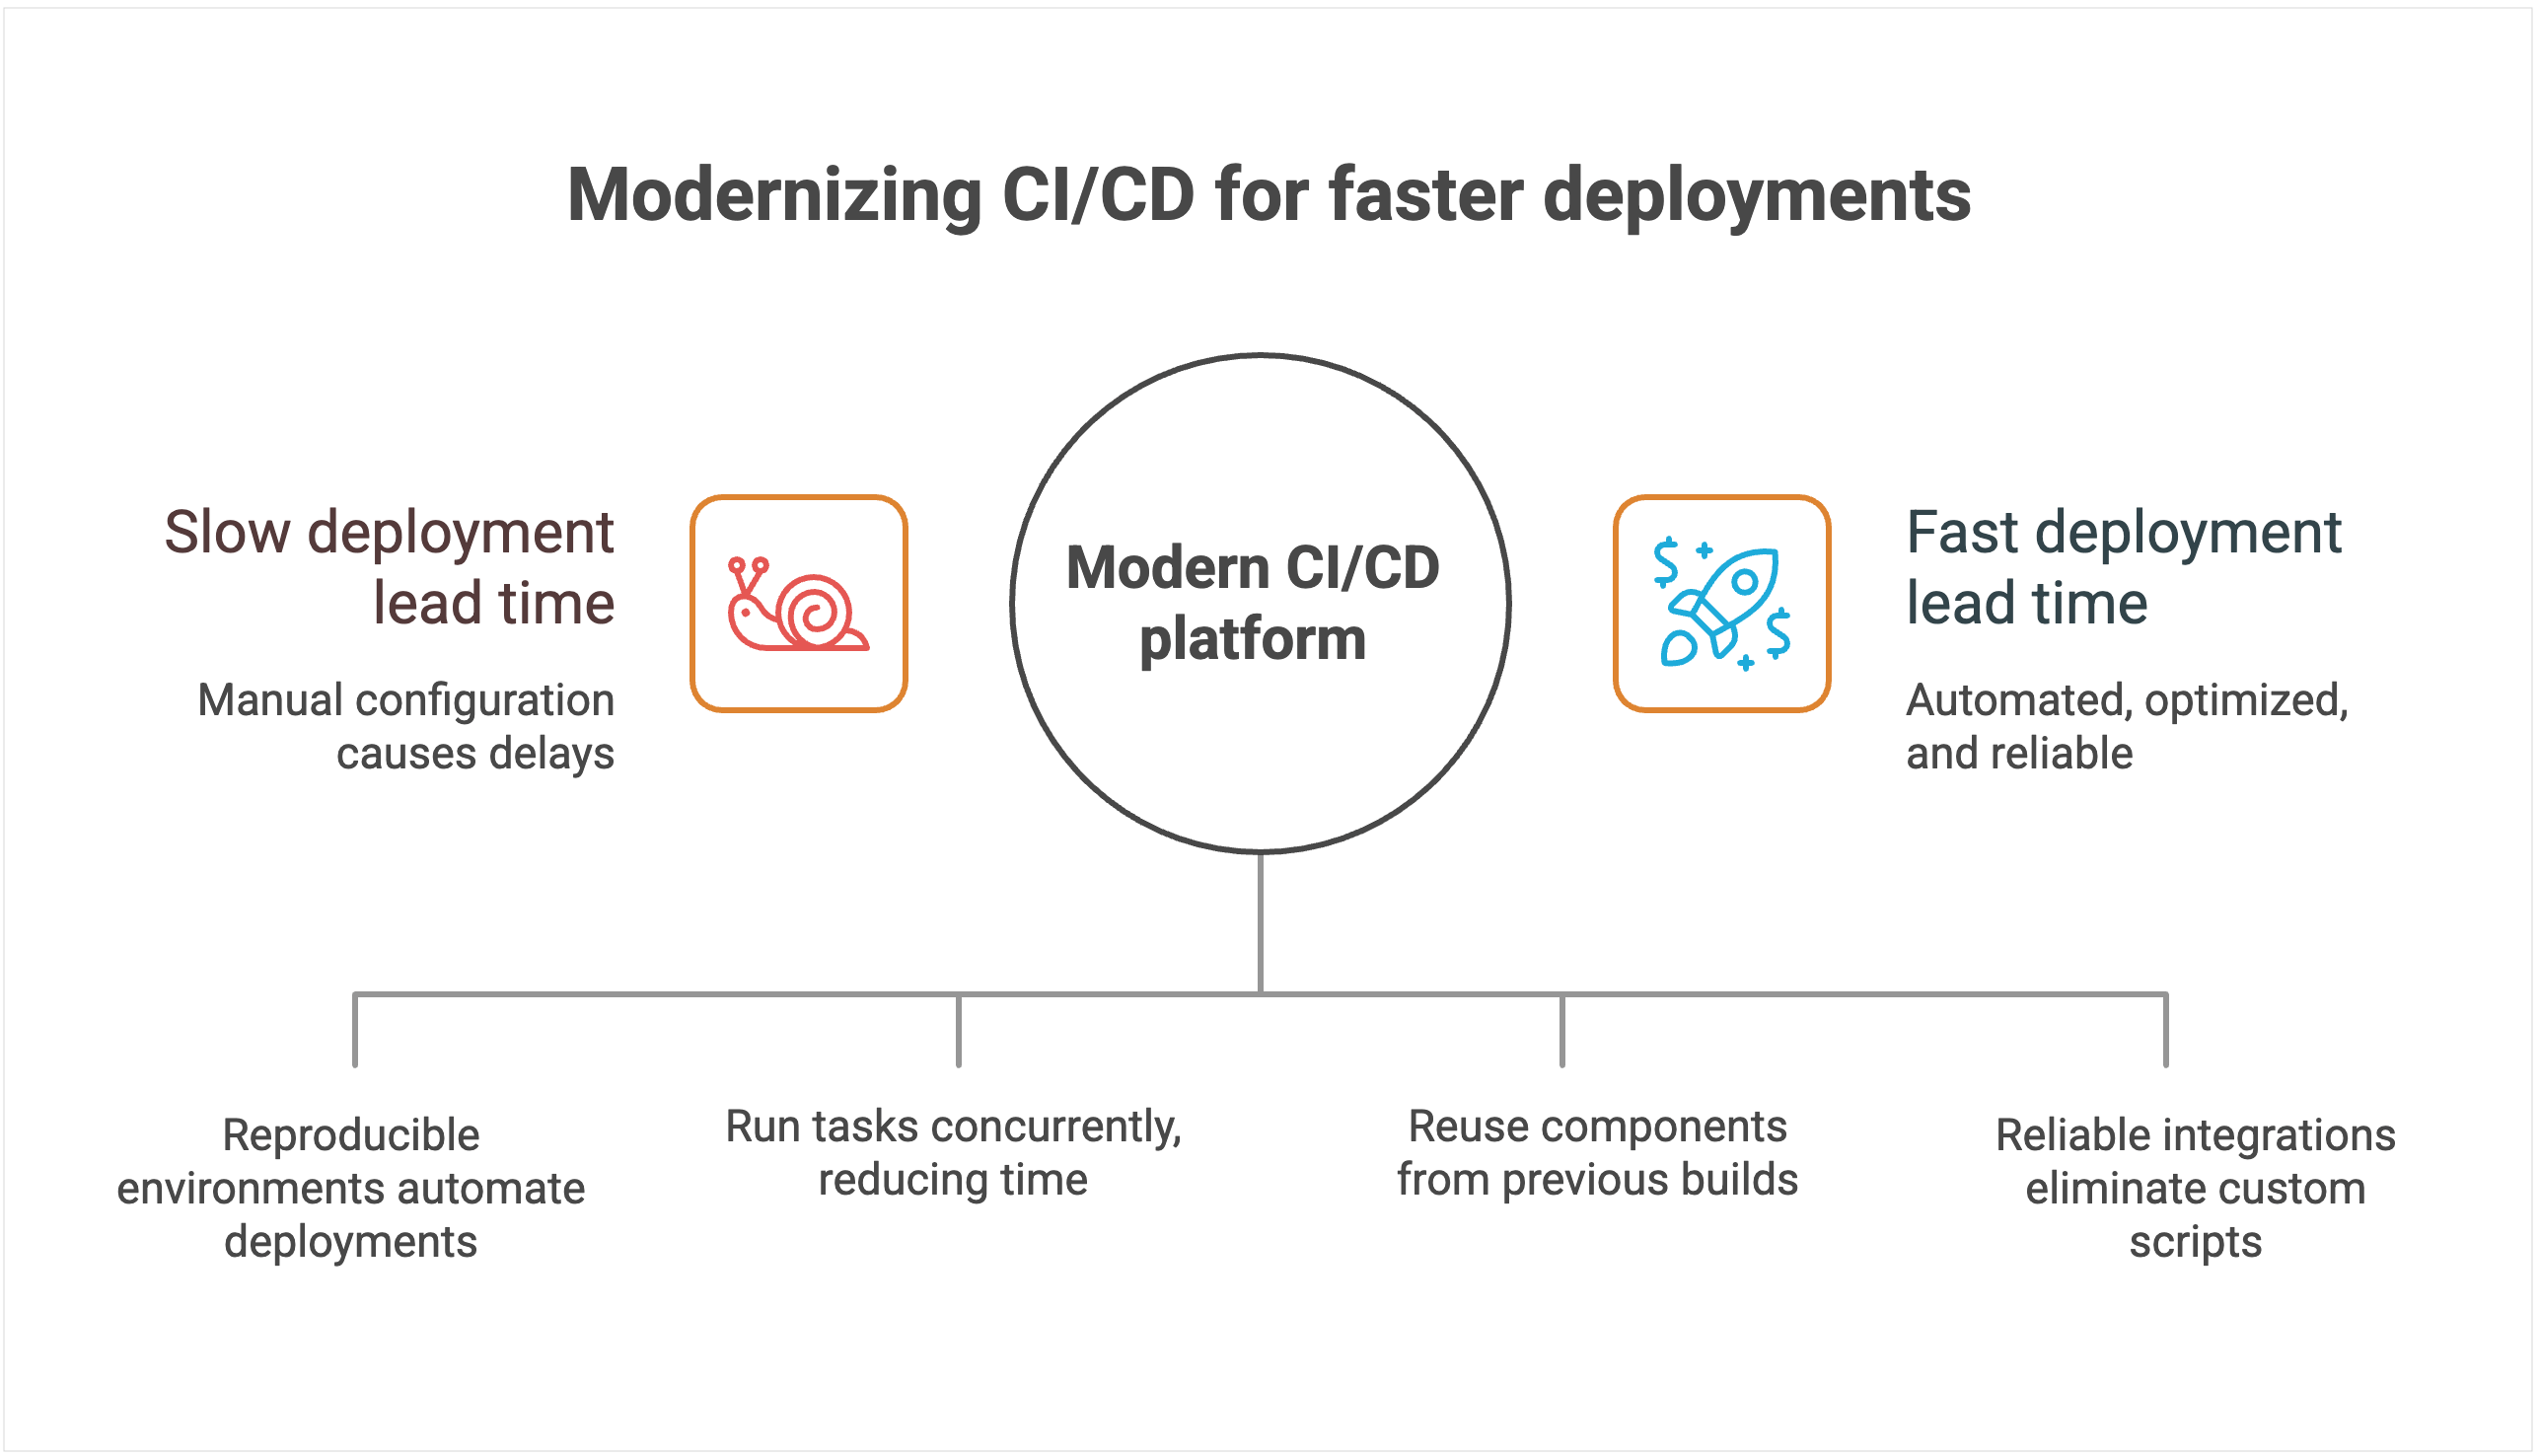
By contrast, modern platforms use declarative configuration and environment-as-code principles. Deployments land in reproducible environments automatically, cutting out manual checks and accelerating lead time.
Modern platforms are also architected to minimize lead time through intelligent automation and resource optimization.
For instance, TeamCity’s advanced parallel processing capabilities automatically identify opportunities to run tasks concurrently, dramatically reducing total pipeline execution time. Instead of waiting for sequential steps to complete, multiple processes run simultaneously whenever dependencies allow.
Native dependency management and intelligent caching eliminate redundant work. The platform automatically identifies which components have changed and which can be reused from previous builds, significantly reducing build times for incremental changes. This intelligence extends to test execution, where only relevant test suites run based on code changes.
Seamless integrations with modern development tools eliminate the custom scripting overhead. Instead of maintaining brittle connectors between disparate tools, teams get native integrations that work reliably without needing ongoing maintenance. Smart resource allocation and cloud bursting capabilities prevent queue delays by automatically scaling compute resources during peak usage periods.
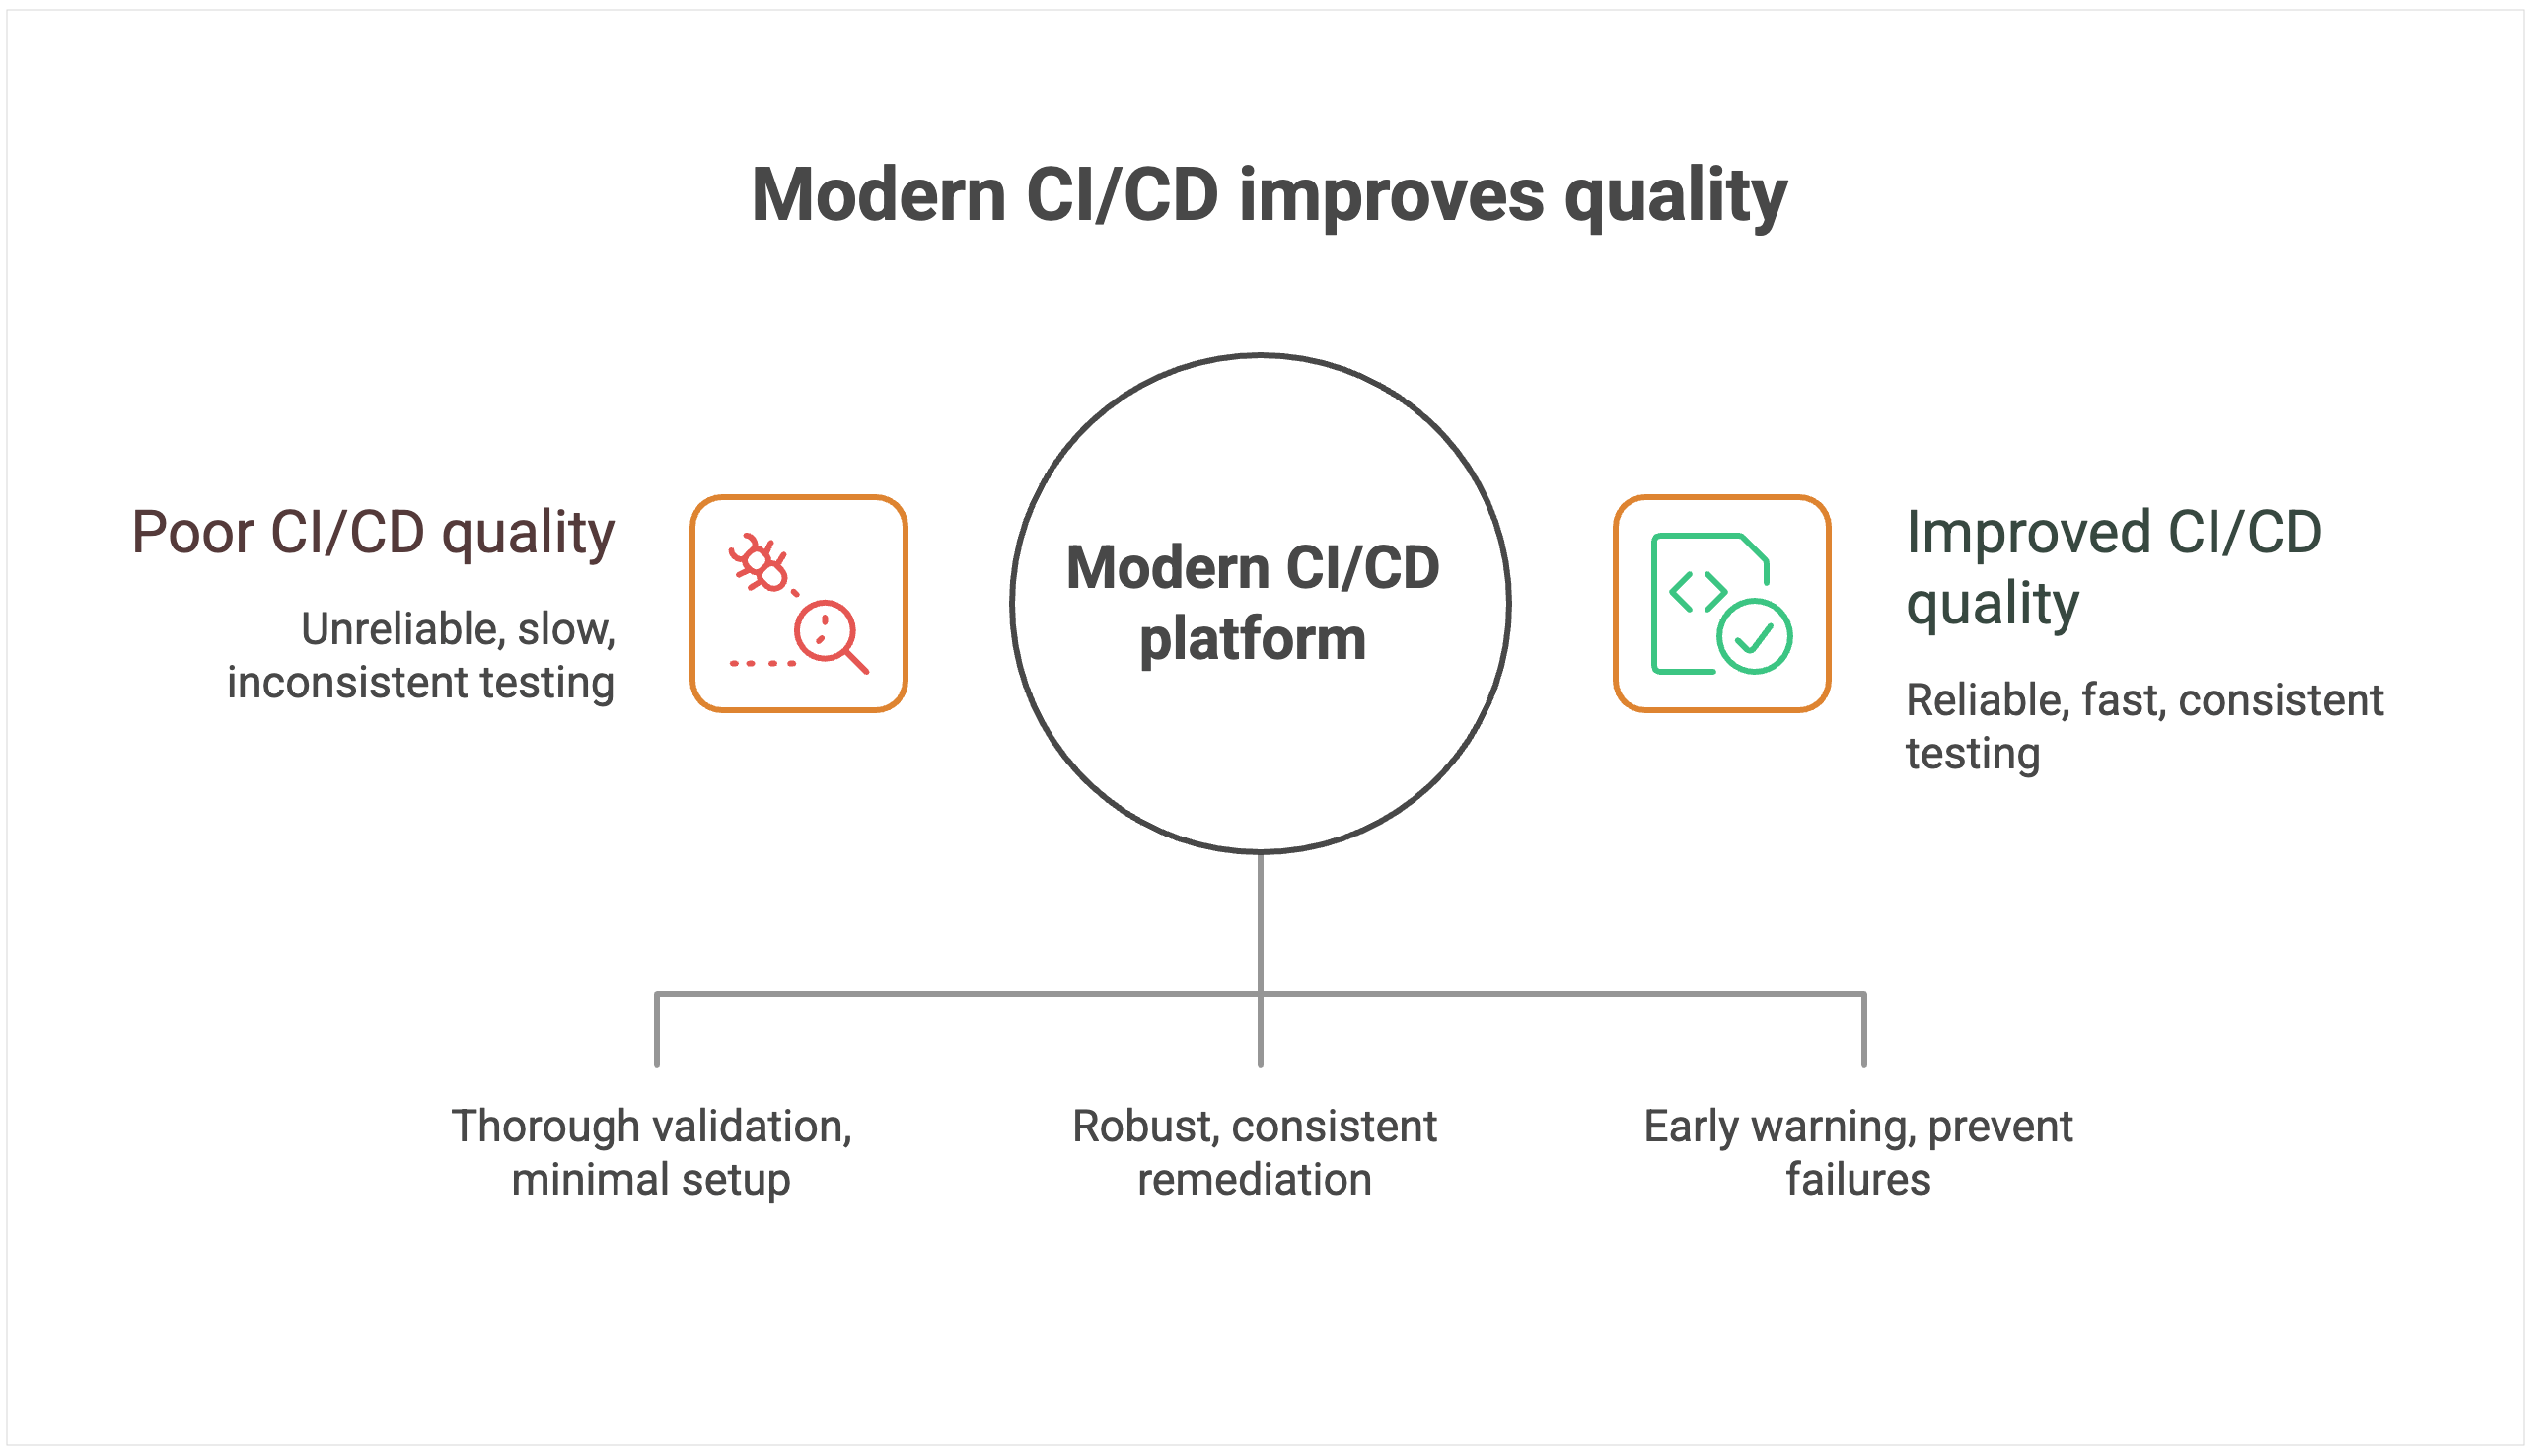
Change failure rate: Quality under pressure
Shipping faster is only an advantage if your releases are reliable. Change failure rate measures the percentage of deployments that require immediate remediation, whether through hotfixes, rollbacks, or patches. It captures both engineering quality and business risk.
The operational costs of failed deployments also compound quickly. Engineering teams must context-switch from planned work to emergency remediation. Customer support teams field complaints and escalations.
Sales teams face difficult conversations with prospects and existing customers. The ripple effects of a single deployment failure can impact organizational productivity for days.
Also, high change failure rates create a culture of fear around deployment. Teams become risk-averse, deploy less frequently, and accumulate technical debt. This defensive approach makes the system more fragile and failures more catastrophic when they do occur.
Tooling’s impact on quality
CI/CD systems with limited native-testing-integration capabilities force teams to rely heavily on third-party plugins and custom integrations. Each plugin introduces potential failure points, version-compatibility issues, and maintenance overhead that can compromise testing reliability.
Manual testing orchestration creates dangerous gaps in coverage and consistency. Without automated test selection and execution based on code changes, teams either run exhaustive test suites that slow deployment, or they skip critical tests that could catch failures.
To add to that, the human element in test coordination introduces variability. What gets tested depends on who’s managing the deployment and how much time pressure they’re under.
Systems without sophisticated rollback mechanisms create further issues when failures do occur. For example, rolling back might require manual intervention, custom scripts, and coordination across multiple systems. In these cases, database rollbacks, infrastructure changes, and configuration updates must be handled separately, which extends recovery time and increases the risk of incomplete remediation.
Perhaps most importantly, poor observability makes it nearly impossible to predict and prevent deployment failures. Without comprehensive monitoring and intelligent alerting, teams operate blindly, discovering problems only after customers are affected.
Modern CI/CD platforms treat quality as a first-class requirement, not an afterthought. Comprehensive testing-framework integration ensures thorough quality validation with minimal setup overhead. The platform is intelligent enough to automatically orchestrate appropriate test suites based on code changes, run tests in parallel to minimize time impact, and provide clear feedback on test results and coverage.
Instead of offering a one-size-fits-all rollback button, modern platforms provide the building blocks for creating robust, automated rollback workflows. That includes support for reverting not just code but also database schema changes and infrastructure configurations.
When failures occur, teams can wire these primitives into automated pipelines that trigger and coordinate rollbacks across all affected systems, ensuring complete and consistent remediation. This approach dramatically reduces mean time to recovery and minimizes the scope of customer impact.
Advanced monitoring and alerting systems provide early warning capabilities that can prevent failures from reaching production. By correlating deployment activities with system performance metrics, these platforms can detect anomalies and automatically halt deployments before they cause customer-facing issues.
Mean time to recovery: Resilience when things go wrong
Even the best teams know that failures are inevitable. What sets elite performers apart from the rest is how quickly they recover. Mean time to recovery (MTTR) measures the average duration required to restore service when a deployment goes wrong.
MTTR capability determines your organization’s overall resilience and risk profile. Faster recovery protects revenue by minimizing downtime costs, preserves customer trust by demonstrating operational competence, and safeguards brand reputation by preventing minor incidents from becoming public relations disasters.
Organizations with elite MTTR performance can take calculated risks and deploy more frequently because they have confidence in their recovery capabilities.
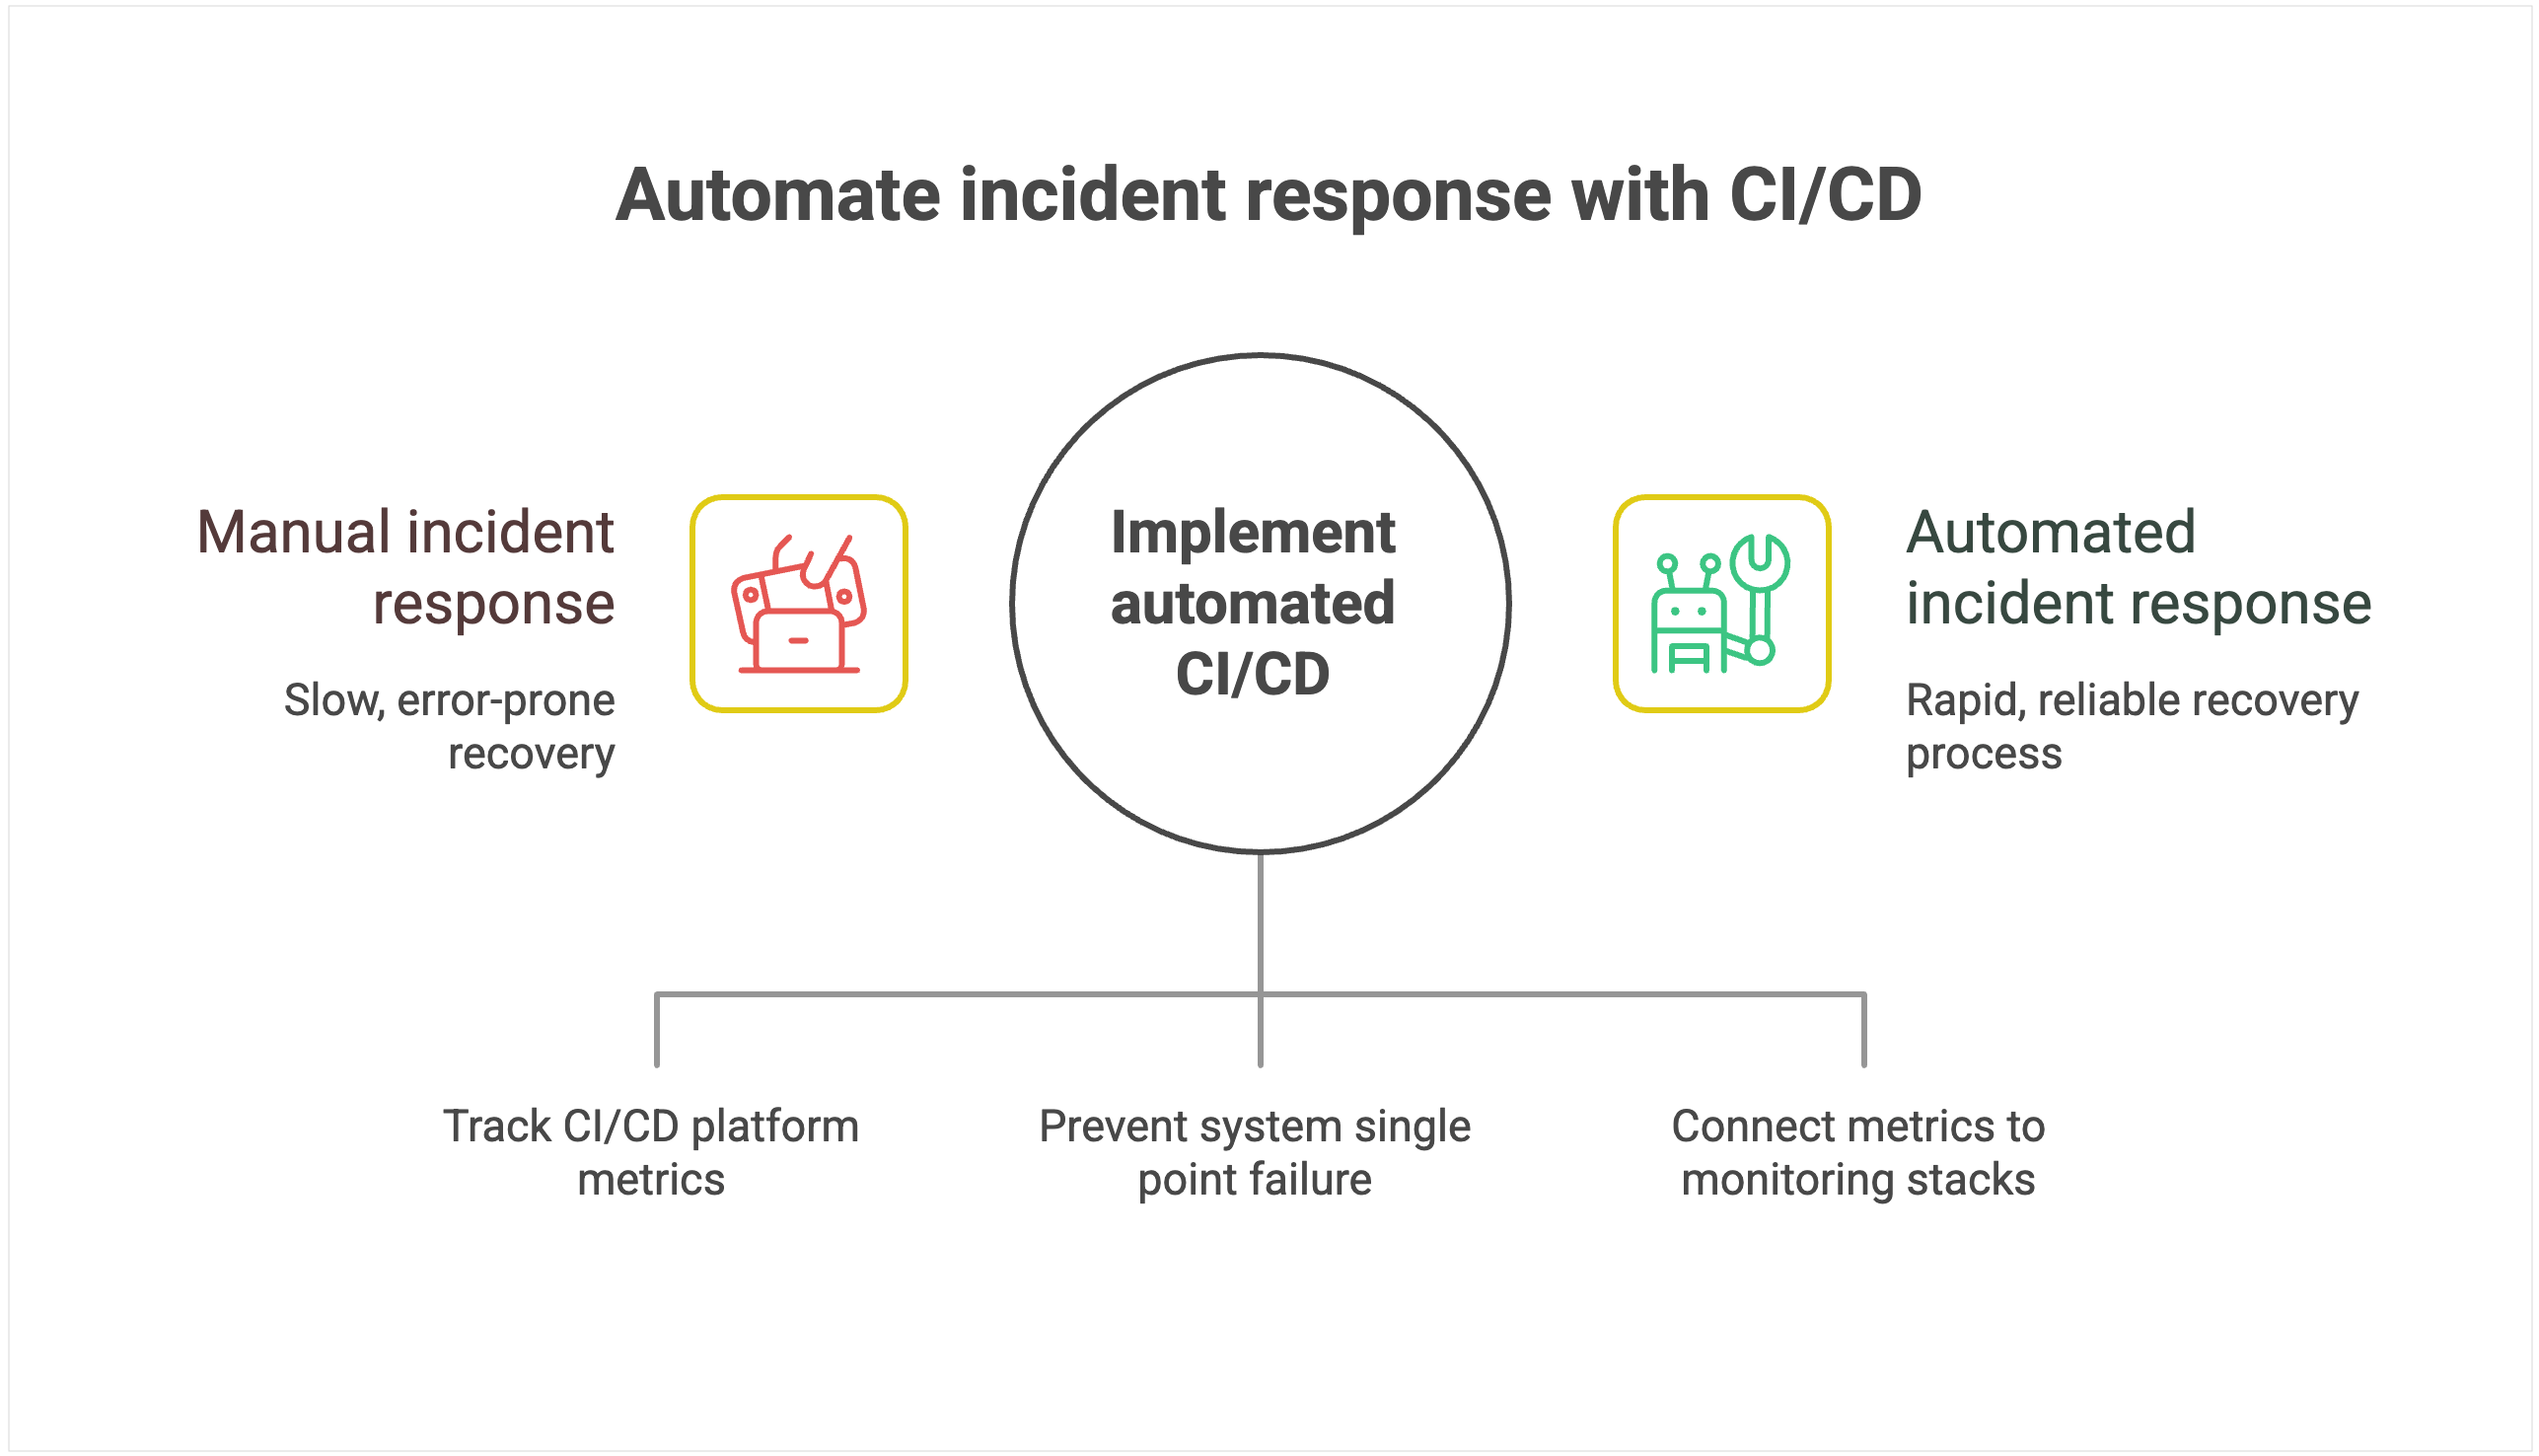
Tooling’s impact on recovery
CI/CD systems that turn incident response into a manual, error-prone process extend downtime. Manual rollback calls for custom pipeline scripts and plugin coordination, which introduces complexity and risk precisely when teams need speed and reliability.
Limited visibility into pipeline execution makes root cause identification painfully slow. Without comprehensive logging, distributed tracing, and correlation between deployment activities and system performance, teams resort to guesswork and trial-and-error debugging. This blind troubleshooting results in extended recovery time and the increased likelihood of incomplete fixes that cause recurring issues.
The lack of automated recovery mechanisms forces organizations to rely entirely on human intervention during high-stress situations. Poor integration with monitoring and alerting systems compounds these problems by delaying incident detection. Teams often learn about failures from customers rather than proactive monitoring.
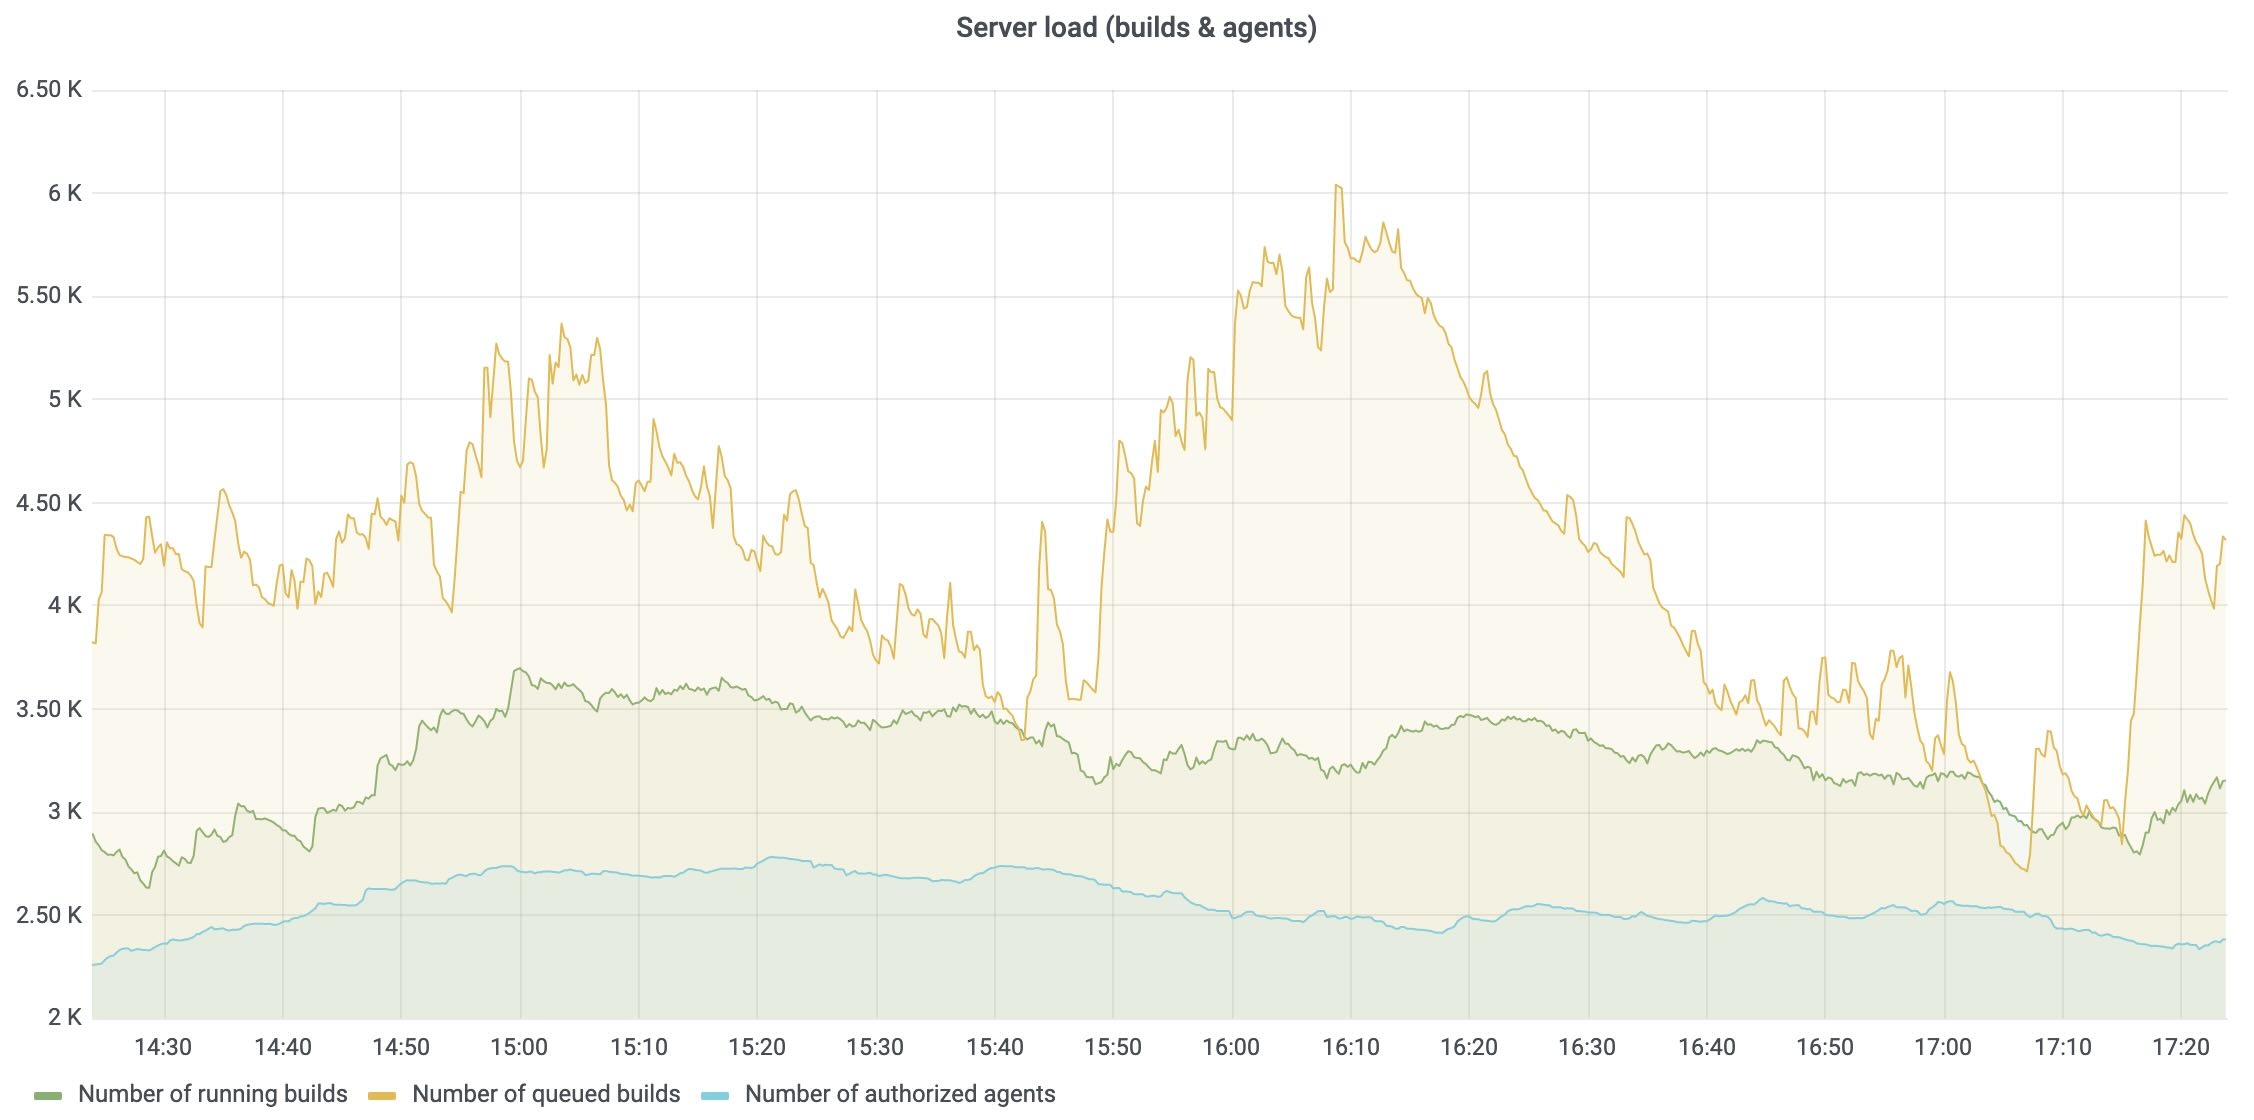
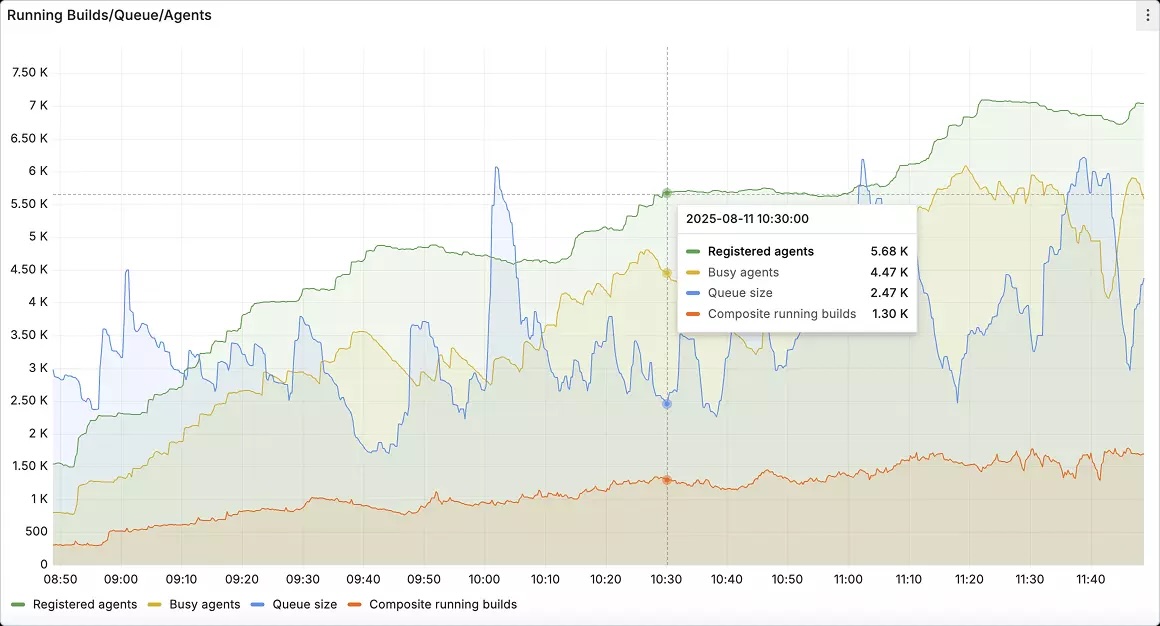
Instead, you want to use a CI/CD platform that offers automated, intelligent response capabilities. For instance, TeamCity’s built-in observability for the CI/CD platform itself tracks server load, agent utilization, build queue health, and pipeline performance. These metrics can be exported to Prometheus and visualized in Grafana so that platform teams can monitor their CI/CD backbone alongside application and infrastructure metrics.
Most modern CI/CD platforms are built with high availability in mind, using multinode configurations and automated failover mechanisms to prevent the system itself from becoming a single point of failure.
This resilience means that even during incidents, the deployment system remains operational, allowing teams to focus on recovery without worrying about the platform going down simultaneously.
Seamless integration with enterprise monitoring and alerting systems makes rapid incident detection and automated response workflows possible.
For instance, teams can connect TeamCity’s metrics to existing monitoring stacks so that anomaly detection triggers rollback procedures automatically, often before customers feel the impact.
Conclusion
CI/CD platforms that require extensive customization, external plugins, and specialized expertise increase operational overhead and introduce security risks, holding your team back.
The strategic advantage belongs to organizations that modernize their CI/CD approach with integrated platforms designed for enterprise scale and elite performance.
Even if you know your legacy solution is holding you back, at what point does it warrant the pain of migration? For some teams, the return on investment is not worth the effort.
To make an informed decision, you must quantify the risks of staying with your legacy system compared to the rewards of migration.
This article was brought to you by Kumar Harsh, draft.dev.
Hyperskill is introducing its own free dedicated plugin inside JetBrains IDEs. This new plugin is built specifically for the Hyperskill learning experience and replaces the previous integration inside the JetBrains Academy plugin. Starting December 11, Hyperskill courses will be available exclusively through the new Hyperskill Academy plugin.
The new Hyperskill Academy plugin provides a more focused and consistent learning environment with all features, tasks, and settings conveniently located in one place. It is designed and maintained directly by the Hyperskill team.
What you’ll get with the new plugin:
A unified environment aligned with the Hyperskill platform.
Faster updates, improvements, and fixes.
Simpler navigation in a single dedicated plugin.
This makes learning smoother and more intuitive, especially for long-term projects.
If you’re currently using Hyperskill courses through the JetBrains Academy plugin, here’s what you need to know and what to do next.
What changes
You’ll need to install the new free Hyperskill Academy plugin from the Marketplace tab in IDE, available after December 11.
The JetBrains Academy plugin will remain available for JetBrains Academy learning courses and Coursera, but it will no longer include Hyperskill courses and projects after the upcoming update.
Your existing Hyperskill projects will still work. No manual migration is needed – your progress and projects will stay safely on Hyperskill and appear automatically once you sign in.
How to continue using Hyperskill courses
The new Hyperskill Academy plugin will be available after December 11, and you’ll be able to install it in your IDE:
Install the new Hyperskill Academy plugin from the Marketplace tab in IDE.
Sign in with your Hyperskill account via Settings/Preferences | Tools | Hyperskill.
Open your projects and continue learning right where you left off.
No manual migration is needed – your progress and projects will stay safely on Hyperskill and appear automatically once you sign in.
We understand that you might have questions regarding this change, so we’ve prepared an FAQ list to address the most common topics.
What will happen to the JetBrains Academy plugin?
The JetBrains Academy plugin will continue to support JetBrains Academy learning courses, but Hyperskill projects will no longer be part of it. For Hyperskill courses and projects, use the new Hyperskill Academy plugin. We recommend updating the JetBrains Academy plugin as usual. This will allow both plugins to work without issues.
When will the Hyperskill plugin be available?
You’ll be able to install the new Hyperskill plugin starting December 11, 2025. Make sure to switch to the Hyperskill Academy plugin right away, as Hyperskill courses won’t be supported in the JetBrains Academy plugin after this date.
How will I be notified when the Hypserkill Academy plugin is live?
On the Hyperskill platform:You’ll see a banner with a direct install button on the Study plan page.
Inside the JetBrains Academy plugin: After updating the plugin, you’ll see in‑plugin messages with guidance once the release is live.
Will this affect my IDE settings?
No. Your IDE preferences (themes, fonts, keymaps, and third‑party plugins) won’t change. Our plugin works on top of your current setup.
Will my existing projects on Hyperskill still work after installing the Hyperskill Academy plugin?
Yes. You can open and continue working on your existing Hyperskill projects after installing the new plugin – no migration required.
Who should I contact if I have questions about the new Hyperskill Academy plugin? Please reach out to Hyperskill Support, or send an email to hello@hyperskill.org.
We’re sure this update will elevate your learning experience and make working with Hyperskill even more seamless and efficient.
With the 2025.3 release, DataSpell continues its mission to make data analysts more productive with the help of AI. In addition to improving DataSpell’s own AI agent, this release expands your options by introducing direct access to Claude Agent from the IDE – with more agents coming soon. DataSpell 2025.3 also includes major visualization workflow enhancements and Jupyter improvements.
Read on to discover everything that’s new in DataSpell 2025.3.
For the first time, DataSpell supports multiple AI agents. You can choose between:
DataSpell AI Agent – designed to operate and control DataSpell features via requests made directly in the AI chat.
Claude Agent – great for code assistance and documentation.
Simply open the AI chat, pick your agent, and start collaborating. More agents will be added in future updates.
Visualization enhancements
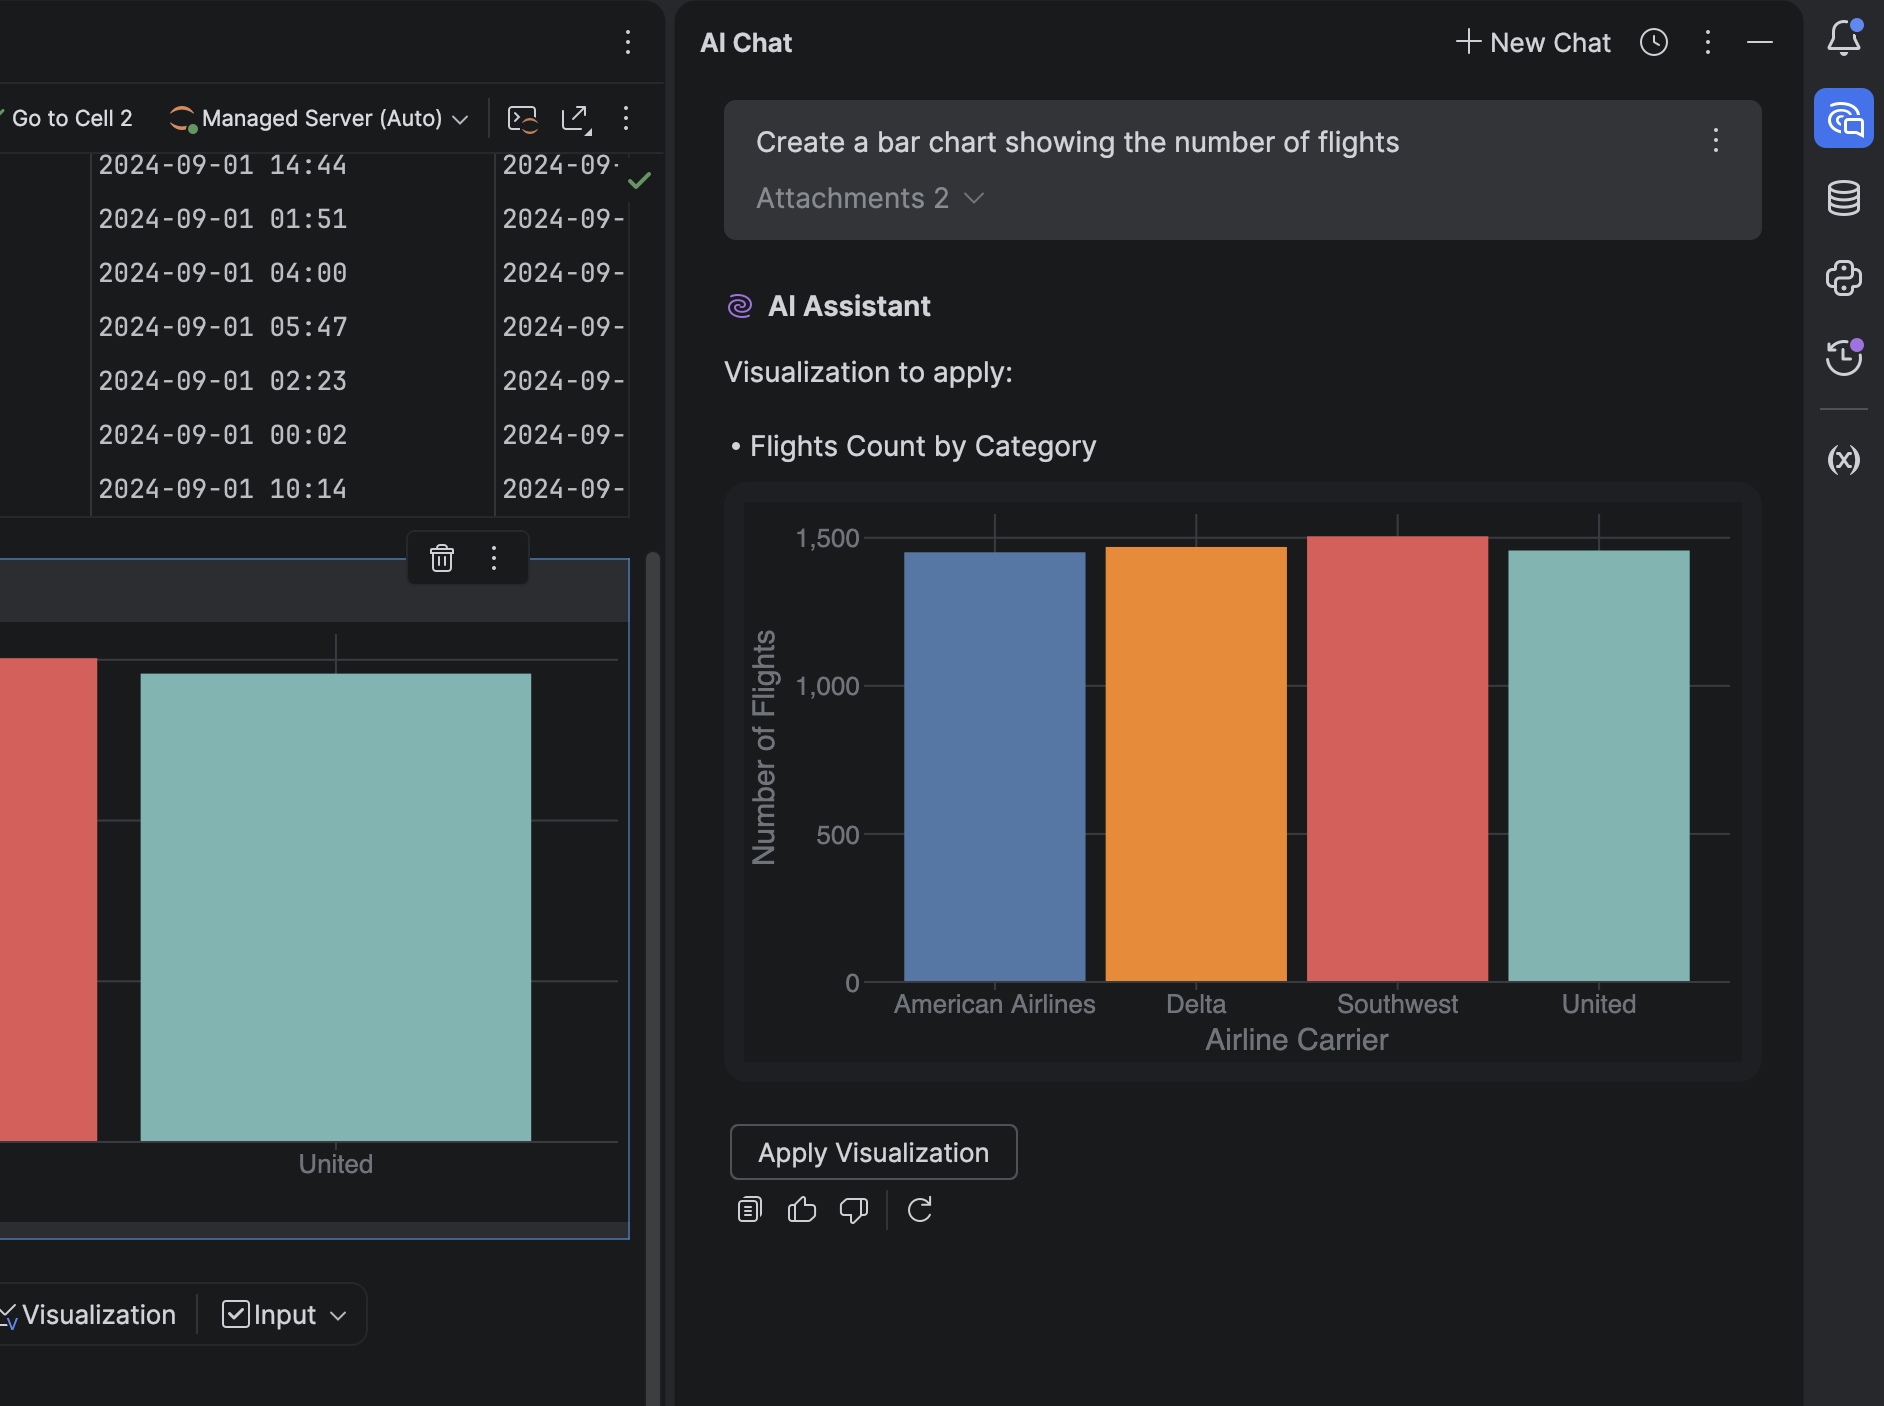
In-chat visualizations
It’s now possible to generate and view charts directly in the AI chat – no extra steps required. DataSpell AI agent can:
Understand datasets automatically.
Generate visualizations as JSON-based specs.
Display visualizations in the chat or in dedicated visualization cells.
This makes exploratory data analysis smoother and more interactive.
Visualization cells in notebooks
We’ve added support for visualization cells, a new, no-code way to explore and present data in notebooks. You can now:
Add visualizations without writing code.
Instantly view visualizations inline.
Edit charts directly in the new no-code chart editor.
Jupyter improvements
DataSpell now automatically detects:
Missing values
Outliers
Duplicates
Format inconsistencies
Correlated or redundant features
You’ll get AI-powered suggestions to fix these issues instantly. Click Fix with AI to insert a new cell in the same Jupyter notebook with code generated to resolve the relevant issue.
Database updates
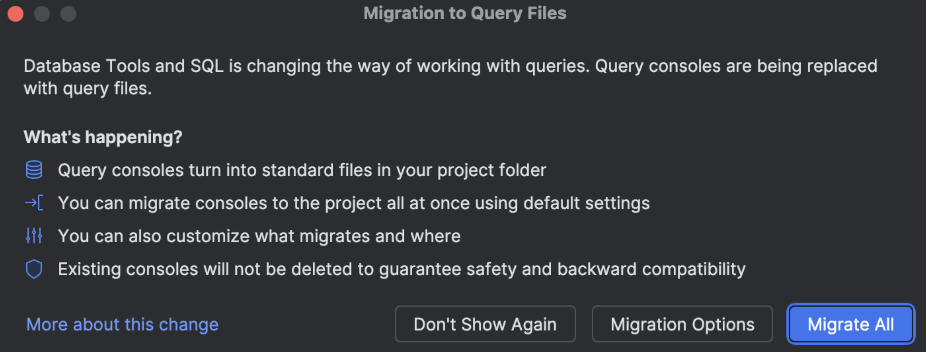
Query files
Following their addition to DataGrip, DataSpell now also uses query files in place of query consoles for a smoother and more consistent SQL workflow. Upon first launch after updating, you’ll be prompted to migrate your existing consoles automatically.
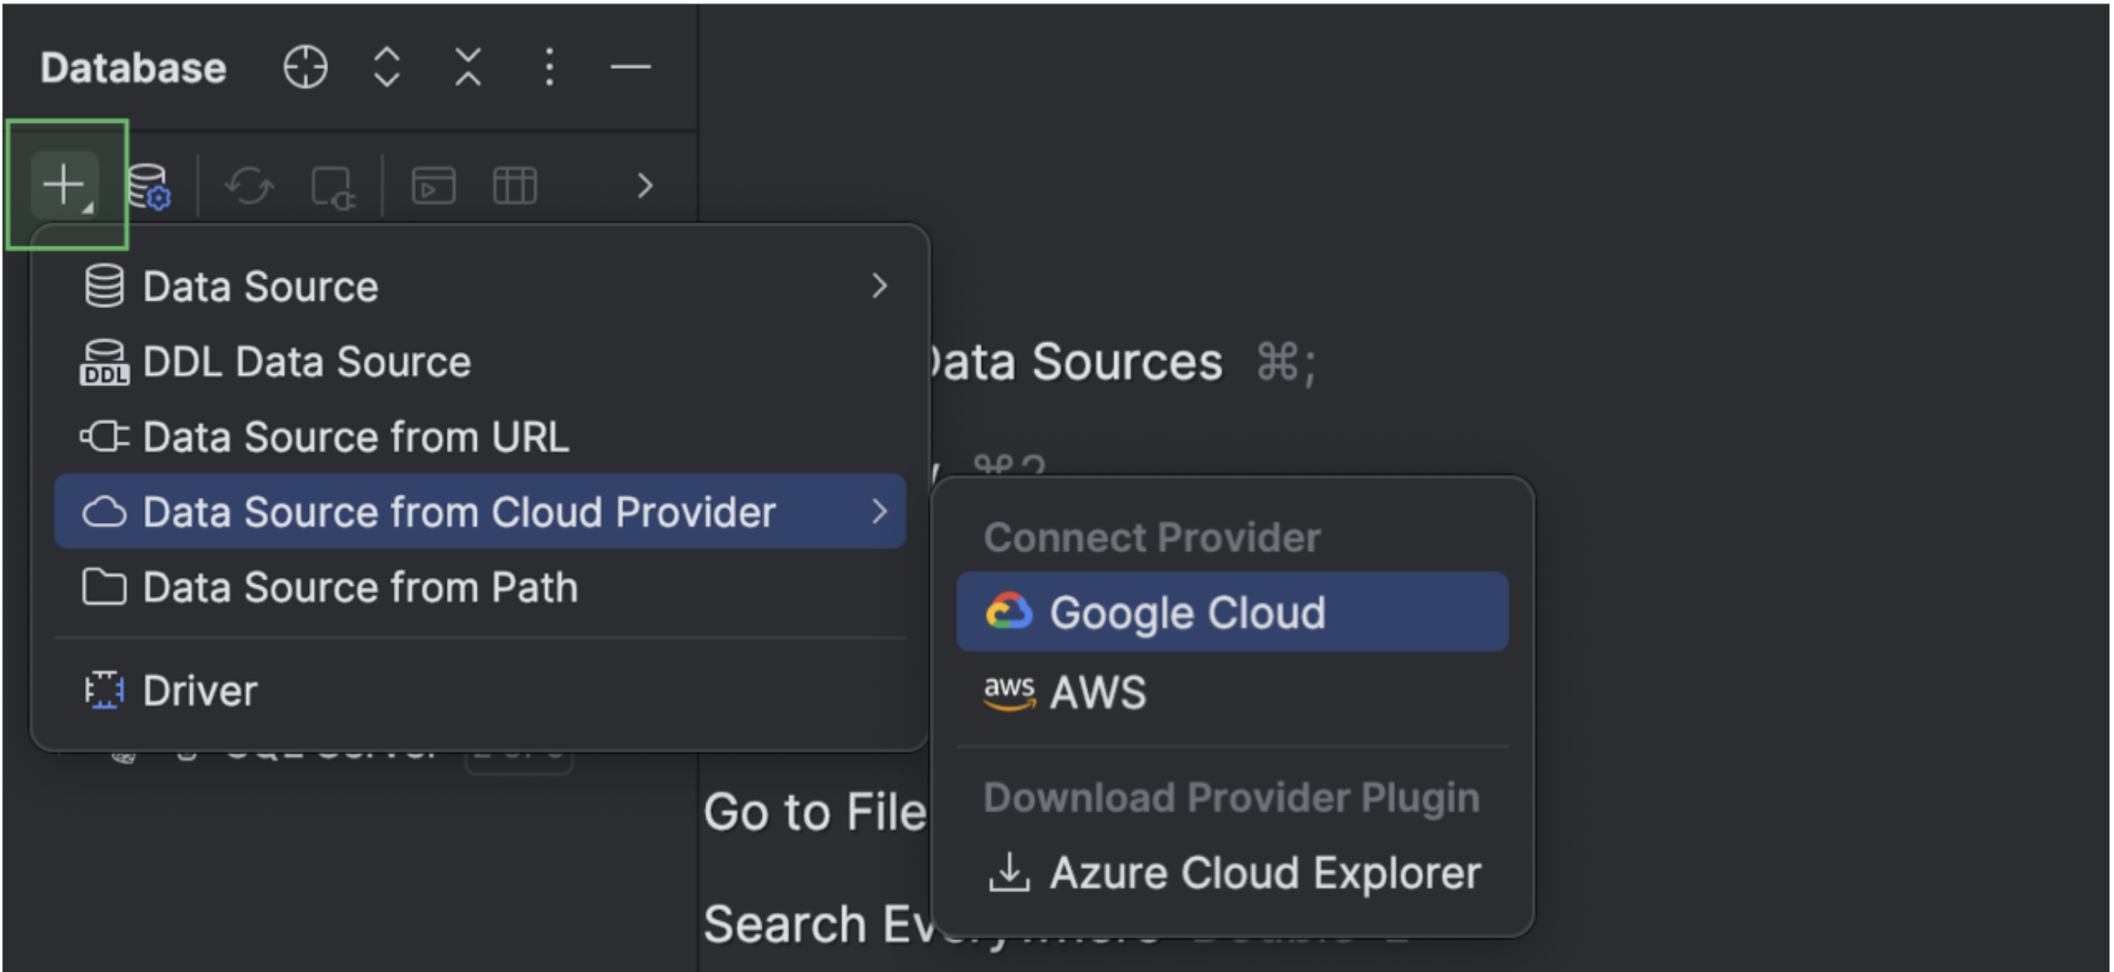
Cloud database connections
DataSpell now integrates with AWS, Azure, and Google Cloud. Connect your cloud accounts directly from the IDE, browse available databases, and create new data sources with a single click. All connected accounts appear under the Cloud tab in the Data Sources and Drivers dialog.
Islands theme by default
The Islands interface theme is now the default for DataSpell and is available in both dark and light variants. This update modernizes the visual experience without altering your workflows. To turn the new theme on or off, open the IDE Settings dialog and navigate to the Appearance & Behavior settings page.
We hope you enjoy exploring DataSpell 2025.3! This release marks another milestone in making DataSpell the most intelligent, context-aware IDE for data professionals. If you encounter a bug or have a feature suggestion, please share it on our issue tracker. Stay up to date on new features and data analysis tips – subscribe to our blog and follow us on X!
This isn’t a product launch or a marketing campaign – it’s a chance to have an open conversation about RubyMine and the challenges you face as a Ruby and Rails developer.
How to Participate
When: December 11, 1:00–5:00 pm CET (7:00–11:00 am EST)
Format:Drop your questions in the AMA thread anytime during the session. We’ll be online responding in real time, but if you can’t make it live, you can post your questions early. This AMA is your chance to tell us what matters most, what’s working well, what’s not, and where we can do better.
Who You’ll Be Talking To
The following members of the RubyMine team will be there to answer your questions:
We know that great tools are built in collaboration with the people who use them every day. That’s why we want to talk directly with you about not only features, but how RubyMine actually fits into your daily workflows.
Your feedback is foundational to our roadmap. It helps us boost performance, refine the tools you already rely on, and choose what to build next.
The RubyMine AMA is part of JetBrains AMA Week, a series of live Reddit discussions where teams from across JetBrains are connecting directly with their communities. Each AMA focuses on a specific product, giving users a space to share their experiences, ideas, and feedback.
If you have questions about JetBrains AI Assistant features specifically, the AI team is doing an AMA on December 12 at 1:00–5:00 pm CET, where they’ll be able to answer questions about their strategy and the direction they’re headed in. We’re happy to discuss how AI features work in RubyMine and your feedback on them, but for more general questions about JetBrains AI, you’ll be better off consulting the AI team.